Legislative Analyst's Office
The 2002-03 Budget Bill:
|
Economic and demographic trends will have important effects on California's 2002-03 budget outlook. For example, the strength of California's economy is an important factor determining the level of revenues collected from the state's major taxes. Similarly, both economic and demographic variables affect state government expenditure programs, including those relating to education, health and social services, and youth and adult corrections.
In this part, we review recent economic developments for the nation and state, discuss the Governor's economic forecast, and present our own perspective on California's economic outlook. We also discuss current demographic developments and highlight our population projections through 2004.
Our Bottom Line. The U.S. and California economies are nearly one year into a recession that was initially caused by such factors as sharp declines in spending by businesses on capital goods, and then aggravated by the September 11 terrorist attacks. The downturn has been mild so far in terms of employment, although more severe in terms of income losses. Our forecast is that the recession will conclude in the next couple of months and that a sustained expansion will begin before mid-year. While employment will recoup its losses by the end of 2002, the decline in income related to stock options will be longer lasting. Our outlook is predicated on (1) a rebound in high-tech spending in the second half of the year and (2) the absence of significant terrorism-related disruptions to the national or state economies.
After a record-long expansion, the U.S. economy fell into recession in early 2001. The main factors initially behind the downturn were: (1) a drop in business investment, caused partly by a plunge in spending on computers and software following the Y-2K boom; (2) economic slowdowns among our key trading partners, which resulted in a steep decline in exports; and (3) an abrupt cutback in production and employment by manufacturers, made in an effort to keep inventories under control.
The September 11 terrorist attacks aggravated the slowdown, as personal and business travel fell sharply and airlines quickly announced major cutbacks. Other industries affected by the aftermath of September 11 were airline manufacturers (which experienced major reductions and cancellations of aircraft orders) and travel-related businesses (such as convention centers, eating and drinking establishments, and entertainment facilities, all of which suffered from declines in tourism and business travel). While consumer confidence and spending partially recovered in November and December, businesses remained extremely cautious, holding the overall economy in check through the end of the year.
Figure 1 shows the extent to which the recent downturn in the U.S. economy has been business- and globally-driven. Total gross domestic product (GDP) increased a marginal 0.1 percent between the fourth quarter of 2000 and the fourth quarter of 2001, reflecting gains in the first half and moderate declines in the second half of the year. Underneath this overall modest change, however, were sharply diverging trends in different economic components. Specifically:
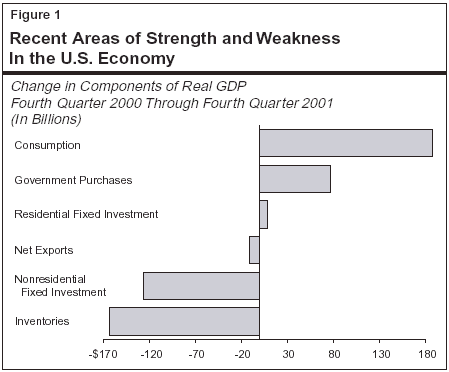
While the liquidation of inventories depressed real GDP in 2001, the reduced supplies of finished goods is a positive factor in the near-term outlook. The depletion of inventories implies that manufacturers will need to step up production quickly in order to fill new orders once that spending starts to increase.
The California economy faced enormous challenges in 2001. These included the high-tech slowdown, declines in stock market-related wealth and income, soaring energy prices, fading exports, and uncertainties early in the year associated with threats of rolling blackouts. As with the nation, California's slowdown was aggravated by the September 11 terrorist attacks, which led to major layoffs in the air transportation and other travel-related industries within the state.
In view of all of the challenges facing the state last year, job losses in California can be considered reasonably modest. Even after taking into account recent downward revisions to historical data, job losses in this state have been proportionally smaller than for the nation as a whole.
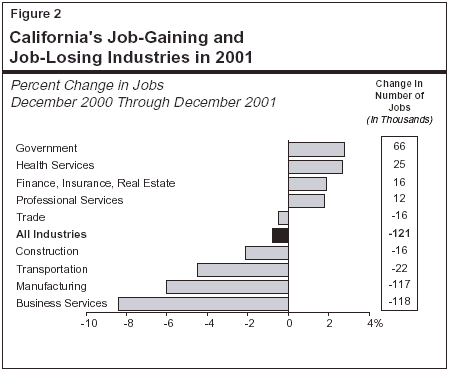
Figure 2 shows how key California employment sectors were affected by the economic downturn in 2001. Clearly, the losses were concentrated in business services and manufacturing. The losses in these two sectors were predominately related to the slump in high-tech activities, although other forces, such as inventory cutbacks and weak exports, also had an impact. Losses also occurred in the transportation industry—reflecting the post-September 11 layoffs of airline employees—as well as in the trade and construction industries. The figure also shows that several industries experienced growth last year, including government, health services, professional services, and finance.
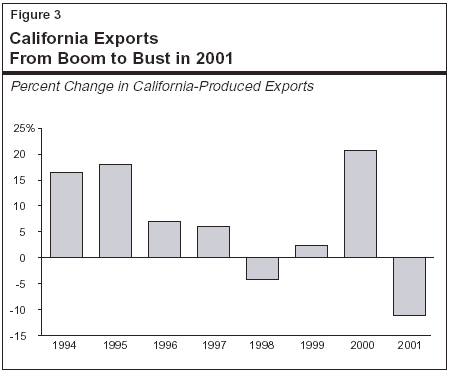
Exports Fell Sharply. As noted above, a significant factor in the downturn in manufacturing has been a sharpdecline in exports. This decline stems from global weakness in economic activity, particularly in Asia and Latin America. Figure 3 shows that, after jumping 20 percent in 2000, total exports of California-produced goods fell by an estimated 11 percent for all of 2001, and by more than 20 percent in the second half of the year. The decline was concentrated in the computer and electronics sectors, which account for over one half of total California exports.
It is likely that exports will remain flat in 2002 before growing in 2003. The outlook could be even weaker, however, if the expected rebounds in foreign countries fail to materialize. A special concern involves Japan. It is California's second leading export market, remains mired in recession, and its currency (the yen) continues to lose value in international currency markets. This reduction in its currency value makes U.S. goods more expensive in Japan's markets. Japan's problems are also having indirect impacts on the economic strength of other California trading partners in Asia, to the extent that many developing countries in the region rely on exports to Japan as a key source of economic growth.
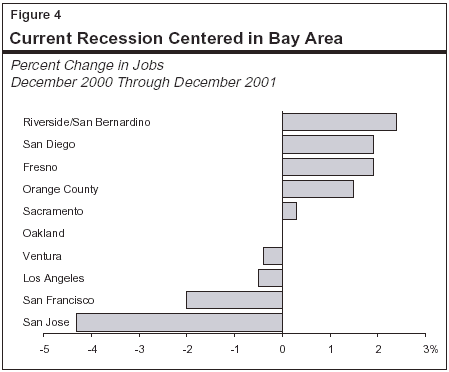
In marked contrast to the early 1990s' recession—which was centered in Southern California—the current downturn is being felt most intensely in the Bay Area. Figure 4 shows that most major metropolitan regions within Southern California experienced modest job growth in 2001. The major exception was Los Angeles, where employment fell by 0.5 percent last year, due to declines in manufacturing, wholesale trade, and motion picture production. Modest job gains also occurred in the Fresno and Sacramento metropolitan regions in the Central Valley. In contrast, significant job losses occurred in the San Jose and San Francisco metropolitan areas, reflecting major declines in manufacturing and business services, and moderate declines in a wide variety of other industry sectors.
In the opening months of 2002, there have been some positive signs that the U.S. and California economies are stabilizing. These include reported increases in consumer and business confidence, increased air-passenger loads, declines in new unemployment insurance claims, and increases in hotel occupancy rates. One key positive factor, particularly for California, has been the recent decline in inflation. After accelerating in 2000 and early 2001, price indices for key commodities (such as gasoline, natural gas, food, clothing, and rents) stabilized and in some cases declined in the latter half of the year. Falling prices have the positive effect of making household discretionary incomes and business margins less depressed than they otherwise would be in the current recessionary environment.
The Governor's budget forecast assumes that both the U.S. and California economies will stabilize in the first quarter of 2002 and then begin a sustained moderate expansion in the spring. As shown in Figure 5, real GDP is projected to increase 0.5 percent in 2002 and 4.4 percent in 2003. The administration also projects that the recent slowdown in inflation will continue in 2002 and 2003. For example, the U.S. Consumer Price Index is forecast to increase by only 1.8 percent in 2002 and 2.2 percent in 2003.
|
Figure 5 Summary of the Budget’s Economic Outlook |
|||
|
|
|
Forecast |
|
|
|
2001 |
2002 |
2003 |
|
U.S. Forecast |
|
|
|
|
Percent change in: |
|
|
|
|
Real GDP |
1.1% |
0.5% |
4.4% |
|
Personal income |
5.0 |
2.6 |
5.6 |
|
Wage and salary employment |
0.3 |
-0.5 |
1.1 |
|
Consumer Price Index |
2.9 |
1.8 |
2.2 |
|
Unemployment rate (%) |
4.8 |
6.2 |
5.7 |
|
Housing starts (000) |
1,590 |
1,570 |
1,510 |
|
California Forecast |
|
|
|
|
Percent change in: |
|
|
|
|
Personal income |
1.4% |
2.6% |
7.5% |
|
Wage and salary employment |
1.8 |
0.3 |
2.4 |
|
Taxable sales |
-2.0 |
0.8 |
7.5 |
|
Consumer Price Index |
4.1 |
1.7 |
1.8 |
|
Unemployment rate (%) |
5.2 |
6.2 |
5.9 |
|
New housing permits (000) |
142 |
145 |
149 |
|
|
|||
Regarding California, the administration forecasts that wage and salary employment will increase a marginal 0.3 percent in 2002, before accelerating to 2.4 percent in 2003. It also projects that personal income will accelerate from 1.4 percent in 2001, to 2.6 percent in 2002, and 7.5 percent in 2003.
In general terms, our updated forecast is similar to both our November projection and the administration's January budget forecast. We continue to believe that California's mild recession will give way to a moderate recovery beginning in spring 2002. The key uncertainty remains the strength and timing of the expected revival in business investment spending on information technology goods and services. Our national and state economic forecasts through 2004 are displayed in Figure 6.
|
Figure 6 Summary of the LAO’s Economic Outlook |
||||
|
|
|
Forecast |
||
|
|
2001 |
2002 |
2003 |
2004 |
|
U.S. Forecast |
|
|
|
|
|
Percent change in: |
|
|
|
|
|
Real GDP |
1.1% |
0.5% |
3.8% |
3.8% |
|
Personal income |
4.8 |
2.1 |
5.4 |
5.7 |
|
Wage and salary employment |
0.4 |
-0.4 |
1.3 |
1.8 |
|
Consumer Price Index |
3.1 |
2.0 |
2.4 |
2.6 |
|
Unemployment rate (%) |
4.8 |
6.2 |
5.9 |
5.3 |
|
Housing starts (000) |
1,600 |
1,550 |
1,530 |
1,580 |
|
California Forecast |
|
|
|
|
|
Percent change in: |
|
|
|
|
|
Personal income |
1.2% |
2.8% |
7.6% |
7.8% |
|
Wage and salary employment |
1.3 |
-0.4 |
2.5 |
2.6 |
|
Taxable sales |
-1.9 |
2.6 |
7.7 |
7.3 |
|
Consumer Price Index |
4.1 |
2.4 |
2.2 |
2.6 |
|
Unemployment rate (%) |
5.5 |
6.5 |
5.7 |
5.3 |
|
New housing permits (000) |
147 |
143 |
158 |
161 |
|
|
||||
Following its 1 percent increase in 2001, we forecast that U.S. real GDP will increase by 0.5 percent in 2002 (reflecting small declines in the first half and accelerating increases in the second half), before rebounding to a 3.8 percent growth rate in both 2003 and 2004. Key forces behind the acceleration include: (1) the stimulative effects of past interest rate cuts by the Federal Reserve; (2) spending increases and tax reductions by the federal government; (3) the recent observed rebound in consumer confidence; and (4) the recent declines in business inventories, which means that new spending will need to be matched by increased manufacturing output.
Economic growth during the early stages of the expansion is likely to be somewhat muted by historical standards. This is partly a reflection of the mild nature of the current recession. Some categories of GDP that are traditionally hard hit during recessions—such as housing and durable goods spending—have held up during this downturn, leaving less "pent up" demand for new products once the expansion begins. A related factor is that, because consumers kept spending through the downturn, they have not "worked off" their debt loads that were built up during the past expansion.
We expect growth to gain some momentum in late 2002 and into 2003 as a result of stepped-up business spending. Increased government outlays for defense and security-related purposes are also likely to provide a boost to GDP in 2003 and beyond.
We forecast that California's economy will stabilize in early 2002 and begin a sustained recovery prior to mid-year. In its early stages, California's rebound will be powered by the same forces as those boosting the national economy—namely, expansionary monetary and fiscal policies, improving consumer confidence, increased travel and tourism, and a restocking of business inventories. The recovery should gain momentum in the second half of the year, as the anticipated rebound in capital spending "kicks in." Regionally, we expect that the recovery will come earlier and be stronger in Southern California than in the Bay Area, but all regions should be growing by 2003.
As indicated in Figure 6, we forecast that California wage and salary employment will fall 0.4 percent in 2002, reflecting weakness in the first half and improving conditions late in the year. Personal income growth is expected to improve from 1.2 percent in 2001, to 2.8 percent in 2002, and 7.6 percent in 2003.
In terms of job losses, the current recession is expected to be much milder and shorter-lived than the other two recessions that California has experienced during the past 20 years. Figure 7 contrasts the current downturn to the recessions that occurred in 1981 to 1982 and 1990 to 1993, by showing for each the cumulative four-year percent change in employment that occurred following its pre-recessioeak. It shows that:
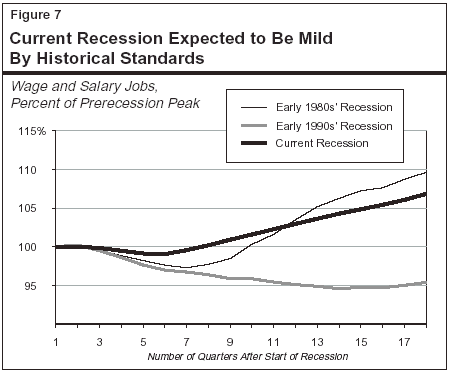
Thus, in terms of lost jobs and output, the current recession is nowhere near as severe as the previous two downturns.
While this recession has been fairly mild in terms of its impact on California employment, the effects on income have been much more pronounced. As indicated in Figure 8:
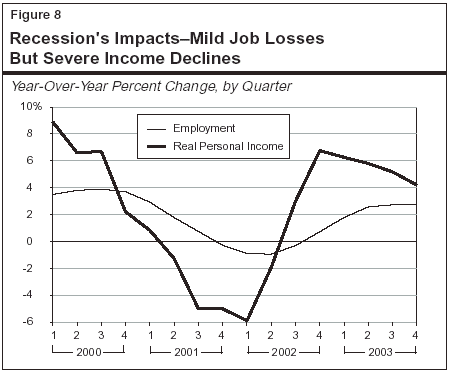
The sharp decline in personal income is primarily due to the dramatic drop in stock options related income, as well as a slump in business profits in 2001 and early 2002. At its peak, we estimate that income from stock options totaled over $80 billion in 2000, representing about 8 percent of total personal income during the year. As a result of the major decline that occurred in stock prices—especially among high-tech companies that had been the major sources of stock options earnings in the past—we estimate that options-related income fell to $21 billion in 2001, a decline of about 75 percent.
Our forecast assumes that income from stock options will partly rebound in 2002 and 2003, increasing by 15 percent in each of the two years. Even with these increases, however, option-related income would only be $28 billion in 2003, or about one third the 2000 peak. As discussed in "Part III," the decline in options is having major adverse effects on California's revenues in 2001-02 and beyond. (We note in "Part III" that capital gains also fell in 2001. Our discussion in this section is focused on stock options because, under current income accounting methods, options are counted as part of personal income whereas capital gains are not.)
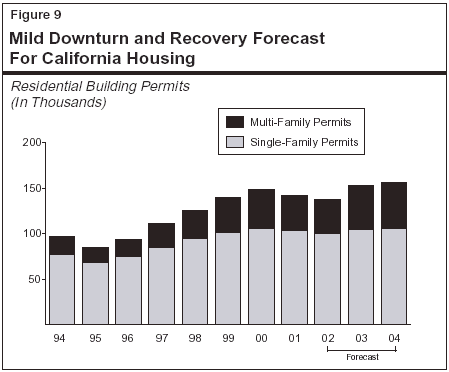
In contrast to the 1980s' and 1990s' recessions, building activity in the 2001 downturn has held up remarkably well. As shown in Figure 9, construction permits are expected to fall slightly from 149,000 in 2000 to 143,000 by 2002, before recovering in 2003. Part of the reason for the mild cycle is simply that housing starts never really "took off" in the 1990s' expansion, as they had in the 1970s' and 1980s' post-recession growth periods. By some estimates, home construction for the past decade has been below the 160,000 to 180,000 units needed to replace existing homes and keep up with California's growing population. The limited amount of new housing has led to low inventories of new homes and excess demand in many regions of the state. This, in turn, has kept home sales and new construction from falling by as much as in past downturns.
In contrast to residential construction activity, nonresidential building increased sharply in the 1990s' expansion, reaching an all-time high of $19 billion in total real (that is, inflation-adjusted) valuations in 2000. With the onset of the recession, however, businesses put expansion plans on hold and this led to substantial declines in permit activity. As of November, permit valuations had fallen back to an annual rate of $13 billion. Although some of the late 2001 decline may have been related to business uncertainties following September 11, we expect that permits will remain soft until late in 2002, when businesses gain confidence that economic conditions are improving. On an annual basis, we estimate that permit valuations averaged $16.5 billion for all of 2001, a decline of 14 percent from their 2000 peak. We forecast that nonresidential real permit valuations will total $14 billion for all of 2002, before partly rebounding to $16 billion in 2003.
Figure 10 compares our forecasts for the nation and California to our November 2001 forecasts as well as a variety of other forecasts made in recent months. These include the projections made by the University of California, Los Angeles (UCLA) Business Forecasting Project in December 2001, the consensus forecast published in the Blue Chip Economic Indicators (January 2002), the consensus outlook in the Western Blue Chip Economic Forecast (February 2002), and the Governor's budget forecast.
|
Figure 10 Comparisons of Recent Economic Forecastsa |
|||
|
(Percent Changes) |
|||
|
|
2001 |
2002 |
2003 |
|
United States Real GDP: |
|
|
|
|
LAO November |
1.0% |
0.8% |
4.0% |
|
UCLA December |
1.1 |
0.4 |
3.5 |
|
DOF January |
1.1 |
0.5 |
4.4 |
|
Blue Chip “Consensus”b January |
1.0 |
1.0 |
3.4 |
|
LAO February |
1.1 |
0.5 |
3.8 |
|
California Wage and Salary Jobs: |
|
|
|
|
LAO November |
1.8% |
0.4% |
2.4% |
|
UCLA December |
1.9 |
0.7 |
2.2 |
|
DOF January |
1.8 |
0.3 |
2.4 |
|
Blue Chip “Consensus”c February |
1.8 |
0.6 |
2.4 |
|
LAO February |
1.3 |
-0.4 |
2.5 |
|
California Personal Income: |
|
|
|
|
LAO November |
1.7% |
4.2% |
7.8% |
|
UCLA December |
2.1 |
1.3 |
5.6 |
|
DOF January |
1.4 |
2.6 |
7.5 |
|
Blue Chip “Consensus” February |
3.2 |
3.0 |
6.5 |
|
LAO February |
1.2 |
2.8 |
7.6 |
|
California Taxable Sales: |
|
|
|
|
LAO November |
-2.0% |
3.9% |
7.9% |
|
UCLA December |
0.3 |
3.5 |
5.7 |
|
DOF January |
-2.0 |
0.8 |
7.5 |
|
Blue Chip “Consensus” February |
1.7 |
2.9 |
5.6 |
|
LAO February |
-1.9 |
2.6 |
7.7 |
|
a Acronmyms used apply to Legislative Analyst's Office (LAO); University of California, Los Angeles (UCLA); and Department of Finance (DOF). |
|||
|
b Average forecast of about 50 national firms surveyed in January by Blue Chip Economic Indicators. |
|||
|
c Average forecast of organizations surveyed in February by Western Blue Chip Economic Forecast. |
|||
|
|
|||
Our overall forecast for both the nation and California is more conservative than the consensus projections cited above. It is similar, however, to both the UCLA and Governor's budget forecasts, which call for a recovery beginning near the middle of 2002. With regard to estimates of specific California economic measures:
Although economic forecasts are always subject to error, this can be especially true when economies are transitioning into and out of recessions. Even if California's economic recovery emerges in the spring as we expect, for example, its strength could differ from what we are projecting. Among the key risks and uncertainties potentially affecting the recovery's exact timing and strength are:
California's demographic trends both directly and indirectly affect the state's economy, revenue collections, and expenditure levels. For example, they influence the size of the labor force, the demand for autos and homes, the volume of taxable sales, and the amount of income taxes paid. Similarly, the population and its age distribution affect school enrollments and public programs in many other areas, such as health care and social services. Given this, the state's demographic outlook is a key element in assessing and projecting the state's budgetary situation.
Our updated demographic forecast is summarized in Figure 11. We forecast that California's total population will rise from an estimated 35.2 million in 2002, to 35.8 million in 2003, and 36.4 million in 2004. These population levels reflect published 2000 Census data and recent decisions by the federal government involving the issue of adjusting its Census data for demographic undercounts (see discussion that follows). California's current annual growth rate of roughly 1.6 percent is well above the nation's current rate of about 1.2 percent annually.
|
Figure 11 Summary of the LAO's California Demographic Forecast |
|||
|
(Population in Thousands) |
|||
|
|
2002 |
2003 |
2004 |
|
Total population (July 1 basis) |
35,230 |
35,785 |
36,363 |
|
Changes in population |
|||
|
Natural change (births minus deaths) |
271 |
275 |
278 |
|
Net in-migration (in-flows minus out-flows) |
310 |
280 |
300 |
|
Total changes |
581 |
555 |
578 |
|
Percent changes |
1.68% |
1.58% |
1.61% |
|
|
|||
Census Results and the UndercountBackground. Last year at this time, considerable ongoing controversy was occurring about whether the Census 2000 results should be adjusted for an anticipated undercount and, if so, how this should be accomplished. In the 2001-02 Perspectives and Issues, we discussed the issue of using statistical sampling to adjust for the undercount, and indicated that by March 2001 we anticipated having adjusted Census 2000 California data available from the U.S. Census Bureau. Recent Developments. As anticipated, the bureau released California's 2000 Census total population count and basic demographic profile in March of 2001. In addition, it released a preliminary undercount adjustment for the nation as a whole although state-level data adjusted for any undercount were not released at that time. Later in 2001, however, the bureau concluded that there was very little undercount for the nation overall, rescinded its preliminary national undercount adjustment, and decided not to release a revised Census data set. The bureau did acknowledge that differential undercounts were likely to exist in different subgroups of the population, but did nothing to address this issue. Current Situation. At this time, there are no data available on which to adjust California's published Census data. The Department of Finance, however, has made a Freedom of Information Act request of the bureau to provide the information necessary for the state to develop its own adjustment to California's published 2000 Census data to account for any undercount. California's Population Has Traditionally Been Undercounted. Although the amount of any undercount of Californians is not currently known, it is known that California's demographic characteristics reflect many population subgroups that are traditionally undercounted in census enumerations. For example, California has a diverse population, including the largest Hispanic population in the nation and the fifth largest black population, according to the 2000 Census. Both of these subgroups are traditionally undercounted and had much higher estimated undercount rates in 1990 than other ethnic groups. Likewise, Census undercounts also tend to be higher in states with younger populations, which makes California even more at risk for undercount since California's median age is nearly two years less than the nation's. Similarly, California also has the largest foreign-born population in the nation—over 30 percent—that experts believe also raise the likelihood of an undercount. The state's highly mobile population is yet another reason. Given these factors, it is very likely that the 2000 Census data would much better reflect California's actual population if it was adjusted for an undercount, utilizing whatever unpublished statistically reliable data the bureau has previously developed using sampling and other techniques. Implications for California. The decision of the bureau to not release 2000 Census data that has been adjusted for an undercount could have significant implications for California. For instance, many grants from the federal government are based on the bureau's estimates; thus, if unadjusted data are used to allocate such monies, California could be placed at a relative disadvantage. In addition, unadjusted data could lead to more inaccurate estimates of the funding levels needed to provide minimum levels of service to California's population. Another problem is that the use of unadjusted data biases the basic information relied on in evaluating infrastructure needs and projecting the state's economy. |
Growth Exceeds Half-a-Million People Annually. California is adding over 550,000 people each year—roughly equivalent in size to a city like Long Beach or the entire state of Vermont. About half of this yearly growth is attributable to net in-migration (inflows from minus outflows to other nations and states), while the remainder is due to "natural" increase (that is, births in excess of deaths). Foreign in-migration dominates the net in-migration component, as more than a net quarter-million people enter California from foreign countries annually.
Legislative Analyst's Office Projections Based on Published 2000 Census. In making our projections, we have updated our demographic forecasting model to incorporate the available 2000 Census data for California that was released in March 2001. At this time, the only 2000 Census data available is the "raw" data count, which has not been adjusted for any possible undercount that may have occurred during the Census process. As discussed in the shaded box, the U.S. Census Bureau is not making estimates of the undercount available at this time, and in fact has taken the position that previous estimates of the undercount are not reliable.
Disagreement Exists Regarding Domestic Migration Estimates. The bureau and the Department of Finance (DOF) currently disagree regarding what California's current population is and how much net domestic migration the state is experiencing. For instance, the bureau estimates that there were 34.5 million residents in California as of July 1, 2001, while DOF estimates nearly 34.8 million—a 300 thousand difference. Our current forecast lies between these two extremes.
The main difference between these different total population forecasts involves net domestic migration. The bureau believes that a large domestic outflow from California to other states occurred between 2000 and 2001, based on change-of-address data from the Internal Revenue Service (IRS). In contrast, both DOF and we believe that a net domestic population inflow into California occurred between 2000 and 2001—with our estimate being 120,000 and DOF's over 140,000. While DOF and we also use change-of-address information in making our estimates, we both rely on data from the driver's license records maintained by the California Department of Motor Vehicles. We believe these data are superior to IRS data for making domestic net-migration calculations. We do, however, believe that DOF's estimate is too high, given that California's domestic migration inflows lessen somewhat when its economy weakens, as was occurring throughout 2001.
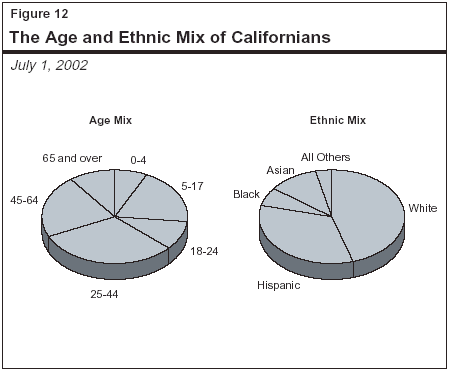
The implications of population trends for the budget depend not only on the total number of Californians but also on their characteristics. California's population continues to be not only the largest, but also the most diverse, in the nation. For example, the state's population reflects a rich mix of different ethnicities; a large number of people from other nations and states; a broad age distribution; and considerable geographic dispersion amongst urban, suburban, and rural areas. The state's current age and ethnic mix is shown in Figure 12.
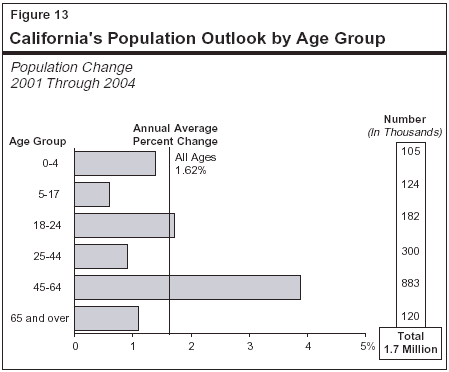
Growth by Age Group. The age-related characteristics of California's population growth are especially important from a budgetary perspective, given their implications for such program areas as education, health care, and social services. Figure 13 shows our forecasts for both the percentage and numeric changes in different population age groups. It indicates that the only age group which is growing at a rate well above that of the population as a whole is the 45 to 64 age group, which includes the "baby boomers." The 18 to 24 age group is expected to grow at a rate roughly equal that of the total population, while the remaining age groups are projected to grow slower than the population as a whole.
Growth by Ethnicity. As shown in Figure 12, no single ethnic group currently holds a majority in California. The Hispanic and Asian cohorts of the state's population are projected to continue to expand and are estimated to grow 3 percent annually over the next three years. This is compared to the near-stagnant growth of both the white and black populations.
California's relatively steady population growth—including its age, ethnic, and migratory characteristics—can be expected to have many implications for the state's economy and public services in the budget year and beyond. Some examples of demographic influences are as follows:
The increasing ethnic diversity of the state's population will also mean that many public institutions, especially schools, will serve a population that speaks a multitude of languages and has a wide range of cultural backgrounds.