Analysis of the 2001-02 Budget BillLegislative Analyst's Office
|
Economic and demographic trends in 2001 and 2002 will have important effects on California's 2001-02 budget outlook. For example, the strength of California's economy is an important determinant of the level of revenues collected from personal income taxes, sales and use taxes, and corporate income taxes. Similarly, both economic and demographic variables affect state government expenditure programs, including those relating to education, health and social services, and youth and adult corrections.
In this part, we review recent economic developments for the nation and state, discuss the Governor's economic forecast, and present our own perspective on California's economic outlook. We also discuss current demographic developments and highlight our population projections through 2003.
Our "Bottom Line." Although California's long-term economic outlook remains positive, the state faces major near-term challenges associated with the current weakening in U.S. growth, a high-tech cyclical downturn, and rising costs in certain key areas in the economy.
In addition, although the state is making progress toward reaching a near-term resolution to its power crisis, the electricity market will remain under considerable pressure. This summer, for example, the adequacy of electricity supplies is uncertain and will depend on such factors as temperatures in the U.S. western region, the availability of hydroelectric power, and the success of conservation efforts.
Our forecast assumes that California's economy will slow in line with the nation's in 2001, before rebounding in 2002. However, given the challenges facing the state, the risk of a steeper slowdown than we foresee is significant, and thus must be kept in mind by state policymakers as they craft the final 2001-02 budget.
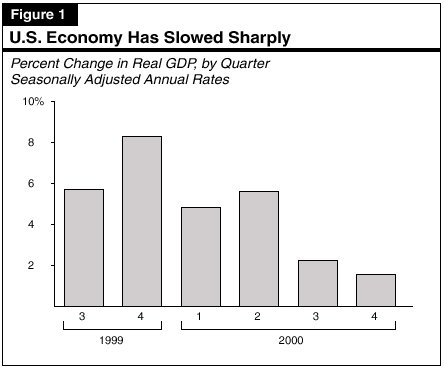
After experiencing nearly ten years of sustained economic growth, the U.S. economy decelerated sharply beginning in mid-2000. As shown in Figure 1, growth in real gross domestic product (GDP) slowed from over 5 percent in the first half of 2000 to 1.4 percent by the fourth quarter of the year.
Recent evidence of softening U.S. economic activity is pervasive and includes weak Christmas sales, falling manufacturing output, extremely sluggish employment growth, and weaker-than-expected company profits. One of the key factors in the weak fourth-quarter GDP report was a significant decline in business investment spending on computers and software. The decline was in dramatic contrast to the major increases that had been occurring throughout this expansion. The University of Michigan's survey of consumer confidence was down sharply in both December and January—the largest two-month drop for that survey since the beginning of the last recession in September 1990. The U.S. index of leading economic indicators fell by 0.4 percent in both October and November, and by another 0.6 percent in December, indicating that slow growth lies ahead.
Although most forecasters had anticipated that the U.S. economy would moderate beginning in mid-2000, the abrupt nature of the actual slowdown caught virtually all observers—including the Federal Reserve—by surprise. As recently as November, the "consensus" outlook was for continued healthy, though somewhat tapering, economic growth through 2001, and the main risk to the outlook was that growth was not easing enough to curtail inflationary pressures that had been building up in recent years.
The abrupt slowdown appears to be due to the combined effects of several factors. Chief among these are: (1) the constraining effects of prior interest rate increases by the Federal Reserve on auto sales, real estate markets, and other interest-sensitive sectors of the economy; (2) the adverse effects of the sharp drop in stock market values on household wealth and consumer spending; and (3) weakening profits, which have caused many businesses to postpone plans for business expansions. Of considerable importance to California and its high-tech industries is the fact that much of the capital spending slowdown is centered in information technology (IT), where California accounts for over 20 percent of total national output.
In response to the recent economic slowdown, the Federal Reserve took the unusual step in early January of cutting interest rates by a full 0.5 percent, and by a further 0.5 percent at the end of the month. In addition, the new administration has introduced a federal personal income tax reduction proposal, partly in an effort to stimulate U.S. economic growth.
While the interest rate cuts appear to have stabilized the U.S. equity markets, there is normally a 6-month to 12-month time lag between changes in monetary policy and corresponding changes in the economy's "real" spending and output levels. Similarly, any tax reductions are unlikely to significantly stimulate household spending until later this year—at the earliest. Thus, any positive impacts on the nation's economy of stimulative federal monetary and fiscal policies are unlikely to be seen until the second half of 2001 or later.
The national slowdown that began in mid-2000 did not materially affect California. The state's job growth, personal income tax withholding, and retail sales all remained healthy through December (see Figure 2). As a result, 2000 was the strongest year of California's current economic expansion, with total personal income and taxable sales increasing by about 11 percent, and employment up by more than 3.5 percent. Reflecting strong economy-wide job growth, the state's unemployment rate had fallen to 4.8 percent by year-end, with the rates in several Bay Area counties hovering around 1.5 percent—an all-time low.
|
Figure 2 |
| California's Current Economic Situation |
|
|
|
|
|
|
While the state largely escaped the national slowdown in 2000, it faces major challenges as the new year unfolds. In addition to its well-publicized electricity crisis, California is confronted with a sharp slowdown in national spending on computers and other IT goods, a major decline in the stock market values of many of its major technology companies, and sharply rising living costs (which are beginning to limit the amount of discretionary income available to its households).
So far, the signs of a slowdown in the state have been limited to mostly anecdotal information—such as reports of softening rental markets and postponed business expansion plans. However, the multitude of negative forces that has emerged in recent months strongly suggests that slower growth lies ahead.
The administration interprets recent national developments as signaling a U.S. economic slowdown, but not a recession. As shown in Figure 3, the budget forecasts that real GDP growth will slow from 5.1 percent in 2000 to 3 percent in 2001, before rebounding to 4.3 percent in 2002. While some slowing of consumer and business spending is projected in the first half of the year, the administration expects growth to be revived by a combination of lower interest rates, a slow reversal of recent energy price increases, and further productivity gains during the next 12 months. Slowing economic growth is expected to result in a moderation in inflation, with growth in the Consumer Price Index (CPI) slowing from 3.5 percent in 2000 to 2.5 percent in 2001.
| Figure 3 | |||
| Summary of the Budget's Economic Outlook | |||
| Forecast | |||
| 2000 | 2001 | 2002 | |
| United States Forecast | |||
| Percent change in: | |||
| Real GDP |
5.2% |
3.0% | 4.3% |
| Personal income |
6.5 |
5.5 | 5.6 |
| Wage and salary jobs |
2.1 |
0.4 | 1.2 |
| Consumer Price Index |
3.4 |
2.4 | 2.1 |
| Unemployment rate (%) |
4.1 |
4.5 | 4.7 |
| Housing starts (000) |
1,610 |
1,600 | 1,710 |
| California Forecast | |||
| Percent change in: | |||
| Personal income |
11.7% |
5.7% | 6.9% |
| Wage and salary jobs |
3.6 |
2.8 | 2.7 |
| Taxable sales |
11.3 |
4.9 | 6.4 |
| Consumer Price Index |
3.7 |
3.1 | 2.5 |
| Unemployment rate (%) |
4.9 |
4.8 | 4.7 |
| New housing permits (000) |
147 |
155 | 167 |
Regarding California, the administration projects that its economic expansion will continue but slow to a more moderate rate during the next two years. Personal income growth is forecast to slow from 11.7 percent in 2000 to 5.7 percent in 2001, before rebounding to 6.9 percent in 2002. The slowdown in 2001 includes the effects of a projected 10 percent decline in stock option income during the year. The budget anticipates that easing growth-related pressures on energy and real estate prices will result in a moderation of inflation over the next two years. The budget projects the California CPI will increase by 3.1 percent in 2001 and 2.5 percent in 2002, down from 3.7 percent in 2000.
Reflecting continued negative developments at both the national and state levels, our forecast calls for a sharper near-term slowdown in both U.S. and California economic growth in 2001 than does the administration. Our national and state economic forecasts through 2003 are summarized in Figure 4.
| Figure 4 | ||||
| Summary of the LAO's Economic Outlook | ||||
| Forecast | ||||
| 2000 | 2001 | 2002 | 2003 | |
| United States Forecast | ||||
| Percent change in: | ||||
| Real GDP |
5.0% |
2.2% | 3.9% | 4.5% |
| Personal income |
6.3 |
4.9 | 5.4 | 6.2 |
| Wage and salary jobs |
2.1 |
0.6 | 1.2 | 1.9 |
| Consumer Price Index |
3.4 |
2.6 | 2.2 | 2.4 |
| Unemployment rate (%) |
4.0 |
4.6 | 4.9 | 4.8 |
| Housing starts (000) |
1,594 |
1,560 | 1,611 | 1,660 |
| California Forecast | ||||
| Percent change in: | ||||
| Personal income |
11.3% |
5.2% | 6.3% | 6.9% |
| Wage and salary jobs |
3.7 |
2.2 | 2.4 | 2.4 |
| Taxable sales |
10.9 |
4.5 | 5.8 | 7.0 |
| Consumer Price Index |
3.7 |
3.6 | 2.6 | 2.7 |
| Unemployment rate (%) |
4.9 |
5.4 | 5.2 | 5.0 |
| New housing permits (000) |
145 |
144 | 152 | 160 |
We forecast that the slowdown in U.S. economic growth will persist through mid-year, before lower interest rates revive consumer and business spending in late 2001 and into 2002. Overall, we forecast that real GDP growth will slow from 5 percent in 2000 to about 2.2 percent in 2001, before rebounding to 3.9 percent next year.
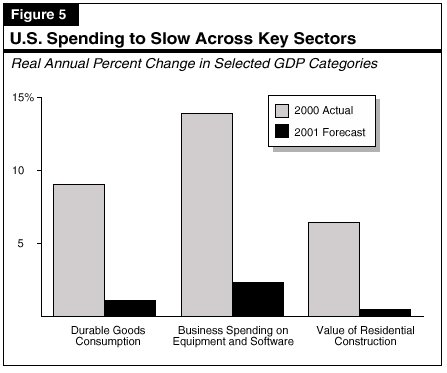
The weaker growth in 2001 reflects across-the-board slowdowns in U.S. consumer and business spending. As shown in Figure 5, substantial slowdowns are projected for consumer spending on durable goods (including computers and autos), business investment, and residential construction. Of particular significance for California is the slowdown in consumer and business spending on computer and IT-related goods and services.
We expect the recent easing in inflation indices to continue in 2001 and 2002, with consumer prices slowing from 3.4 percent in 2000 to about 2.6 percent in 2001 and 2.2 percent in 2002.
Over the longer term, a resumption of strong investment in new technologies and continued high productivity growth will continue to be driving forces behind solid growth in output and incomes in 2002 and beyond.
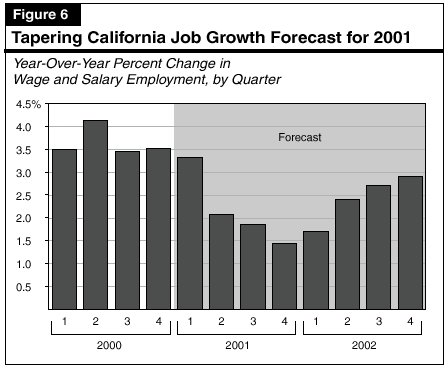
We expect California's economy to slow sharply in the first half of 2001 and remain sluggish in the second half of the year. As indicated in Figure 6, year-over-year wage and salary employment growth—which was near 4 percent in mid-2000—is projected to subside to about 1.5 percent by the fourth quarter of 2001. We also expect corresponding slowdowns in other key measures of economic activity, such as personal income and taxable sales. However, our forecast assumes that an outright recession will be avoided.
On an annual average basis, employment growth is expected to slow from 3.7 percent in 2000 to 2.2 percent in 2001, before partially rebounding to 2.4 percent in 2002. Personal income and taxable sales growth rates in 2001 are expected to be less than one-half of 2000's pace, reflecting the impacts of both slowing employment growth and reduced stock option-related income and wealth in the economy.
The most pressing challenge currently facing the state relates to its electricity crisis, especially in light of the multiplicity of ways that energy affects the economy and ultimately the state's finances (see shaded box). The combination of sharply rising electricity demands throughout the western region of the nation, lagging investment in new generation capacity, and soaring wholesale market prices has dramatically increased the costs of energy purchased by California's utilities. Under the terms of the state's energy restructuring measure enacted in 1996, two of the state's three privately owned utilities—Pacific Gas and Electric (PG&E) and Southern California Edison—have been prohibited from passing most of their higher wholesale electricity costs forward to their customers. This has required them to absorb huge operating losses and has put them close to financial insolvency.
The Electricity Crisis and the EconomyFew commodities are as basic as electricity to the underlying health and ongoing growth of California's economy. California is a relatively efficient user of energy products, and its per-capita usage of electricity has been relatively low compared to other states. Nonetheless, electricity is required by essentially every element of the state's economywhether it be its high-tech computer and information technology industries, basic manufacturing activities, banking and financial sector, agricultural industries, or the retail trade sector. Given this, developments affecting the supply and price of electricity are important to the state's economy both in the near term and longer term. The Situation to Date Economy Has Been Somewhat Shielded. Thus far, the crisis has primarily affected the state's two largest investor-owned utilities, which have incurred major financial losses from purchasing power at wholesale market prices many times what they are permitted to charge their customers under the terms of the 1996 electricity deregulation law. In contrast, the state's economy at large has been shielded from the majority of the price increases. However, it has been adversely affected by power supply disruptions associated with rotating blackouts and repeated supply curtailments (the latter being for industrial users that had signed interruptible contracts for reduced power rates). Estimates of economic losses to the economy from these price and power disruptions vary, but by some accounts exceed $1 billion. Also, in early January 2001, the California Public Utilities Commission approved temporary rate increases averaging about 10 percent, whose effects have yet to be felt. Future Problems Are Likely. The Legislature and Governor have already taken important steps to address short-term price and availability issues—including passage of Chapter 4x, Statutes of 2001 (AB 1x, Keeley), which facilitates the purchase of electricity by the state through the use of bonds (see "Part I"). The state is also currently negotiating fixed-price contracts and considering various conservation and energy supply initiatives. Even with these actions, the state faces the likelihood of higher electricity prices in the future and the possibility of further supply disruptions this summer. Potential Future Impacts Higher Electricity Prices. As an illustration of potential future price-increase effects of the crisis, consider that the total value of electricity consumed in California during 1999 was about $25 billion, with roughly one-third of that amount attributable to households and roughly two-thirds attributable to businesses, governments, and other entities. On average, spending on electricity accounted for 2 percent to 3 percent of both business production costs and average household budgets. If the wholesale electricity prices in effect during the past two months were "passed forward" so as to be reflected in utility rates, the total annual California electricity bill would be over $40 billion this year. This increase would represent a $15 billion transfer of wealth from California households, businesses, and government to electricity generators and their suppliers. A transfer of this size would have a significant impact on the amount of discretionary income available for household spending on other goods and services in the economy. It would also depress corporate profits growth, which could in turn lead to higher product prices and potentially fewer business expansions. These effects would vary from industry to industry. Given the financing mechanism put in place by AB 1x, actual near-term rate increases are likely to be considerably less than what would be necessary to cover current wholesale prices. Long-term contracts should also bring down electricity prices in the near term. Rate increases could reduce statewide economic growth over the next two yearsbut would likely not, by themselves, derail the economic expansion. Nor would we expect somewhat higher electricity prices to result in a significant exodus of California businesses to other states, partly because of the fact that rising energy prices are currently a problem throughout the western region of the nation. Electricity Supply Disruptions. In terms of their impacts on the economy, a bigger concern than electricity price increases is the prospect of chronic supply shortfalls. Surveys reveal that the disruptions that have already occurred have had significant impacts on the sales, production, and profits of the businesses affected. Uncertainty about the state's electricity reliability is already a leading concern among businesses and chronic disruptions could materially affect business location decisions and expansion plans over the next year. Thus, a significant risk to the economy from supply problems remains. |
The Situation as of Early February. On February 1, the Governor signed AB 1x (Keeley), which authorizes the state Department of Water Resources (DWR) to enter into long-term power contracts with electricity suppliers and resell the electricity to consumers in California. In addition, the measure authorizes DWR to issue revenue bonds to cover, in the near term, the difference between its electricity acquisition costs and the amount paid by ratepayers. The measure also permits the California Public Utility Commission (CPUC) to set electricity rates to cover the revenue requirements of DWR's power purchasing program, although current "baseline" rates would be protected.
As this analysis is going to press, the state was negotiating fixed-rate contracts with energy suppliers. The Governor and Legislature were also negotiating an agreement aimed at assisting California's investor-owned utilities in regaining financial stability and the Governor had implemented emergency electricity orders aimed at conserving commercial electricity use.
These are crucial steps toward the resolution of the state's immediate electrical crisis. However, given the current supply-demand characteristics of the state's energy market, this summer will be when the greatest challenges will be faced—even under the best of circumstances. Such uncertainties as the level of summertime temperatures, the reliability of certain existing generators, the success of conservation efforts, the speed with which new generation capacity is brought on-line, and the availability of hydroelectric power from northern California and the Pacific Northwest, will all have significant impacts on the availability and price of electricity in California during this period.
Outlook Assumes Crisis Will Not Derail Economy. Given recent progress by the administration and Legislature in developing solutions to the crisis, our forecast assumes that the state will make it through this summer without substantial electricity-related disruptions to the economy but that consumers and businesses will face higher prices.
In addition to its electricity-related problems, the state's near-term expansion faces challenges in three other key areas:
High-Tech Cyclical Slowdown. One of the key engines of the state's expansion has been its high-tech sector. With its high-valued products and its above-average wages, this sector has accounted for a substantial share of the state's overall growth in output and income during recent years. However, as 2001 unfolds, this sector is entering a period of consolidation (see Figure 7). Part of the slowdown it is experiencing is related to slower national investment in IT in 2001, as business spending in these areas pauses following several years of major product upgrades. Similarly, household expenditures on computers has softened in recent months, due in part to the lack of new software innovations that necessitate newer and more powerful computer systems.
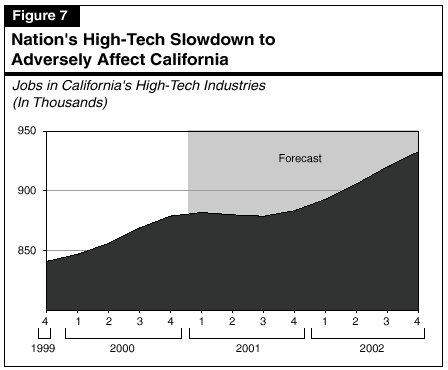
Foreign purchases of IT equipment are also expected to slow in 2001, due to weakening economic growth in Japan and some other Asian economies. The large amount of output and income directly and indirectly attributed to this sector (over 20 percent of the state's private-sector economic output) means that slower growth in the high-tech sector will have a significant adverse impact on overall growth next year. The slowdown, however, is expected to be short-lived. Business investment in computer systems and software is expected to resume its strong upward trend in 2002, leading to a corresponding rebound in job growth in California's high-tech industries.
Declines in Wealth. In a related development, the recent decline in stock market values among high-tech firms is partly reversing one of the key factors behind California's economic boom in 2000—the so-called "wealth effect." While some of the declining stock values can be viewed as simply eliminating a "bubble" in share values that occurred between late 1999 and early 2000, there is no question that the stock market slide that began last March and intensified late last year has left many investors and employees with stock options less wealthy than a year ago.
This recent decline in high-tech companies' stock values will also have a material adverse effect on California personal income growth in 2001 through its effect on stock options. As shown in Figure 8, an extraordinary increase in options-related income boosted overall wages by nearly 14 percent in 2000. However, given the recent decline in stock share prices, we expect option-related income to fall this year—holding overall wage growth to just 4.7 percent in 2001.
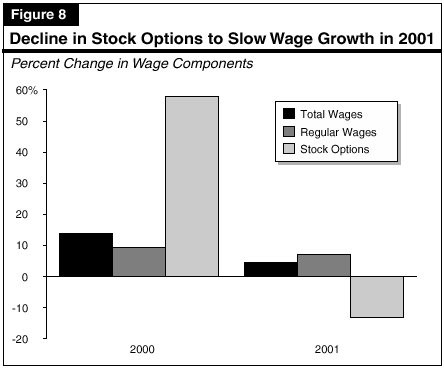
It is important to note that, even with the stock market declines, there is still a large amount of capital gains and stock option income "stored up" that is related to stocks purchased (or options granted) in previous years. Similarly, the huge amount of options-related income realized in 2000 will have residual positive effects on the economy in 2001 and beyond. On balance, however, we expect the reduced 2001 level of stock market-related wealth and income to lead to more restrained personal spending growth this year.
Price Increases. California is facing sharply higher costs in a number of key areas. As shown in Figure 9, consumer prices for motor fuels jumped over the past year by 16 percent in the Los Angeles region and 23 percent in the San Francisco region. Similarly, utility costs are up 18 percent in Los Angeles and 19 percent in San Francisco. (The increases through December are primarily due to higher natural gas prices. Electricity price increases were granted by the PUC in early January for Southern California Edison and PG&E, but these increases are not reflected in the December data.) Likewise, rents in San Francisco jumped by 8 percent, following similar gains in 1998 and 1999.
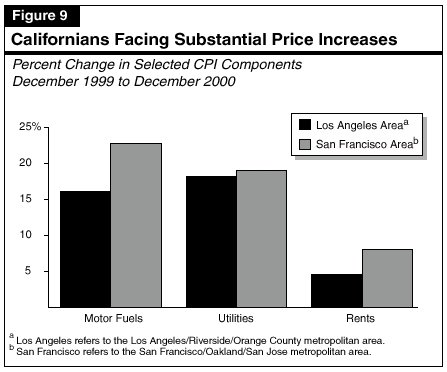
For high-income households, these various cost increases are relatively minor compared to other factors that can adversely affect their financial positions (such as reduced equity values, changing home values, and adjustments in wages and bonuses). However, the increases are more significant for lower- and moderate-income households, where higher costs are significantly cutting into discretionary incomes, leaving less funds for other spending or for saving.
On a positive note, we forecast that residential construction will remain relatively immune from the projected slowdown in overall economic activity in 2001, with total residential building permits holding steady at about 145,000 units this year. Positive factors in the construction outlook are low inventories of unsold homes and low long-term interest rates. In contrast, we expect inflation-adjusted permit valuations for nonresidential construction to fall about 5 percent in 2001, due partly to postponed plans for industrial expansions and slowing demand for retail space. The latter is related to both the projected softening in retail sales in 2001 and the recently announced closures and consolidations of national retail chain stores.
Although we have made a significant downward revision to near-term California economic growth since our previous forecast was prepared in November (see below), our longer-term forecast remains positive. As indicated earlier in Figure 4, personal income is projected to increase 6.3 percent in 2002 and 6.9 percent in 2003, reflecting widespread gains in employment and output in each of those years. Our forecast assumes that with added generation capacity in the years to come, the electricity markets will become more stable, and that the state will continue to benefit from the national trends of strong investment in high-tech products and services in subsequent years.
Figure 10 compares our forecasts for the nation and California to those we made in November 2000 (see California's Fiscal Outlook), as well as those of the University of California, Los Angeles (UCLA) (December 2000); the consensus forecast published in Blue Chip Economic Indicators (January 2001); Western Blue Chip Economic Forecast (February 2001); and the Governor's budget forecast. With the exception of UCLA, our forecasts for both the nation and California are less optimistic than the other projections shown. Our more restrained outlook stems from further evidence of slowing economic growth and the continued deterioration in consumer and business confidence at both the national and state levels.
| Figure 10 | |||
| Comparisons of Recent Economic Forecasts a | |||
| (Percent Changes) | |||
| Forecast | |||
| 2000 | 2001 | 2002 | |
| United States Real GDP: | |||
| LAO November |
5.1% |
3.2% | 4.1% |
| UCLA December |
5.1 |
1.1 | 2.2 |
| DOF January |
5.2 |
3.0 | 4.3 |
| Blue Chip "Consensu" b January |
5.1 |
2.7 | 3.4 |
| LAO February |
5.0 |
2.3 | 3.9 |
| California Wage and Salary Jobs: | |||
| LAO November |
3.7% |
3.4% | 2.9% |
| UCLA December |
3.6 |
1.9 | 1.8 |
| DOF January |
3.6 |
2.8 | 2.7 |
| Western Blue Chip "Consensus" c February |
3.5 |
2.4 | 2.4 |
| LAO February |
3.7 |
2.2 | 2.4 |
| California Personal Income: | |||
| LAO November |
11.5% |
6.6% | 6.5% |
| UCLA December |
11.3 |
6.7 | 5.4 |
| DOF January |
11.7 |
5.7 | 6.9 |
| Western Blue Chip "Consensus" February |
9.5 |
6.2 | 6.3 |
| LAO February |
11.3 |
5.2 | 6.3 |
| California Taxable Sales: | |||
| LAO November |
11.7% |
6.7% | 6.0% |
| UCLA December |
11.0 |
5.5 | 4.3 |
| DOF January |
11.3 |
4.9 | 6.4 |
| Western Blue Chip "Consensus" February |
8.5 |
5.5 | 5.6 |
| LAO February |
10.9 |
4.5 | 5.8 |
| a Acronyms used apply to Legislative Analyst's Office (LAO); University of California, Los Angeles (UCLA); and Department of Finance (DOF). | |||
| b Average forecast of about 50 national firms surveyed in January by Blue Chip Economic Indicators. | |||
| c Average forecast of organizations surveyed in February by Western Blue Chip Economic Forecasts. | |||
As discussed in "Part Three," our more restrained near-term economic outlook translates into a somewhat lower revenue forecast for 2001-02 compared to both our November report and the Governor's budget forecast.
California's demographic trends both directly and indirectly affect the state's economy, revenue collections, and expenditure levels. For example, they influence the size of the labor force, the demand for autos and homes, the volume of taxable sales, and the amount of income taxes paid. Similarly, the population and its age distribution affect school enrollments and public programs in many other areas, such as health care and social services. Given this, the state's demographic outlook is a key element in assessing and projecting the state's budgetary situation.
Figure 11 summarizes the LAO's updated demographic forecast. We estimate that California's total population will rise from an estimated 35.4 million in 2001, to 36 million in 2002 and 36.5 million in 2003. This translates into an annual growth rate of roughly 1.6 percent, which is well above the nation's current growth rate of about 1 percent annually.
| Figure 11 | |||
| Summary of the LAO's California Demographic Forecast | |||
| 2001 Through 2003 (Populations in Thousands) | |||
| 2001 | 2002 | 2003 | |
| Total population (July 1 basis) | 35,396 | 35,949 | 36,502 |
| Changes in population | |||
| Natural change (births minus deaths) | 275 | 279 | 283 |
| Net in-migration (in-flows minus out-flows) | 279 | 275 | 269 |
| Total changes | 554 | 554 | 552 |
| Percent changes | 1.59% | 1.56% | 1.54% |
| Detail may not total due to rounding. | |||
Growth Exceeds Half-a-Million People Annually. California is adding over 550,000 people each year, which is roughly equivalent to the size of the entire state of Vermont. About half of this yearly growth is attributed to net in-migration from other nations and states, while the remainder is due to "natural" increase (that is, births in excess of deaths). Foreign in-migration dominates the net in-migration component, as over 200,000 people enter California from foreign countries annually.
Revised LAO Population Estimates Adjust for 1990 Census Undercount. The population estimates presented in this forecast are somewhat larger than those in our forecast made last November. This reflects revisions we have made to our population estimates for the past decade so as to include the 838,000 person undercount that occurred in the 1990 Census. We expect that our inclusion of this undercount will make our 2000 population estimate more in-line with the adjusted 2000 Census estimates that should be released in March 2001 (see shaded box). Including this undercount has increased our estimate of California's population for each year since 1990. However, it does not result in large changes in the annual percent change in population from year to year.
In making our revised demographic projections, we did not have the opportunity to include data from the 2000 Census; however, we will incorporate this information when we revise our estimates this spring, once the adjusted Census data become available.
2000 Census Results for CaliforniaThe U.S. Census Bureau conducted its decennial census in April of 2000 and released its first unadjusted estimate of California's population in late December. This estimate—33.9 million as of April 1—is well below our 2000 estimate of the state's population—34.8 million as of July 1. The difference primarily reflects the fact that the Census number has not been adjusted upward to account for any undercount of the population. There is widespread agreement that an undercount does exist. In 1990, the Census undercount for the state was an estimated 838,000 persons, and demographers believe that an undercount of similar size occurred in 2000. A better estimate of California's true population and details about it will become available in future months when adjustments to the official Census 2000 data are released. These will be made available on a flow basis during the remainder of 2001 and in 2002. The first adjusted population numbers should be available in March 2001. Although the LAO demographic forecast presented here does not reflect any data from the 2000 Census per se, it does approximate the likely 2000 undercount by specifically incorporating the 1990 undercount and carrying it forward throughout the decade. Our demographic projections will be revised to incorporate the actual 2000 undercount figures if they do become available this spring. |
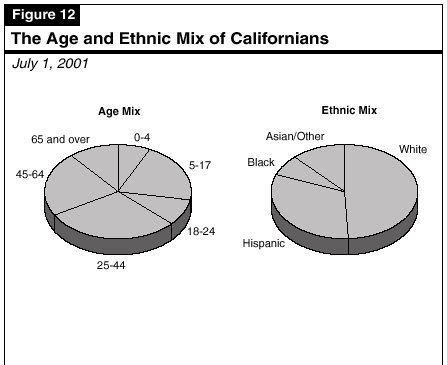
The implications of population trends for the budget depend not only on the total number of Californians, but also on their characteristics. California's population continues to be not only the largest, but also the most diverse, in the nation. For example, the state's population reflects a rich mix of different ethnicities, a large number of people from other nations and states; a broad age distribution; and considerable geographic dispersion amongst urban, suburban, and rural areas. The state's current age and ethnic mix is shown in Figure 12.
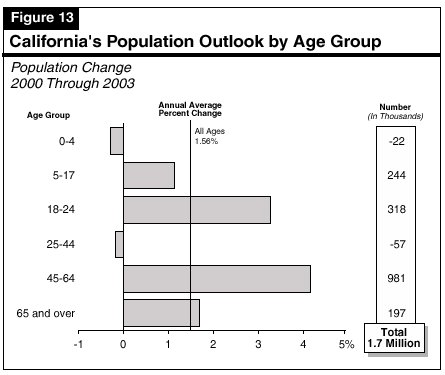
Growth by Age Group. The age-related characteristics of California's population growth are especially important from a budgetary perspective, given their implications for such program areas as education, health care, and social services. Figure 13 shows our forecasts for both the percentage and numeric changes in different population age groups. It indicates that by far the greatest growth is expected for the 45-to-64 age group (the "baby boomers"). However, large growth is also expected in the 18-to-24 age group, which will have implications for higher education. Figure 13 also shows that the under-5 age group is expected to decline over the three-year forecast period, indicating a further slowdown in K-12 enrollment growth in coming years.
Growth by Ethnicity. For the first time in history, no single ethnic group currently holds a majority in California. This trend should continue as the white share of population declines further below 50 percent, and the shares of Hispanics and other ethnic groups continue to expand. The total number of Hispanic and Asian persons in California is forecast to continue to grow about 3 percent annually over the next three years. This is compared to the near-stagnant growth expected of the white population and the 1.5 percent annual growth of the black population.
California's continued strong population growth—including its age, ethnic, and migratory characteristics—can be expected to have many implications for the state's economy and public services in the budget year and beyond. Some examples of demographic influences are as follows: