The budget includes an increase in K-12 Proposition 98 funding of over $1.9 billion in the budget year. This is $268 per pupil, or 4.4 percent, more than the revised estimate of per-pupil expenditures in the current year. The budget also proposes significant increases in spending related to K-12 that is "outside" Proposition 98.
Figure 1 (see next page) shows the budget from all significant sources for K-12 education for the budget year and the two previous years. As the figure shows, K-12 spending from all sources is projected to increase by over $2.5 billion, or 5.7 percent, above the current-year level.
Proposition 98 funding constitutes about three-fourths of overall
K-12 funding. For 2000-01, the budget proposes to increase K-12 Proposition 98 funding by over $1.9 billion above revised current-year estimated
expenditures. This represents an increase of $268 per pupil, or 4.4 percent, on an average daily attendance (ADA) basis, bringing Proposition 98 per-pupil
spending to $6,313.
The budget proposes a General Fund K-12 Proposition 98 funding increase of approximately $1.2 billion. An increase in local property taxes allocated to school districts and county offices of education of $732 million brings the total Proposition 98 increase for K-12 education to more than $1.9 billion. Figure 2 (see page 55) highlights the significant changes proposed for K-12 Proposition 98 funds in the budget year.
The major budget proposals funded under Proposition 98 include:
| Figure 1 | |||||
| K-12 Education Budget Summary | |||||
| 1998-99 Through 2000-01
(Dollars in Millions) |
|||||
|
Actual 1998-99 |
Estimated 1999-00 |
Proposed 2000-01 |
Change From
1999-00 |
||
| Amount | Percent | ||||
| K-12 Proposition 98 | |||||
| State (General Fund) | $22,190.8 | $23,782.9 | $24,996.2 | $1,213.2 | 5.1% |
| Local property tax revenue | 9,461.4 | 10,058.7 | 10,791.0 | 732.3 | 7.3 |
| Subtotals,
Proposition 98 |
($31,652.2) | ($33,841.7) | ($35,787.2) | ($1,945.5) | (5.7%) |
| Other Funds | |||||
| General Fund | |||||
| Teachers' retirement | $245.1 | $864.4 | $929.2 | $64.8 | 7.5% |
| Bond payments | 846.6 | 906.4 | 1,040.5 | 134.1 | 14.8 |
| Other programs | 53.5 | 503.0 | 584.1 | 81.1 | 16.1 |
| State lottery funds | 674.1 | 744.4 | 744.4 |
-- |
0.0 |
| Other state funds | 55.8 | 46.8 | 45.5 | (1.3) | -2.7 |
| Federal funds | 3,510.8 | 4,150.5 | 4,455.8 | 305.3 | 7.4 |
| Other local funds | 3,093.4 | 3,093.4 | 3,093.4 |
-- |
0.0 |
| Subtotals,
Other Funds |
($8,479.4) | ($10,308.9) | ($10,893.0) | ($584.0) | (5.7%) |
| Totals | $40,131.5 | $44,150.6 | $46,680.1 | $2,529.5 | 5.7% |
| K-12 Proposition 98 | |||||
| Average Daily Attendance (ADA) | 5,498,312 | 5,598,202 | 5,669,005 | 70,803 | 1.3% |
| Amount per ADA (excluding loan) | $5,757 | $6,045 | $6,313 | $268 | 4.4% |
| Figure 2 | |
| Governor's K-12 Budget Proposals
Proposition 98 |
|
| (Dollars in Millions) | |
| 1999-00 (revised) | $33,841.7 |
| Enrollment Growth | |
| Revenue limits | $319.1 |
| Categorical programs | 109.2 |
| Subtotal | ($428.3) |
| Cost-of-Living Increases | |
| Revenue limits | $667.8 |
| Categorical programs | 278.9 |
| Subtotal | ($946.7) |
| Funding Adjustments | |
| After School Learning (one-time to ongoing) | $50.0 |
| CalWORKs child care shift | 50.0 |
| Mandates | 49.2 |
| Special education prior-year correction | 36.0 |
| Deferred maintenance | 22.3 |
| Other | 28.4 |
| Subtotal | ($235.9) |
| Program Expansions | |
| Supplemental Instruction hourly rate | $61.9 |
| Professional Development Institute stipends | 48.0 |
| State Preschool | 46.8 |
| CalSAFE | 34.7 |
| Alternative Certification Program | 20.8 |
| English Language Learners | 20.0 |
| Beginning Teacher Support and Assessment | 15.4 |
| Special Ed WorkAbility I | 7.0 |
| Academic Volunteer and Mentor | 5.0 |
| Partnership Academies | 1.4 |
| Subtotal | ($261.0) |
| New Programs | |
| Education Technology | $75.0 |
| Teacher hiring incentives | 52.0 |
| Algebra Academies | 18.0 |
| National Board Certification Awards | 15.0 |
| Teacher recruitment centers | 9.4 |
| Advance Placement grants | 8.0 |
| Subtotal | ($177.4) |
| Offsetting Adjustments | -$103.8 |
| 2000-01 (proposed) | $35,787.2 |
| Change from 1999-00 (revised) | |
| Amount | $1,945.5 |
| Percent | 5.7% |
Figure 3 shows Proposition 98 spending for major K-12 programs. "Revenue limit" funding (available for school districts and county offices to spend on general purposes) accounts for $23.8 billion in 2000-01, or about two-thirds of Proposition 98 expenditures. The state General Fund supports about 56 percent of revenue limit funding, and local property taxes provide the remaining 44 percent.
The largest "categorical" program (an expenditure earmarked for a specified purpose) is special education. The budget proposes to increase special education funding by $160 million, or 7 percent. Class size reduction in K-3 and ninth grade is the second largest categorical spending program in 2000-01 at $1.7 billion. A modest increase of $31 million (1.8 percent) is due to the COLA and a slight downward revision in estimated K-3 enrollment.
Current-Year Spending. The budget makes new proposals totaling $139 million for one-time expenditures for the current year. These expenditures are made possible, in part, by recently identified savings from prior Proposition 98 appropriations ($121 million). The budget draws upon one-time General Fund monies for the remaining $18 million of proposed expenditures. Figure 4 (see page E-58) summarizes the sources of the above funds and their proposed new uses.
Reappropriations. The budget also proposes reappropriating unspent balances from current-year Proposition 98 appropriations to use for one-time purposes in the budget year (under Item 6110-485). Figure 5 (see page E-59) summarizes these proposed savings and expenditures.
The 2000-01 Governor's Budget proposes significant new expenditures that are directed at K-12 education problems, although the funding does not go to local education agencies and is therefore "outside" of Proposition 98. These include--but are not limited to--$118 million for scholarship awards for high school students who score high on standardized tests, $71 million for expansion of teacher training programs administered by the University of California, $50 million for a Teachers Home-buyers Assistance Program, and $50 million for the Air Resources Board to replace polluting school buses. We discuss the first three of these programs under Education Crosscutting Issues and we discuss the last program under our analysis of the Air Resources Board (Item 3900).
| Figure 3 | ||||
| Major K-12 Education Programs Funded by Proposition 98 | ||||
| (Dollars in Millions) | ||||
| Estimated 1999-00 | Proposed 2000-01 | Change from 1999-00 | ||
| Amount | Percent | |||
| Revenue Limits | ||||
| General Fund | $12,959.8 | $13,267.3 | $307.6 | 2.4% |
| Local revenue | 9,800.8 | 10,504.2 | 703.4 | 7.2 |
| Subtotals, revenue limits | ($22,760.6) | ($23,771.5) | ($1,011.0) | (4.4%) |
| Existing Programs | ||||
| Special education | $2,256.7 | $2,416.9 | $160.2 | 7.1% |
| Class size reduction | 1,694.9 | 1,726.1 | 31.2 | 1.8 |
| Child development | 854.8 | 1,046.0 | 191.3 | 22.4 |
| Desegregation | 643.0 | 677.6 | 34.6 | 5.4 |
| Instructional materials | 566.6 | 572.8 | 6.3 | 1.1 |
| Adult education | 542.4 | 571.8 | 29.4 | 5.4 |
| Home to school transportation | 459.9 | 478.9 | 19.0 | 4.1 |
| Economic Impact Aid | 394.1 | 425.6 | 31.5 | 8.0 |
| School improvement | 385.9 | 399.4 | 13.5 | 3.5 |
| Summer school | 309.8 | 378.7 | 69.0 | 22.3 |
| ROC/P | 320.4 | 336.3 | 15.9 | 5.0 |
| Staff development day buy-out | 225.1 | 242.5 | 17.4 | 7.7 |
| Categorical supplemental grants | 212.2 | 221.6 | 9.4 | 4.4 |
| Other | 2,056.1 | 2,201.9 | 145.8 | 7.1 |
| Subtotals | ($10,921.8) | ($11,696.2) | ($774.4) | (7.1%) |
| New/Revised Programs | ||||
| CalSAFE | $48.4 | $83.1 | $34.7 | 71.8% |
| Education technology | 100.0 | 75.0 | -25.0 | -33.3 |
| Teacher stipends (UC institutes) | 11.0 | 59.0 | 48.0 | 436.4 |
| Teacher hiring incentives | -- | 52.0 | 52.0 | |
| Algebra Academies | -- | 18.0 | 18.0 | -- |
| National Board Certification | -- | 15.0 | 15.0 | -- |
| Teacher recruitment centers | -- | 9.4 | 9.4 | -- |
| Advance Placement Grants | -- | 8.0 | 8.0 | -- |
| Subtotals | ($159.4) | ($319.5) | ($160.1) | (100.4%) |
| Totals | $33,841.7 | $35,787.2 | $1,945.5 | 5.7% |
| Figure 4 | |
| K-12 Education Governor's Budget Proposals for Current-Year Revenue | |
| 1999-00
(In Millions) |
|
| Proposed Augmentations | |
| Education technology | $100.0 |
| Child Care Facilities Revolving Fund | 25.0 |
| County Office of Education apportionment growth estimate | 8.2 |
| State agency employee compensation increase | 4.4 |
| Deferred maintenance (loan repayment) | 1.1 |
| Total | $138.8 |
| Sources | |
| Proposition 98 Savings | |
| Offset available from property tax | $69.3 |
| CalWORKs child care veto | 50.0 |
| Military loan repayment | 1.7 |
| Peer review adjustment | 0.1 |
| Subtotal | ($121.1) |
| General Fund reserve | $17.7 |
| Total | $138.8 |
| Figure 5 | |
| K-12 Education Governor's Budget Proposed Uses for One-Time Savings | |
| 2000-01
(In Millions) |
|
| Proposed Expenditures (Item 6110-485) | |
| Digital high school | $88.0 |
| Special education ADAa (1999-00) | 16.8 |
| Summer school deficiency (1997-98) | 4.5 |
| Voluntary desegregation | 8.0 |
| FCMATb professional management assistance | 1.0 |
| Child nutrition deficiency (1998-99) | 0.8 |
| Student friendly services | 0.3 |
| Unspent residual | 4.9 |
| Total | $124.3 |
| Sources (Proposition 98 Savings) | |
| Staff development day buy-out | $43.2 |
| After School Program | 27.0 |
| CCCc property tax savings | 17.7 |
| Mandates | 15.2 |
| CCC--Lease-purchase savings | 11.6 |
| Reversion balance | 8.6 |
| Pupil assessment | 1.0 |
| Total | $124.3 |
| a Average daily attendance. | |
| b Fiscal Crisis and Management Assistance Team. | |
| c California Community Colleges. | |
While the Governor's budget does not directly address the matter of California's per-pupil spending and the national average, there has been growing legislative interest in the topic. In this section, we discuss why measurements of per-pupil spending vary, estimate current per-pupil spending levels, and offer some considerations on the issue of spending to the national average.
How does California compare to the nation in per-pupil spending in K-12 public schools? While it is generally accepted that California spends less than the national average, estimates of this "gap" vary widely--from less than $300 to over $1,200 per pupil--depending on the source and depending on how the gap is defined. Multiplied by the state's enrollment of over six million public school pupils, these different estimates yield cost estimates for closing the gap that range from less than $2 billion to over $7 billion annually.
The great variation in reported measurements of the gap is largely attributable to the following five factors.
Choice of Index. The U.S. Department of Education's National Center for Education Statistics (NCES) and the National Education Association (NEA) produce the two national indices of K-12 expenditures that are most widely used by researchers and policy makers. Both organizations publish extensive data on public school student populations and funding, including data on revenues and expenditures per pupil. For both organizations, the most often cited measure of per-pupil funding is "current" expenditures (operating expenditures) per pupil. Recent NEA and NCES data on current expenditures per enrollment are shown in Figures 1 and 2. Due to differing methodologies, the two indices produce somewhat different measurements of California and national expenditures per K-12 enrollment. For example, NCES includes state administrative expenditures for K-12 education while NEA does not. Despite these differences, the two indices tend to track together.
| Figure 1 | ||||
| National Education Association (NEA)
Current Expenditures Per Fall K-12 Enrollment a |
||||
| 1992-93 Through 1997-98 | ||||
| U.S. | California | Gap | Rank | |
| 1992-93 | $5,149 | $4,570 | $579 | 33 |
| 1993-94 | 5,319 | 4,675 | 644 | 34 |
| 1994-95 | 5,526 | 4,740 | 786 | 36 |
| 1995-96 | 5,695 | 4,876 | 819 | 36 |
| 1996-97b | 5,943 | 5,191 | 752 | -- |
| 1997-98 | 6,174 | 5,580 | 594 | 31 |
| a From NEA, Rankings of the States, various years. | ||||
| b The NEA did not publish rankings for 1996-97. Data provided by NEA. | ||||
| Figure 2 | ||||
| U.S. Department of Education
National Center for Education Statistics (NCES) Current Expenditures Per K-12 Fall Enrollment a |
||||
| 1992-93 Through 1996-97 | ||||
| U.S. | California | Gap | Rank | |
| 1992-93 | $5,170 | $4,614 | $556 | 33 |
| 1993-94 | 5,325 | 4,718 | 607 | 32 |
| 1994-95 | 5,528 | 4,799 | 729 | 35 |
| 1995-96 | 5,689 | 4,937 | 752 | 35 |
| 1996-97 | 5,923 | 5,260 | 663 | 35 |
| a From NCES, Statistics in Brief: Revenues and Expenditures for Public Elementary and Secondary Education, various years. | ||||
Which Expenditures Are Counted. One reason measurements of per-pupil spending vary is the "basket" of expenditures counted. Expenditures can be categorized based on whether they are funded from state, local, and/or federal revenues; and clearly per-pupil estimates will vary widely depending on the extent to which these sources are included or excluded. In California, we often pay special attention to per-pupil funding provided under Proposition 98. For 2000-01, the Governor proposes Proposition 98 funding of $6,313 per average daily attendance (ADA). A more comprehensive measure of per-pupil spending is total funding from all sources. For the budget year, the Governor proposes total funding from all sources of about $8,200 per ADA.
Expenditures can be categorized by narrowly defined purposes--such as spending on teacher salaries, instructional materials, administration, or facilities. A broader distinction is that made between spending on capital outlay and operating expenditures. The most often referenced expenditure category in the NEA and NCES indices is that of "current expenditures," which consists of operating expenditures, or those expenditures made in the day-to-day operation of schools.
Average Daily Attendance Versus Enrollment. Enrollment measures the number of pupils registered to attend school while ADA measures the number of pupils attending school each day averaged over the course of the school year. Essentially, the difference between the two measures is due to absences. Inevitably, enrollment totals are larger than the corresponding ADA totals. Therefore, any given expenditure total measured on a per-enrollment basis will always yield a lower dollar figure than if measured on a per-ADA basis.
In the context of national comparisons, however, another matter arises. Until 1998-99, California was unique among the states in including excused absences in its ADA counts. As a result, for data collected prior to 1998-99, California ADA totals are not comparable to ADA totals in other states unless an adjustment is made to exclude excused absences. For example, NEA reports that California's operating expenditures per fall enrollment in 1997-98 were $5,580, ranking us 31st in the nation. However, for the same year, NEA reports that California expenditures, measured by ADA, were $5,627, ranking us 40th in the nation. The difference between the 31st and 40th rankings essentially is a distortion due to different definitions of ADA.
Chapter 855, Statutes of 1997 (SB 727, Rosenthal), eliminated excused absences from ADA, thereby aligning California's definition of ADA with the definition used by the other states. As a result, data from 1998-99 and beyond should no longer have this incongruity with national data. (We note that care should be taken to ensure data from 1998-99 and beyond does indeed reflect California's revised ADA definition. The NEA's recently reported preliminary ADA figure for 1998-99 still includes excused absences because it is a projection based on data from prior years.)
Time Lags. An often misunderstood point relating to comparisons of state and national per-pupil spending is that the latest reliable data always lag two to three years behind the present. This is due to the difficulties in collecting data from thousands of local educational agencies across the country and assuring that data is reported on a consistent basis. For example, the most recent actual data available in the most recent NCES index is from 1996-97. The most recent actual data from NEA is from 1997-98. Thus, any attempt to estimate the current gap requires projecting per-pupil growth rates in California and national spending for the intervening years. Therefore, in considering estimates of the gap, it is important to be specific about the year to which the data applies, as well as assumptions used in making projections.
Accuracy of Data and Estimates. Sometimes, inaccurate data or estimates create discrepancies in measurements of the gap. For example, NEA's preliminary report for 1998-99 shows California's expenditures per enrollment declining by $280, from $5,580 in 1997-98 to $5,300 in 1998-99. Based on budget actions, however, we know that spending actually increased by over $250 per enrollment in this period. As a consequence, NEA's estimate for 1998-99 overstates the gap by over $500 per enrollment--translating to an overstatement of the total cost of closing the gap of about $3 billion.
Estimating the current difference between California and national expenditures per pupil requires projecting measurements of the gap forward from the most recent available data--1996-97 for NCES and 1997-98 for NEA. This, in turn, requires making assumptions about growth rates in per-pupil spending for the intervening years. This is relatively straightforward for California data since we know how state school spending has grown during the time. There is, however, no way to know how spending has changed in all other states.
In order to give the Legislature a sense of where California educational spending stands relative to the nation's at this time, we assumed the following:
Using the methodology described above, we estimate the current gap to be between $370 and $500 per enrollment as measured by the NCES index and between $450 and $550 per enrollment as measured by the NEA index. Multiplied by the state's enrollment, the estimated total cost of closing the gap today would be between $2.2 billion and $3.3 billion above the Governor's K-12 budget proposal for 2000-01.
In evaluating California's position relative to the nation's, the Legislature should consider the following points:
Above, we raise some important cautions about setting national average spending as a policy goal. However, the Legislature may conclude that such a target would serve as a proxy for addressing basic K-12 program needs. If the Legislature were to decide that reaching the national average on K-12 per-pupil spending is a desired objective, it could not realistically get there all at once. As such, a multiyear phase-in would be necessary to achieve this objective.
Possible Phase-In Schedules. To illustrate how the Legislature might move state spending to the national average, we identify below the cost of two different phase-in schedules. Calculating these cost estimates requires projecting "baseline" rates of growth for per-pupil spending in California and the nation. Under our baseline assumptions, California K-12 per-pupil spending grows at a faster rate than the nation. In other words, if the state makes no special effort to reach the national average and instead spends amounts consistent with the minimum funding levels required under Proposition 98, we assume that the gap between California and national per-pupil spending would narrow over the next several years. The question then becomes: How much additional spending would be required to fully close the gap?
We estimate that the following levels of additional annual spending would be required to close the gap (above the Governor's proposed K-12 spending level and future growth in the Proposition 98 guarantee):
We illustrate, in Figure 3, these two possible phase-in schedules of additional state spending to reach the national average by 2002-03 and by 2004-05. In both cases, we have used the midpoints of our ranges of estimated costs. In these examples, each year's increment of spending is a bit higher than the prior year, reflecting the compounding effects on the Proposition 98 minimum guarantee caused by each year's "over-appropriation." The Legislature could, of course, construct different phase-in "paths" than the ones displayed here.
| Figure 3 | ||||
| Possible Phase-In Schedules On Reaching National Spending Average | ||||
| (In Millions) | ||||
| Three-Year Phase-In | Five-Year Phase-In | |||
| 2000-01
a |
$800 | 2000-01
a |
$420 | |
| 2001-02 | 840 | 2001-02 | 440 | |
| 2002-03 | 860 | 2002-03 | 460 | |
| 2003-04 | 480 | |||
| 2004-05 | 500 | |||
| Total | $2,500 | Total | $2,300 | |
| a Represents appropriations above those proposed in the Governor's budget. | ||||
A significant feature of the proposed budget is its failure to provide any additional general purpose funds for local school districts and county offices above increases required by law. The budget's only increases in discretionary funds are the statutorily required cost-of-living adjustments (COLAs) ($668 million) and enrollment growth adjustments ($319 million) to revenue limit funding. These funds, totaling $987 million, represent about half of the $1.9 billion in new Proposition 98 funding for K-12 education proposed in the Governor's budget.
This budget continues a long-term trend in reduced local discretion over K-12 education spending. Figure 1 (see next page) depicts this decline in local discretion by showing revenue limit (general purpose) funding as a percent of total K-12 Proposition 98 funding.
In our view, this decline in local discretion over spending runs counter to the increased emphasis the state has placed on accountability in K-12 education in recent years. If the state is going to hold local school districts accountable for improving student performance, it is essential that these same districts be given the resources and local budgetary discretion to allocate resources based on local needs. Without these resources and flexibility, districts are severely constrained in their ability to make necessary changes and improvements in programs and operations. (For a more detailed discussion of the need for local flexibility within a school accountability system, see A K-12 Master Plan, Legislative Analyst's Office, May 1999).
In our cross cutting discussion on COLAs in K-12 and higher education, we identified $134.3 million that we recommend shifting from the four-year universities to K-12 education. Below, we propose two methods for providing that $134.3 million to K-12 schools as additional discretionary spending. Both recommendations use revenue limits as the mechanism for disbursing the new resources.
| Figure 1 | |||
| K-12 Proposition 98 Discretionary Spending Share | |||
| 1988-89 Through 2000-01
(Dollars in Billions) |
|||
| Year | K-12
Proposition 98 |
Revenue
Limits |
Percent
Discretionary |
| 1988-89 | $17.2 | $13.3 | 77.5% |
| 1989-90 | 18.7 | 14.4 | 77.0 |
| 1990-91 | 18.6 | 15.5 | 83.4 |
| 1991-92 | 21.0 | 15.8 | 75.3 |
| 1992-93 | 21.5 | 15.7 | 73.2 |
| 1993-94 | 21.2 | 15.9 | 75.0 |
| 1994-95 | 22.6 | 16.7 | 73.9 |
| 1995-96 | 24.8 | 18.0 | 72.7 |
| 1996-97 | 26.8 | 19.6 | 73.1 |
| 1997-98 | 29.2 | 20.6 | 70.7 |
| 1998-99 | 31.7 | 21.8 | 69.0 |
| 1999-00 | 33.8 | 23.0 | 68.0 |
| 2000-01 | 35.8 | 24.1 | 67.2 |
Revenue limits provide general purpose support for school districts and county offices of education. Revenue limits were established in Chapter 1406, Statutes of 1972 (SB 90, Dills), as part of the state's response to the Serrano v. Priest state Supreme Court decision of 1971. The revenue limit was calculated to be equal to the per-student amount of general purpose student aid and local property taxes that a district received in 1972-73. The limits do not include state categorical funds (such as state aid for special education or class size reduction), lottery revenue, or any federal aid to local districts. Currently, approximately two-thirds of state support to K-12 school districts is provided through the revenue limit mechanism. Each year, as required by statute, revenue limit funding is adjusted for changes in enrollment and COLA.
During the recession years of the early 1990s, the statutory COLA was not fully funded. Instead of adjusting base revenue limits to reflect these lower COLAs, a second set of revenue limits were created--so called "deficited" revenue limits. Deficited revenue limits reflect the amount that the state actually provides to school districts and county offices of education. The state keeps track of the difference between base revenue limits and deficited revenue limits--referred to as the revenue limit deficit factor. The deficit factor reduces base revenue limits for school districts and county offices of education by a percentage that is approved as part of the annual budget process. The size of the deficit has decreased over the last few years because the Legislature has approved "deficit reduction" funding as part of recent annual budget acts. Since 1994-95, the state has reduced the deficit factor from 11 percent to 6.996 percent for school districts and from 11 percent to 8.628 percent for county offices of education.
The Legislature has, since the first Supreme Court Serrano decision in 1971, periodically enacted legislation to equalize revenue limits among the state's school districts. Chapter 894, Statutes of 1977 (AB 65, L. Greene), established a school finance funding mechanism that provided school districts with different COLA amounts depending upon their per-pupil revenue limits. In general, a district with a revenue limit above the statewide average would receive a smaller COLA than a district with a revenue limit below the statewide average. Under this system, per-pupil funding levels would be drawn to the statewide average (squeezed) over time. Thus, funding disparities stemming from differences in district wealth gradually would be reduced.
Current revenue limit COLA and equalization policy is based on Chapter 498, Statutes of 1983 (SB 813, Hart). Senate Bill 813 eliminated the "squeeze" formula, and instead provides that all districts of the same type (elementary, high school, and unified) receive the same fixed dollar amount as a COLA. In 1995-96, for example, all elementary school districts received a COLA of $82 per ADA, high school districts received $100 per ADA, and unified districts received $86 per ADA. This approach does nothing to reduce the dollar differentials among districts and only slightly reduces the percentage differentials.
Since the enactment of SB 813, the Legislature has provided periodic "leveling-up" funds for revenue limit equalization. That is, funds are provided periodically to increase the revenue limits of below-average districts to the state average. In calculating equalization adjustments, districts are divided into six categories by type (elementary, high school, and unified) and ADA (small and large). The amount of equalization aid a district qualifies for depends on the amount necessary to bring its revenue limit to the average revenue limit in its category.
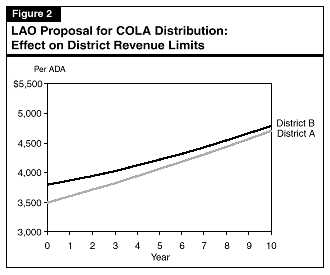
Sliding-Scale COLA Would Better Equalize Revenue Limits. We recommended in the 1997-98 Analysis that the Legislature replace the existing uniform COLA with a sliding-scale COLA, and Chapter 156, Statutes of 1998 (AB 2460, Leach and Runner), states the Legislature's intent to do this. Under the sliding-scale approach, the COLA varies based on the relationship of district's revenue limits to the statewide average. For example, a sliding scale can be constructed under which the farther above the average, the smaller the COLA. In this example, the savings from granting smaller COLAs to above-average districts are used to supplement the COLAs of below-average districts. The approach is similar to the AB 65 COLA, which was in effect from 1977 to 1983. As Figure 2 shows, the sliding-scale approach results in the dollar difference between the two hypothetical districts decreasing over time.
This type of adjustment can be constructed to guarantee a COLA to every school district. The important point, however, is that no matter what parameters are chosen, a sliding-scale COLA eventually does reach a point at which revenue limits are equal.
We recommend that the Legislature provide $134.3 million, identified in our crosscutting discussion on education base budget adjustments, as additional revenue limit funding for school districts and county offices of education. These funds would provide additional general purpose funding for K-12 schools. Of this amount, we recommend that $65 million be provided for equalization and the remainder--$69.3 million--be provided for deficit factor buy-out. We further recommend that the Legislature adopt legislation to replace the current uniform revenue limit COLA with a new formula that equalizes revenue limits over time. We recommend making this change in 2001-02 rather than in the budget year to allow districts time to adjust to the change.
In our crosscutting discussion of base budget adjustments for the K-12 and higher education segments, we note that the base adjustments proposed for the four-year universities are far in excess of the amount needed to offset the effects of inflation. In that section, we recommend that $134.3 million budgeted for the universities be reallocated to K-12 education where program performance is a matter of greater concern.
We recommend that these funds be provided as general purpose funding to K-12 schools in approximately equal parts for equalization and deficit reduction. Our proposal would provide $65 million in revenue limit equalization funds to school districts and county offices of education based on a sliding-scale formula. This amount would be in addition to the statutory 2.84 percent COLA that all districts and county offices will receive for the budget year. This level of augmented funding, if followed by similar augmentations in the subsequent five fiscal years, would result in 90 percent of the state's ADA receiving the same revenue limit (within each of the six district types).
Our proposal would also provide $69.3 million in deficit reduction. This amount would lower the deficit factors from 6.996 percent to approximately 6.7 percent for school districts and from 8.628 percent to approximately 8.4 percent for county offices. These new resources also would provide more general purpose funding for local priorities.
The Governor's budget provides a total of $433 million to increase the use of technology in education. Of that amount, $233 million in state and federal funds are to continue ongoing education technology programs, as displayed in Figure 1. Generally these programs make schools and districts work toward integrating technology into the classroom by requiring (1) planning prior to implementation, (2) staff development integrated into the curriculum, and (3) ongoing technical support.
Regarding new proposals, the Governor's budget provides
(1) $175 million in one-time grants to buy computers and support on-line advanced placement (AP) courses and (2) $25 million in one-time funds to
provide technology staff development.
The budget provides $175 million in one-time Proposition 98 funds for grants to districts to (1) support start-up costs of providing advanced placement (AP) courses on-line at high schools that currently have no AP courses, and (2) increase the number of computers in the classroom. The Governor's budget does not specify how much of the $175 million would be for the AP technology support grants, nor how much would be used to assist schools in purchasing computers. Under the administration's proposal, the grants would be administered by the Secretary for Education. The budget indicates that the Governor will seek approval of the program and $100 million as a current-year appropriation through legislation separate from the budget bill. The budget proposes the remaining $75 million from ongoing Proposition 98 funding, even though it is for one-time spending.
Below, we offer an alternative plan for the expenditure of these one-time monies that we believe will: (1) match budget-year spending needs with demand, (2) encourage more efficient purchases and use of technology, and (3) best leverage nonstate funds available for education technology. In addition, we recommend the Legislature redesignate the $75 million of one-time funds as applying towards the 1999-00 Proposition 98 guarantee. This redesignation would provide the Legislature with greater flexibility in the budget year and beyond for its general fiscal priorities.
| Figure 1 | ||
| Existing Education Technology Programs | ||
| Digital High School--$164 Million | ||
|
||
|
||
|
||
| California Technology Assistance Project--$12.4 Million | ||
|
||
|
||
| Federal Literacy Challenge Grants--$45.2 Million | ||
|
||
| Statewide Education Technology Services--$8.8 Million | ||
|
||
| Education Technology Staff Development, Grades 4-8--$2.1 Million | ||
|
||
|
||
|
||
| Total--$233 Million | ||
We recommend that the Office of the Secretary for Education (OSE) report to the fiscal committees prior to budget hearings on the amount needed to support on-line advanced placement (AP) courses. For legislative planning purposes, we recommend that the Legislature provisionally allocate $10 million for technology grants for AP courses until the OSE provides a detailed estimate. We further recommend that the Legislature designate the State Department of Education to administer the Advanced Placement Technology Support Grant Program, instead of OSE.
As detailed in the Crosscutting Issues section of this chapter, the Governor is trying to address potential inequities in access to higher education created by unequal student access to high school AP courses. The budget provides $7 million to the University of California to develop and offer AP courses on-line.
Our analysis indicates that 73 high schools offer no AP courses. These high schools may need some additional infrastructure funding to be able to facilitate AP distance learning. However, since 99 percent of high school enrollment either has or will participate in the Digital High School (DHS) program by the budget year, most of the infrastructure needs for providing distance learning already will have been met. At the time of this analysis, the Office of the Secretary for Education (OSE) had no estimate of the outstanding need.
We recommend that OSE report to the fiscal committees, prior to budget hearings, on the estimated infrastructure costs to support on-line AP courses that will not have been met by the DHS program. In determining the appropriate amount to provide in assistance, the Legislature should also consider that most of the infrastructure projects needed to offer AP courses on-line would be eligible for federal E-rate subsidies (we discuss E-rate further below). E-rate subsidies range from 20 percent to 90 percent of the infrastructure costs. In addition, some ongoing costs of offering AP courses on-line could be subsidized by California Teleconnect Grants (see gray box for details). We recommend the Legislature structure the AP grant program to encourage schools to apply for E-rate subsidies and California Teleconnect Grants, which could further reduce the cost of providing AP on-line courses. For the Legislature's planning purposes, we recommend that the Legislature provisionally allocate $10 million for the AP program until the secretary reports to the Legislature on the demand for the program.
The State Department of Education (SDE) Should Administer AP Grant Program. The Governor proposes that OSE administer the Advanced Placement Grant Program. The Secretary for Education serves primarily as a policy advisor to the Governor. His office is not designed to administer grant programs. The SDE already administers almost all the state's K-12 education programs, including several involving education technology. The SDE is better positioned to administer this grant program. Accordingly, we recommend deleting $180,000 and two positions for administering both the AP course technology grants and one-time computer grants from the OSE budget (reduce Item 0650-011-0001 by $180,000). Because SDE will have an increase in workload associated with the AP course technology grants, we recommend the Legislature provide SDE one personnel-year and related state operations funding (increase Item 6110-001-0001 by $70,000).
What
Is California Teleconnect?
|
We recommend the Legislature redirect $165 million from education technology grants to better ways of meeting these needs.
The Governor's budget provides the remainder of the $175 million not used for AP technology support grants for his second priority, namely providing computers to schools with the lowest computer-to-student ratios. (Although this is the stated goal, the proposal does not specify precisely the criteria for eligibility in the program.)
We have several concerns with the proposal. First, the program would effectively reward those schools and districts that have decided not to invest their own funds in technology. Furthermore, the Governor's proposal requires schools to develop a technology plan, but does not require a plan in advance of funding. In addition, the proposal does not require a local match, so districts would not be committed by virtue of their own investment to ensuring that the purchased technology would be used effectively and maintained over time.
This commitment is essential to ensure that schools and districts have incentives to fully integrate technology into the classroom. To quote from the conclusions of recent research at the University of California, Berkeley, titled Managing Technology Efficiently in California K-12 Schools,
"California is determined to integrate technology into schools; however, simply placing computers in schools will not improve student achievement or learning. Implementing a technology program, one that incorporates technology into the curriculum, creates problems for schools because owning technology is expensive. The cost of technology is not simply the purchasing price; it consists of a variety of costs that accumulate over the technology's `life'."
The research uncovers three fundamental problems K-12 schools owning technology face: (1) lack of technical expertise, (2) lack of sustained funding, and (3) lack of incentive to manage technology efficiently. Since the Governor's proposal provides funds to those schools with the least experience with technology, the schools are not likely to address the long-term issues raised by the study. Without the appropriate long-term investment, many recipients would not use the funding provided in the Governor's budget in the most efficient way.
For all these reasons, we recommend deleting $165 million of one-time Proposition 98 funds provided for education technology grants. We recognize the Legislature's interest in supporting the use of technology in the classroom and, therefore, recommend two ways of using the one-time funds to help schools improve their use of technology: (1) a technology revolving loan fund and (2) E-rate start-up grants. These two programs are described below and summarized in Figure 2.
| Figure 2 | |
| LAO Recommended Use of One-Time Technology Funds | |
| (In Millions) | |
| Amount | |
| Governor's Proposal | |
| Advance placement (AP); technology support grants; computer grants | $175 |
| LAO Recommendations | |
| AP technology support grants | $10 |
| Technology Revolving Loan Fund | 160 |
| E-rate start-up grants | 5 |
| Total | $175 |
We recommend that the Legislature (1) establish an Education Technology Revolving Loan Fund to support school districts' technology implementation plans and (2) provide $160 million in one-time monies to finance the fund.
We recommend the Legislature establish an Education Technology Revolving Loan Fund and make $160 million available to schools and districts with a five-year repayment period. Schools could use the funds to purchase computers, equipment, wiring, or other infrastructure needs. The loans would (1) encourage and support those schools and districts which are ready to implement their comprehensive technology plans, while not wasting funds on those schools which are not prepared to fully use technology in the classroom; (2) allow schools to spread the cost of investing in technology over several years; and (3) help schools leverage funding from other sources. To encourage districts to use these funds, we recommend providing two fiscal incentives: (1) make the loans interest-free, and (2) forgive 20 percent of the loan principal over the life of the loan.
As discussed above, simply providing computers to a school often is not an efficient use of state resources. Technology has to be implemented in a comprehensive way. Some schools are ready to implement comprehensive technology plans while others are not. By establishing a Revolving Technology Loan Fund, the Legislature could provide assistance to those schools which are prepared and willing to invest their own funds to implement their plans. In contrast, the Governor's proposal would provide free computers with no local match. Under the Governor's proposal, any eligible school could apply whether they could efficiently use technology in the classroom or not. Under our recommendation, districts would have to repay 80 percent of what they borrow from the revolving fund, so districts would have a strong incentive to ensure that the funds are not wasted. Districts also would have to determine whether investing in technology and its ongoing maintenance and staff development costs was a higher priority for the district than the numerous competing priorities. The Governor's budget would provide one-time grants to a small number of schools, while most would not receive funding. In contrast, over time our proposal would allow more schools access to funds. If fully utilized, the Revolving Loan Program could provide loans in excess of $480 million over the first ten years. The real value of the principal balance of the fund would depreciate over time because of inflation and the loan forgiveness incentive, but we estimate the fund would still have at least $80 million in principal in 2010.
Schools could also use these funds to leverage (1) federal funds through E-rate (discussed below) or Literacy Challenge Grants, (2) California Teleconnect funds, or (3) other public and private grant funds.
We recommend that the Legislature create a task force headed by the Secretary for Education to develop a state plan to increase the number of schools receiving E-rate subsidies. We further recommend that the Legislature provide $5 million to school districts for planning grants to develop E-rate subsidy proposals.
E-rate is a multibillion dollar federal subsidy program that helps schools and libraries improve their technology and telecommunications. (See gray box for details.) California's public and private schools and libraries received subsidies of $252 million in the current year, making this California's largest education technology program. However, California so far has received a disproportionately low share of these federal funds (see Figure 3). We believe that with a better state effort, the state could help its local education agencies (LEAs)--charter schools, school districts, and county offices--secure more funds. The estimated funding available nationally for the budget year is $2.25 billion. The average grant size has been around $65,000.
| The Federal E-Rate Program
What Is E-Rate?
How Does it Work?
|
| Figure 3 | ||||
| E-Rate Funding: How California Has Fared | ||||
| (Dollars in Millions) | ||||
| Year | Federal Funds Allocated | California Funding | California Percent of National Funding | California Percent of National Title I Students |
| 1998-99 | $1,660 | $206 | 12.4% | 13.5% |
| 1999-00 | 2,250 | 252 | 11.2 | 13.5 |
| 2000-01 | 2,250 a | N/A | N/A | 13.5 |
| a Expected funding level. | ||||
Many LEAs do not have (1) the technical capacity to develop plans or (2) experience with evaluating bids and contracts in this area. Given the amount of funding available through E-rate, the state has a strong incentive to assist districts in maximizing their E-rate subsidies. The Legislature can take several actions to help California LEAs receive the maximum amount of federal E-rate discounts.
Provide Statewide Leadership. School and library telecommunications cut across several state and local government entities. The Secretary for Education could play a key leadership role in coordinating with the Department of General Services, SDE, the state's federal liaisons, and county offices of education to streamline and assist schools with the application process; and to increase awareness of the E-rate program. We recommend that the Legislature create a task force headed by the Secretary for Education to develop a state plan to increase the number of schools receiving E-rate subsidies.
Provide Planning Grants. The planning process to participate in
E-rate starts almost a year in advance. Schools and districts need assistance in (1) understanding how the program works, (2) developing the planning
documents and their technology plan, and (3) making sure that all deadlines are met. We recommend that the Legislature appropriate $5 million in
one-time Proposition 98 funds (redirected from the Governor's education technology proposal) to provide planning grants to school districts to develop
districtwide E-rate proposals and coordinate E-rate proposals at their schools. We recommend providing differential planning grants to small and large
districts, respectively. School districts could use the funding to contract for assistance with:
Preference for the planning grants should be given to districts that have never received an E-rate subsidy. Once a district has successfully made it through an E-rate application round, the next year's application process would be much easier. By making this one-time investment in helping schools and districts apply for E-rate subsidies, the state's schools will benefit in future years as these LEAs continue to access E-rate funds.
We recommend that the Legislature redirect $25 million (one-time non-Proposition 98 funds) directly to school districts as part of a larger staff development grant (described earlier in this chapter).
The budget provides $25 million in one-time non-Proposition 98 funds to the Secretary for Education to contract with the California State University (CSU) to offer staff development to teachers in the use of technology in the classroom. Similar to the Governor's other staff development proposals, this proposal takes a"top down" approach to teacher training.
By combining these technology staff development funds with other professional development funds, districts and schools can provide teachers with staff development training that integrates technology training into their professional development for reading, math, or other subject areas. We therefore recommend that the Legislature redirect the $25 million for the CSU contract directly to school districts as part of a larger staff development block grant described earlier in this chapter. Under our recommendation, districts would be free to contract with CSU for training or seek other providers who might be better suited to meet local needs.