![]()
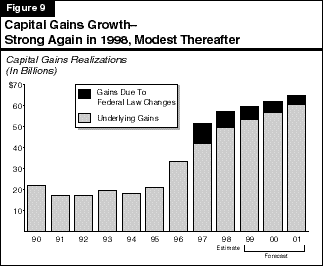
The rapid gain in PIT liabilities reflects healthy growth in taxes attributable to all of the major income sources shown in Figure 6. For example, taxes attributable to wages jumped by an average of 10 percent per year between 1994 and 1998, partly reflecting increases in bonuses and stock options, both of which accrue to taxpayers in high marginal tax brackets. Business and dividend income also increased sharply over the past four years, further adding to tax liability growth. The main reason for the extraordinary growth in PIT liabilities, however, has been an unprecedented increase in capital gains (see Figure 9).

Capital gains are related to the sales of stocks and other assets which have increased in value. This increased value is subject to PIT when the assets are sold. Capital gains are especially important in the revenue picture because they can be volatile from year to year. This is because they are related to the performance of stocks and other financial assets, which themselves are quite volatile. Moreover, the level of gains in a given year can also be significantly affected by taxpayer decisions regarding the timing of asset sales. Finally, capital gains accrue disproportionately to high-income taxpayers, and thus are generally subject to marginal tax rates which are much higher than for other forms of income.
It is also important to note that while capital gains comprise a part of income reported on tax returns, they are not included in national and state personal income accounts, since they are not related to the current production of goods or services. This accounts for a significant part of the discrepancy between statewide personal income growth and tax liability growth in recent years.
Recent Performance. Capital gains realizations totaled less than $20 billion annually during the first half of the 1990s. However, they have soared in the second half of the decade. As shown in Figure 9, capital gains more than doubled between 1995 and 1997--reaching $51 billion--and we estimate that they increased by another 11 percent in 1998, to $58 billion. Most of the growth has been related to the major increases in the U.S. stock market. However, we also believe that the reduction in the maximum federal tax rate on capital gains also played a role, especially in 1997, by leading certain investors to "cash out" their gains.
As an indication of how significant the recent rise in capital gains has been, we estimate that each $10 billion change in capital gains realizations translates into about $900 million in PIT liabilities. Using this "rule-of-thumb," the jump in gains between 1995 and 1998 has translated into a well-over $3 billion increase in state PIT liabilities.
The level of gains in 1999 and 2000 will likely play a major role in the revenue outlook for 1999-00 and the following year. However, given that the estimate of such gains is dependent on the future direction of the stock market, as well as assumptions about future taxpayer behavior, any estimate of the future strength of such gains is subject to considerable risk. Our outlook assumes that, after a healthy increase in 1998, capital gains will increase by about 4 percent in each of the next two years. Our estimates assume that stock market valuations will increase at much more subdued rates than in the recent past. We also assume that the federal tax rate reductions will have somewhat smaller incremental effects in 1999 and 2000 than they did in the past two years.
The slower expected growth in capital gains, coupled with smaller anticipated increases in other forms of earnings such as stock options and business
income, will lead to more restrained increases in overall PIT
liabilities during 1999 and 2000. We specifically project that PIT liabilities will grow in the range of 6 percent during the next two years.
Personal Income Tax Revenue Forecast. Taking into account both the effects of healthy underlying liability growth in 1998 and the tax relief packages enacted in 1997 and 1998, we forecast that PIT collections will increase from $27.9 billion in 1997-98 to $29.3 billion in 1998-99, a growth rate of 4.9 percent. We further forecast the PIT revenues will reach $30.9 billion in 1999-00 (a 5.6 percent increase) and $32.9 billion in 2000-01 (a 6.2 percent increase), roughly in line with the growth in liabilities we project for the next three years.
The sales and use tax is the General Fund's second largest revenue source, accounting for about one-third of the revenue total. There actually are two taxes involved--a "sales" tax and a "use" tax.
The sales tax is imposed primarily on the retail sales of tangible goods purchased in California. Taxable sales encompass a wide range of expenditures by individuals and businesses. They include, for example, retail spending on clothing, furniture, appliances, automobiles, and motor vehicle fuel. They also include purchases of building materials that go into the construction of residential and nonresidential structures, as well as purchases by businesses of computers and other capital equipment. Food and services are generally exempt from the sales tax, as are goods purchased for resale.
The use tax is imposed on products bought from out-of-state firms by California residents for use in the state. Such purchases are difficult to monitor, and the state is prohibited by the federal government from requiring out-of-state mail-order firms to collect the use tax for California. As a result, only a small percentage of total sales and use tax revenues is from this source.
Although the sales tax is the General Fund's second largest revenue source, it is the largest single revenue source in California when both state and local
taxes are taken into account. As indicated in Figure 10, the total tax rate levied on products is actually the combination of several individual rates imposed
by the state and various local governments. These can be divided into three categories:
| Figure 10 | |
| Sales and Use Tax Rates in California | |
| Current Rate | |
| State | |
| General Fund | 5.00% |
| 1991 program realignment (Local Revenue Fund) | 0.50 |
| Local Public Safety Funda | 0.50 |
| Total | (6.00%) |
| Local | |
| Uniform local taxesb | 1.25% |
| Optional local taxes | 1.50c |
| Total | (2.75%) |
| Statewide Maximum Rate | 8.75% |
| a These revenues are not shown in the Governor's budget totals. | |
| b Levied in all counties. | |
| c Maximum allowable rate, except maximum rate is 1.75 percent in San Francisco City and County, 2 percent in San Mateo County, and 1 percent in San Diego County. | |
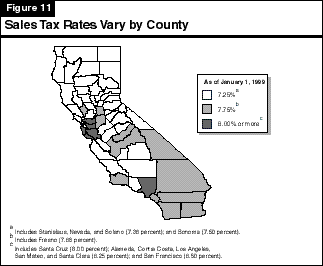
Combined State and Local Tax Rates. The combined state and local sales and use tax rate varies significantly across California. As shown in Figure 11, the combined rate currently ranges from 7.25 percent for counties that impose no optional sales taxes, up to 8.5 percent in the City and County of San Francisco. No county currently imposes the maximum allowable 8.75 percent rate.

The main element in the outlook for sales tax receipts is the strength in California taxable sales. Figure 12 compares the annual percentage change in
taxable sales to the annual percentage change in California personal income. It shows that during the 1980s and early 1990s, sales were quite volatile,
booming during the early stages of the 1980s' expansion, but
falling sharply during the early 1990s' recessionary period. In the more recent recovery, however, taxable sales growth has been relatively stable--and less
robust than in the past.
This slower growth is partly a reflection of the moderate nature of California's economic expansion in the 1990s, especially in its early stages. However, the somewhat restrained increase can also be attributed to two other factors:

We expect that taxable sales will continue to expand at a moderate pace during the next three years. Specifically, after increasing by 5.8 percent in 1998, we project that taxable sales will grow by 5.5 percent in 1999, 5.4 percent in 2000, and 5.2 percent in 2001. As indicated in Figure 12, we expect sales to increase at about the same pace as personal income through the forecast period. Our projections assume that inflation-adjusted spending on autos and other durable goods will subside from their recent rates of increases. However, sales of building materials will continue their strong growth, consistent with our projected increases in residential construction activity during the forecast period.
Based on our projections for moderate taxable sales growth, we forecast that sales tax receipts will grow from $17.6 billion in 1997-98 to $18.6 billion in 1998-99, $19.6 billion in 1999-00, and $20.7 billion in 2000-01.
Banks and corporations are subject to a general tax rate of 8.84 percent on their California taxable profits. Corporations that qualify for California Subchapter "S" status are subject to a 1.5 percent corporate rate. The income of these companies also is "passed through" for tax purposes to their shareholders, where it is subject to the California PIT. Banks and other financial corporations pay an additional 2 percent tax, which is in lieu of all other state and local levies except taxes on real property, motor vehicle-related levies, and business licenses.
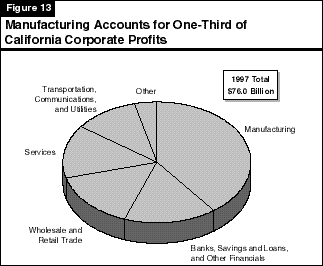
Figure 13 shows the distribution of corporate profits by industry during 1997. It shows companies in the manufacturing sector accounted for about one-third of total statewide profits during the year. Within manufacturing, a large share of earnings is attributable to companies in the computer and electronics industries. Other industries with significant shares of overall earnings are finance, services, trade, and transportation/public utilities.

Following the early 1990s' recession, California taxable corporate profits jumped by about 20 percent in both 1994 and 1995. However, earnings growth subsided in the subsequent three years--even as California's broader economic expansion was accelerating. The profit slowdown in 1996 was partly due to consolidations and restructurings in the utilities, telecommunications, and banking industries. The continued slowdown in 1997 (the most recent year for which industry earnings data are available) also reflected declining earnings in the state's computer and electronics manufacturing industries.
Corporate tax prepayments in 1998 suggest that earnings growth remained modest last year, increasing by an estimated 4.5 percent from 1997. A key factor depressing profit growth in 1998 was likely the impact of Asia's economic problems on the sales and earnings of California's high-tech manufacturing companies.
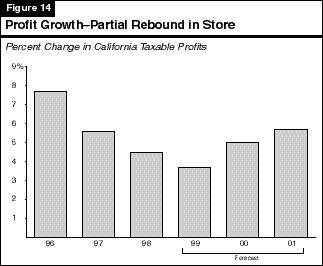
Our outlook calls for continued modest profits growth in 1999 and a mild acceleration thereafter, as shown in Figure 14 (see next page). We specifically forecast that profits will increase by 4 percent in 1999, 5 percent in 2000, and 5.4 percent in 2001. Underlying this aggregate forecast is the assumption that most sectors will experience moderate profit growth over the next three years, but that earnings in 1999 will be held down by continued softness in the high-tech manufacturing sector.

Forecast of Receipts. We forecast that corporate tax receipts will rise just 0.7 percent in the current year, to $5.9 billion. This modest gain reflects our forecast of modest profits growth, as well as three other specific factors: (1) a large amount of corporate tax refunds processed in November and December of last year, (2) the continued phase-in of the 5 percent corporate tax rate reduction enacted in 1996, and (3) revenue reductions related to the targeted tax cuts enacted last year.
We forecast that BCT receipts will increase to $6.2 billion in 1999-00 and to $6.5 billion in 2000-01. These increases are consistent with the profit gains we forecast for 1999 through 2001.
The remaining 7 percent of General Fund revenues consists of the insurance, estate, tobacco, and alcoholic beverage taxes, along with a variety of smaller taxes, fees, interest earnings, and transfers from special funds.
We forecast that revenues from all these other sources combined will be $3.2 billion in the current year, an 11 percent decline from 1997-98. The decline reflects a reallocation of trial court revenues from the General Fund to a special trust fund (pursuant to financial court restructuring legislation passed in 1997), and a transfer of $117 million from the General Fund to various special funds in response to a court decision last year.
Other Revenues Include Funds From Tobacco Settlement and One-Time Asset Sales. We forecast that combined revenues from these other sources will jump to $4.1 billion in 1999-00 before falling back to $3.8 billion in 2000-01. The major increase in 1999-00 reflects the assumed receipt of (1) $562 million in tobacco settlement monies and (2) about $180 million in one-time receipts related to the sale of state lands.
The decline between 1999-00 and 2000-01 reflects our assumption that the state will receive tobacco settlement payments in 2000-01 of $442 million--down $120 million from the budget year. Our forecast for 2000-01 also does not assume any revenues related to one-time asset sales.
Excluding the effects of the tobacco settlement, proposed asset sales, and transfers, the underlying trend for the nonmajor General Fund revenue sources is basically flat between 1998-99 and 2000-01. We forecast that insurance and estate taxes will increase modestly during the forecast period. However, these gains will be offset by declines in cigarette and alcoholic beverage taxes, as well as for interest earnings on pooled money investments. In particular, we expect that revenues from the 10-cent-per-pack levy on cigarettes will fall significantly, due to the effects of both the tobacco settlement and Proposition 10 on the quantity of cigarettes sold in this state.
Special funds revenues support a wide variety of state and local government programs. As shown in Figure 15 (see next page), nearly one-half of special funds revenues are related to motor vehicle-related taxes and fees. These include motor vehicle license fees (which are distributed to local governments for general purposes), and fuel taxes and registration fees (which support transportation-related projects). Other major special funds revenues include sales taxes and tobacco-related taxes.
| Figure 15 | ||||
| Special Funds Revenues and Transfers | ||||
| 1997-98 Through 1999-00
(Dollars in Millions) | ||||
| Revenue Source | Actual 1997-98 | Estimated 1998-99 | 1999-00 | |
| Forecast Amount | Percent Change | |||
| Motor Vehicle Revenues | ||||
| License fees (in lieu)a | $3,841 | $3,549 | $3,256 | -8.3% |
| Fuel taxes | 2,854 | 2,951 | 3,015 | 2.2 |
| Registration, weight, and miscellaneous fees | 1,741 | 1,794 | 1,824 | 1.7 |
| Subtotals | ($8,436) | ($8,294) | ($8,095) | (-2.4%) |
| Other Sources | ||||
| Sales and use taxb | $3,758 | $3,915 | $4,118 | 5.2% |
| Cigarette and tobacco taxesc | 483 | 802 | 1,091 | 36.0 |
| Interest on investments | 185 | 176 | 171 | -2.8 |
| Other revenues | 3,424 | 3,681 | 3,712 | 0.8 |
| Transfers and loans | -49 | 123 | -57 | -- |
| Totals | $16,237 | $16,991 | $17,130 | 0.8% |
| a Includes impact of Vehicle License Fee rate reduction. | ||||
| b Includes Local Public Safety Fund revenues. These amounts are not included in the Governor's budget totals. | ||||
| c Includes impact of Proposition 10, which was approved by voters in November 1998. | ||||
Special funds revenues are projected to grow from $16.2 billion in 1997-98 to $17 billion in 1998-99, and $17.1 billion in 1999-00. The current-year and budget-year revenue totals are affected by two special factors. The first is the VLF measure, which lowers special funds revenues (and increase General Fund costs) by about $557 million in the current year and $1,080 million in 1999-00. The second factor is the voter's approval of Proposition 10 on the November 1998 ballot. This measure provides for a 50-cent-per-pack increase in cigarette taxes (and an equivalent increase in taxes on other tobacco products) beginning in January 1999. The new tobacco tax proceeds are earmarked for childhood development programs. The measure will result in increased special funds revenues of $360 million in 1998-99 and about $690 million in 1999-00, with declining amounts thereafter due to declining consumption.
Special funds revenues from other sources are projected to increase at slow-to-moderate rates. Motor vehicle fuel taxes are projected to increase 2.2 percent in 1999-00, reflecting modest gains in fuel consumption. Registration, weight, and miscellaneous fees are projected to rise 1.7 percent in the budget year, reflecting slow growth in overall vehicle registrations, and zero growth in new vehicle registrations in the state. Special funds sales tax receipts are expected to increase at slightly more than 5 percent next year, the same as for General Fund receipts from this source.