Over the three–year period from 2009–10 to 2011–12, the Department of Developmental Services' (DDS) General Fund spending has remained relatively flat. (This is in contrast to earlier in the decade when spending grew rapidly.) This has been the case in spite of rapidly growing caseloads and other cost pressures. For example, during this time Regional Centers (RCs)—by far the largest DDS program—saw an average annual caseload growth rate of 3.4 percent. In this brief, we discuss the measures adopted by the Legislature over these three years to reduce General Fund costs in both Developmental Centers (DCs) and RCs.
In 2009–10, the Legislature reduced the DDS General Fund budget by drawing down more federal funds, reducing RC and DC operations, and by changing the standards as to how RCs authorize services for consumers. The Legislature also imposed provider payment rate reductions on RC providers in order to achieve savings. While the provider payment reduction was implemented initially for one year, it has been renewed by the Legislature for each of the subsequent years. In 2010–11, additional reductions to the DDS General Fund budget were made, including obtaining additional federal funds and using First Five Commission funds in lieu of General Fund. During 2011–12, the DDS General Fund budget was automatically reduced by $100 million due to the operation of a budget trigger mechanism that came into play when the state's revenues came in under budget projections. Also in 2011–12, the Legislature adopted RC best practices and accountability measures, creating additional savings. During this three–year period, the Legislature adopted mostly ongoing savings, making long–term changes to DDS programs.
Developmental disabilities include, but are not limited to, cerebral palsy, autism, mental retardation, and disabling conditions closely related to mental retardation. The Lanterman Developmental Disabilities Services Act of 1969 forms the basis of the state's commitment to provide developmentally disabled individuals with a variety of services, which are overseen by DDS. Unlike most other public social services or medical services programs, services are generally provided to the developmentally disabled without any requirements that recipients demonstrate that they or their families do not have the financial means to pay for the services themselves.
Lanterman Act Establishes State's Responsibility to the Developmentally Disabled. The Lanterman Act establishes the state's responsibility for ensuring that persons with developmental disabilities, regardless of age, have access to services that sufficiently meet their needs and goals in the least restrictive setting. More than 99 percent receive services under the Community Services Program and live with their parents or other relatives, in their own houses or apartments, or in group homes designed to meet their needs. These community–based services are coordinated through nonprofit organizations called RCs, which provide diagnosis, assessment of eligibility, and help consumers coordinate and access the services they need. Less than 1 percent live in state–operated, 24–hour facilities, known as DCs, which we describe in more detail later in this analysis.
Due in large part to the deterioration of the state's fiscal condition over the last several years, the Legislature has taken a series of actions to control costs in DDS programs. Below, we provide an overview of DDS programs and describe recent funding and caseload trends.
Four DCs and One Leased Facility. The DDS operates four DCs (Fairview in Orange County, Lanterman in Los Angeles County, Porterville in Tulare County, and Sonoma in Sonoma County) and one smaller leased facility (Canyon Springs in Riverside County) which provide 24–hour care and supervision to approximately 1,760 residents in 2011–12. All of the facilities provide residential and day programs, as well as health care and assistance with activities of daily living, education, and employment. The DCs face many physical structure challenges, as many buildings are over 50 years old and in need of capital outlay improvements. For example, for 2012–13 the department is requesting approximately $25 million for a kitchen upgrade for Porterville DC.
Secure Treatment Program. The DC consumers admitted through the criminal justice system receive competency training and behavioral supports and interventions as needed so that they can be successfully moved into the community. The Porterville DC operates the secure treatment program to provide services to consumers who have: (1) mild to moderate mental retardation, (2) have come into contact with the criminal justice system, (3) have been determined to be a danger to themselves or others and/or incompetent to stand trial, and (4) have been determined by the court to meet the criteria requiring treatment in a secure setting.
Two Main Components of DC Costs. There are two main drivers of DC costs: personnel and operating expenses and equipment (OE&E). Figure 1 shows the 2011–12 costs for each operating DC based on the 2011–12 enacted budget. The figure includes costs listed under a "6th center," which reflects unallocated funds that may be dispersed to the DCs when they need additional funding. This allows DDS to make its final allocation of funds to the DCs later in the fiscal year when there is a more accurate estimate of what each DC's costs will be. For 2011–12, Sonoma DC has the highest estimated caseload and annual facility cost. The Porterville DC has the second highest estimated annual facility cost, in part because of the secure treatment area.
Figure 1
Developmental Center Costsa
2011–12 (Dollars in Millions, All Funds)
|
|
Caseload
|
Number of
Personnel Years
|
Personnel
Cost
|
OE&E
Cost
|
Total
Cost
|
|
Lanterman
|
271
|
1,051
|
$86.2
|
$9.5
|
$95.7
|
|
Porterville
|
499
|
1,481
|
118.6
|
24.4
|
143.0
|
|
Sonoma
|
555
|
1,630
|
139.3
|
18.0
|
157.3
|
|
Fairview
|
377
|
1,263
|
101.4
|
13.5
|
114.9
|
|
Canyon Springs
|
50
|
122
|
9.6
|
3.9
|
13.5
|
|
6th Center
|
—
|
25
|
8.5
|
44.2
|
52.7
|
|
Totals
|
1,752
|
5,572
|
$463.6
|
$113.5
|
$577.1
|
DC Caseload Has Been Declining in Recent Years. The population within DCs has been on a steady decline in recent years. This is mainly the result of RCs working to find placements for consumers in the community. This is consistent with federal and state policy to provide services to disabled persons in the least restrictive environments. Figure 2 shows that the DC population is projected to decrease from 2,317 total consumers in 2008–09 to 1,533 in 2012–13, or at an average annual decline of about 10 percent.
DC Closures. As Figure 2 reflects, Sierra Vista was closed in 2009. The next planned closure is at Lanterman DC, which has seen a steady decline of its population since 2010. The Governor's budget assumes almost 100 consumers will leave Lanterman DC and move into community placements or to other DCs in 2012–13. However, the administration has declined to give a target date for the closure of Lanterman DC due mainly to uncertainties about how long it will take to develop the resources necessary to ensure a safe and successful transition of Lanterman DC consumers to appropriate living arrangements.
Figure 2
Developmental Center Caseload Trends
|
Developmental Center
|
Caseload
|
Average Annual
Decrease
2008–09 to 2012–13
|
|
2008–09
|
2009–10
|
2010–11
|
2011–12a
|
2012–13a
|
|
Lanterman
|
439
|
377
|
340
|
271
|
174
|
–20.7%
|
|
Porterville
|
616
|
604
|
557
|
499
|
451
|
–7.5
|
|
Sonoma
|
664
|
651
|
613
|
555
|
513
|
–6.2
|
|
Fairview
|
505
|
487
|
413
|
377
|
344
|
–9.2
|
|
Canyon Springs
|
53
|
54
|
56
|
50
|
51
|
–1.0
|
|
Sierra Vista
|
40
|
39
|
—
|
—
|
—
|
—
|
|
Totals
|
2,317
|
2,212
|
1,979
|
1,752
|
1,533
|
–9.8%
|
Cost Per DC Resident. Figure 3 shows the average cost per DC resident for 2010–11. Staff–to–patient ratios, OE&E, and medical services provided are all factors that drive costs for the DCs. Lanterman DC shows the highest average cost per consumer for 2010–11. As DDS moves consumers into the community, there are fewer consumers to spread over the fixed costs of maintaining the centers, thereby increasing the average cost per consumer.
Figure 3
Average Cost Per Consumer
2010–11
|
Developmental Center
|
Cost
|
|
Lanterman
|
$362,544
|
|
Porterville
|
305,492
|
|
Sonoma
|
280,496
|
|
Fairview
|
355,424
|
|
Canyon Springs
|
292,125
|
|
Average
|
$317,593
|
The state provides community–based services to consumers through 21 nonprofit corporations known as RCs, which are located throughout the state. The RCs are responsible for eligibility determinations and client assessment, the development of an individual program plan (IPP) for each consumer, and case management. The RC budget is comprised of two main expenditure areas: RC operations and purchase of services.
RC Operations. The RCs contract with DDS to provide or coordinate services for consumers. The RC operations include:
- Eligibility Determinations. The RCs provide diagnosis services and determine an individual's eligibility for RC services. There is no charge for the diagnosis and eligibility assessment.
- Case Management. Once eligibility is determined, a case manager or service coordinator is assigned to each consumer to help develop an IPP for the services that will be provided to the consumer. Some of the services coordinated by the case managers include counseling, family support, assistance in finding and using community resources, and the purchase of necessary services included in the IPP.
- Payments to Service Providers and Vendors. The RCs select appropriate vendors to provide services to consumers. The providers submit bills to the RCs for the services, and in turn, the RCs reimburse them.
Purchase of Services. The RCs generally only pay for services if an individual does not have private insurance or they cannot refer an individual to so–called "generic" services that are provided at the local level by counties, cities, school districts, or other agencies. (We discuss generic services further below.) As the payer of last resort, RCs purchase services from vendors for about 250,000 consumers in the current year. These services include day programs, transportation, residential care provided by community care facilities, and support services that assist individuals to live in the community. The RCs purchase more than 100 different services on behalf of consumers. These services are grouped into ten main categories, as shown in Figure 4. The figure also shows the Governor's proposed spending plan in these categories in 2011–12 and 2012–13.
Figure 4
Regional Centers' Purchase of Services Spending by Service Category
(Dollars in Millions)
|
Service Category
|
2011–12
|
2012–13
|
Year–to–Year Change
|
|
Amount
|
Percent
|
|
Day programs
|
$761
|
$811
|
$50
|
7%
|
|
Community care facilities
|
833
|
901
|
68
|
8
|
|
Support services
|
695
|
752
|
57
|
8
|
|
Miscellaneousa
|
406
|
446
|
40
|
10
|
|
Transportation
|
201
|
213
|
12
|
6
|
|
In–home respite
|
205
|
228
|
23
|
11
|
|
Habilitation services program
|
134
|
133
|
–1
|
–1
|
|
Health care
|
80
|
86
|
6
|
8
|
|
Out–of–home respite
|
51
|
53
|
2
|
4
|
|
Medical facilities
|
29
|
31
|
2
|
7
|
|
Totals
|
$3,395
|
$3,654
|
$259
|
8%
|
Generic Services. Under state law, generic services are defined as those being provided by federal, state, and local agencies which have a legal responsibility to serve all members of the general public and that receive public funds for providing such services. There are more than a dozen different generic services that are regularly accessed by RC consumers. For example, medical services for an RC consumer might be provided through the Medi–Cal health care program for low–income persons, the aged, and disabled. City or county park and recreation programs also provide generic services that are available to all, including developmentally disabled persons.
Caseload Trends. Between 2002–03 and 2012–13, the RC caseload is projected to grow from about 190,000 to almost 258,000, an annual average growth rate of 3.4 percent. The caseload trend is shown in Figure 5.
Figure 5
Regional Center Caseload Growth Trends
|
Average Annual Population
|
|
Increase From Prior Year
|
|
Fiscal Year
|
Caseload
|
Amount
|
Percent
|
|
2003–04
|
190,030
|
|
7,855
|
4.3%
|
|
2004–05
|
197,355
|
|
7,325
|
3.9
|
|
2005–06
|
203,823
|
|
6,468
|
3.3
|
|
2006–07
|
212,225
|
|
8,402
|
4.1
|
|
2007–08
|
221,069
|
|
8,844
|
4.2
|
|
2008–09
|
229,675
|
|
8,606
|
3.9
|
|
2009–10
|
236,858
|
|
7,183
|
3.1
|
|
2010–11
|
244,108
|
|
7,250
|
3.0
|
|
2011–12
|
249,827
|
|
5,719
|
2.0
|
|
2012–13
|
256,059
|
|
6,232
|
2.0
|
|
Averages
|
|
|
7,388
|
3.4%
|
Several key factors appear to be contributing to ongoing growth in the RC caseload. Medical professionals are identifying persons with a developmental disability at an earlier age and referring more persons to DDS programs. Improved medical care and technology has increased life expectancies for individuals with developmental disabilities who receive services from DDS programs. The RC caseload growth also reflects a significant increase in the diagnosed cases of autism, the causes of which are not fully understood. The growth rate has slowed somewhat in recent years, with the administration estimating increases of around 2 percent in 2011–12 and 2012–13. Significant cost–control measures adopted by the Legislature may have had an impact on the number of individuals accessing RC services in recent years. We describe these cost control measures in the next part of this analysis.
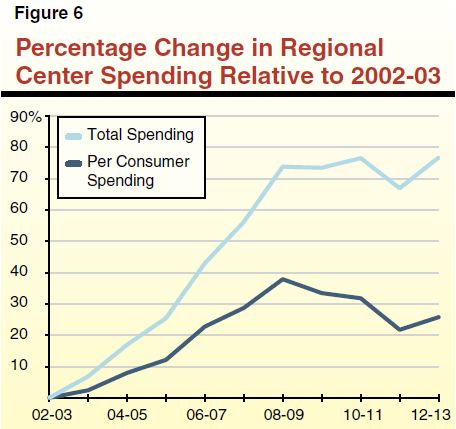
Overall Spending and Cost Per RC Consumer. Figure 6 shows total RC spending over the past decade has grown by 76 percent since 2002–03. However, due to caseload growth, total per person spending over the same period increased by 26 percent.
In this section, we provide a three–year look back at actions the Governor proposed and measures adopted by the Legislature to achieve savings in DDS. These measures were driven by the deteriorating state fiscal condition. The state was also able to achieve savings in recent years from an enhanced Federal Medical Assistance Percentage (FMAP). Under the American Recovery and Reinvestment Act (ARRA), California benefited from temporary changes to the FMAP, which adjusted the federal share for most Medi–Cal services from 50 percent to 62 percent. This additional federal funding was phased out in 2010–11, so in 2011–12 the state had to backfill approximately $190 million worth of AARA funding. This placed pressure on the department to identify other savings in order to meet budgetary goals. The department was able to offset some of this loss of ARRA funds by identifying additional federal funds in other areas. In each of the three years described below, the stated savings are relative to the "workload budget"—that is, the baseline budget adjusted to account for changes in caseload, workload, costs, and utilization.
In January of 2009, the Governor proposed to reduce support for the workload budget of DDS programs by $334 million from the General Fund in 2009–10. In February of 2009, the Legislature enacted a $100 million General Fund reduction (as part of its enactment of the 2009–10 Budget Act) and adopted trailer bill language to require DDS to submit a plan to the Legislature to achieve the reduction. The trailer bill required DDS to meet with stakeholders (to include consumers, family members, providers, and advocates), and consider their input as part of the plan development process. In May of 2009, the Governor proposed to reduce General Fund support for DDS by an additional $224 million. In July of 2009, the Legislature revised the February budget act to include the additional $224 million in General Fund savings, bringing the overall General Fund reduction to DDS to $334 million in 2009–10. In enacting the budget, the Legislature adopted further savings.
These General Fund reductions were achieved in the following ways:
- Reduction to RC and DC Spending ($334 Million). A $334 million mostly ongoing reduction to the DDS budget was accomplished through: (1) proposals to draw down additional federal financial participation, (2) changes to the scope and level of RC services, (3) changes in standards for how RCs authorize services for consumers, (4) reductions to RC operations, and (5) reductions to the DC budget. When full–year savings were achieved in 2010–11, an additional $61 million in savings was realized.
- Continuation of 3 Percent Provider Payment Reduction ($60 Million). The Legislature approved the continuation of a 3 percent provider payment reduction until the end of 2009–10 to achieve savings of $60 million.
- Governor's Veto ($50 Million). The Governor vetoed $50 million for the RCs to purchase services for children up to age five. The First Five Commission, established under Proposition 10, in effect provided a backfill to this veto. (The First Five Commission receives revenues from taxes on tobacco products that were established through passage of Proposition 10.)
In January of 2010, the Governor proposed to achieve $286 million in General Fund savings to the workload budget through the following three proposals: (1) $25 million from additional program reforms to be identified through a workgroup process, (2) $61 million from continuation of the 3 percent RC provider payment reduction, and (3) $200 million from using First Five Commission funds in lieu of General Fund.
In May of 2010, the Governor withdrew the proposal to use $200 million in First Five Commission funds in lieu of General Fund because the voter initiative that would have authorized the use of the First Five Commission funds was not approved to be placed on a June 2010 ballot. However, in May the Governor put forward two new proposals. One was to increase the provider payment reduction by an additional 1.25 percent (creating an additional $25 million in savings) and the other was to draw down additional federal funds by modifying how Intermediate Care Facilities for the Developmentally Disabled (ICF/DD) bill for their services and are paid.
Ultimately, the Legislature adopted $190 million in savings in the 2010–11 budget:
- Provider Payment Reduction ($86 Million). The Legislature approved the 4.25 percent provider payment reduction through the end of 2010–11 proposed by the Governor, generating $86 million in General Fund savings.
- Federal Fund Increase to Offset General Fund ($54 Million). The Legislature adopted the administration's proposal to modify ICF/DD billing and payment mechanisms in order to draw down federal funding and offset General Fund expenditures on an ongoing basis.
- First Five Commission Funds ($50 Million). The First Five Commission provided $50 million in continued funding in 2010–11 to offset General Fund monies that had been previously eliminated by a Governor's veto in 2009–10.
In January of 2011, the Governor proposed to achieve a $750 million General Fund reduction to the DDS workload budget in 2011–12 through the following proposals:
- Implementation of Best Practices ($534 Million). The budget plan proposed to achieve system–wide mostly ongoing savings through a variety of mechanisms, including DC expenditure reductions, increased accountability and transparency, and implementation of statewide service standards.
- Continued Savings From Extending Existing Measures ($142 Million). The budget plan proposed to continue for another year: (1) the 4.25 percent provider payment reductions ($92 million) and (2) the First Five Commission funding ($50 million).
- Increasing Federal Financial Participation to Offset General Fund ($75 Million). The budget plan proposed to increase federal financial participation through: (1) amendments to the state's Medicaid plan and maximizing the use of federal "Money Follows the Person" funding for individuals placed out of institutions ($65 million), and (2) certification of the secure treatment facility at Porterville DC ($10 million).
The Legislature ultimately adopted the following major savings provisions in the 2011–12 budget, totaling approximately $660 million:
- DC Reductions to OE&E, Personnel, Capital Outlay ($40 Million). The Legislature adopted a series of one–time and ongoing reductions in OE&E, personnel, and capital outlay in DCs. For example, budgets for DCs were reduced due to reductions in staff and a Sonoma DC capital outlay project was deleted.
- RC Reductions and Cost Control Measures ($174 Million). In order to achieve savings, RCs were charged by the Legislature with the task of implementing best practices and cost–control measures in an effort to reduce General Fund spending by $174 million. For example, RCs maximized their use of generic resources in education and helped consumers access the lowest cost transportation option available. The department phased out the Prevention Program for at–risk babies and required RCs to refer at–risk babies to Family Resource Centers.
- Increasing Federal Financial Participation to Offset General Fund ($88 Million). The Legislature approved a modified version of the Governor's proposal to increase federal financial participation. Through a number of federal initiatives, the department was able to secure approximately $88 million in funding. Use of the federal Money Follows the Person grant and the Home and Community–Based Waiver for RC Operations generated substantial General Fund savings.
- Continuation of First Five Commission Funding ($50 Million). Similar to the previous fiscal years, the Legislature approved a continuation of First Five Commission funding for 2011–12.
- Continuation of 4.25 Percent Provider Payment Reduction ($92 Million). The Legislature adopted the administration's proposal to continue for another year the 4.25 percent provider payment reduction.
- Transfer Prevention Program to Family Resource Centers ($8 Million). The Early Start Prevention Program, geared for children between the ages of 0 and 35 months who are at risk for a developmental disability, was eliminated and then transferred to the Family Resource Centers. As Family Resource Centers are paid with Proposition 10 dollars, this action reduced the General Fund obligation by $7.5 million.
- Accountability Measures ($110 Million). The Legislature adopted statutory language intended to improve RC accountability. For example, it placed administrative cost caps on RCs and vendors, changed audit provisions for RC services, and required RCs to submit a conflict of interest policy to ensure RC employees and board members do not have a conflict of interest with an entity that receives RC funding. These measures were anticipated to create $110 million of General Fund savings.
- Budget Trigger Cuts ($100 Million). In the 2011–12 Budget Act, the Legislature approved a $100 million reduction in RCs to be triggered if revenues fell below levels assumed in the budget. The trigger was pulled and it appears that the department will reach its $100 million savings goal "on the natural" in the current year without the implementation of specifically identified savings measures.
Review of DC Budget Methodology. In addition to the savings measures described above, the Legislature acted to improve oversight of DCs. Chapter 37, Statutes of 2011 (AB 104, Committee on Budget), requires DDS to reimburse the Office of Statewide Audits and Evaluations (OSAE) within the Department of Finance to conduct a review and analysis of the budget methodology used to determine the annual budget for the DCs. It was the intent of the Legislature for DDS to proceed with the review in the fall of 2011. According to the administration, OSAE expects to release its review in May 2012.
Spending in DDS has remained relatively flat over the last three years mainly because the Legislature has adopted various savings measures that have largely offset growth in costs due to increases in caseload and utilization of services. There have been three main sets of strategies that have been used to create General Fund savings from the department's workload budget. First, there has been an increased use of non–General Fund monies, including federal funds and First Five Commission revenues. Second, there has been a reduction in provider payment rates. This reduction was initially adopted on a one–time basis, but has been renewed by the Legislature for subsequent fiscal years. Finally, some savings were created through the implementation of best practices, cost–control measures, and a scaling back in the provision of some services. Some of these savings were identified by stakeholder working groups.
Return to LAO 2012-13 Budget: Health Table of Contents
Return to LAO 2012-13 Budget: Full Table of Contents