To help the Legislature in crafting its 2011–12 education budget, we distributed a budget survey to all California public school districts in the fall of 2010. The survey was designed to gather information about the effects of recent state and federal actions on school district finance and operations. Below, we (1) provide background information on these recent actions, (2) present major findings from the survey on how these actions have affected K–12 programs, and (3) provide the Legislature with some recommendations that would provide school districts with additional flexibility in the short term as well as some recommendations that would help improve the state’s K–12 finance system in the long term. The report also has an Appendix that contains a complete listing of 2010 survey questions and results.
In recent years, California’s school districts have seen a notable decrease in programmatic funding. As shown in Figure 1, programmatic funding for school districts is 5 percent lower in 2010–11 compared to 2007–08. Under the Governor’s January proposal, programmatic per–pupil funding for 2011–12 would fall slightly further—down 6.4 percent from the 2007–08 level. The K–12 programmatic reductions would have been even deeper over the last few years had they not been mitigated by one–time federal aid and state payment deferrals (which essentially supported program using funds borrowed from the next fiscal year). Nonetheless, because programmatic reductions still were needed, the state also adopted various policy changes intended to help school districts make the reductions in ways that had the least adverse effect on students and teachers. Below, we discuss each of these developments in more detail.
Figure 1
K–12 Programmatic Fundinga
(Dollars in Millions Unless Otherwise Specified)
|
|
2007–08 Final
|
2008–09 Final
|
2009–10 Final
|
2010–11 Revised
|
2011–12 Proposed
|
|
Programmatic Funding
|
|
|
|
|
|
|
K–12 ongoing fundingb
|
$48,883
|
$43,215
|
$40,717
|
$42,945
|
$43,131
|
|
New payment deferrals
|
—
|
2,904
|
1,679
|
1,719
|
2,063
|
|
Settle–up payments
|
—
|
1,101
|
—
|
267
|
—
|
|
Public Transportation Account
|
99
|
619
|
—
|
—
|
—
|
|
Freed–up restricted reservesc
|
—
|
1,100
|
1,100
|
—
|
—
|
|
ARRA fundingc
|
—
|
1,192
|
3,575
|
1,192
|
—
|
|
Federal education jobs fundingc
|
—
|
—
|
—
|
421
|
781
|
|
Totals
|
$48,982
|
$50,130
|
$47,070
|
$46,544
|
$45,975
|
|
Per–Pupil Programmatic Funding
|
|
|
|
|
|
|
K–12 attendance
|
5,947,758
|
5,957,111
|
5,933,761
|
5,951,826
|
5,964,800
|
|
K–12 Per–Pupil Funding (In Dollars)
|
$8,235
|
$8,415
|
$7,933
|
$7,820
|
$7,708
|
|
Percent Change From 2007–08
|
—
|
2.2%
|
–3.7%
|
–5.0%
|
–6.4%
|
One of the most significant developments affecting school districts over the last couple of years has been the infusion of one–time federal aid. In total, California received $7.3 billion in additional one–time federal education funding—much of which could be used to mitigate reductions in state funding for school districts. As shown in Figure 2, the largest source of federal funding came from the American Recovery and Reinvestment Act (ARRA) of 2009, which provided California with $6.1 billion to help stabilize the state’s education budget. These ARRA funds (set to expire in September of 2011) were virtually all used to support operations during the 2008–09, 2009–10, and 2010–11 school years—leaving many districts potentially facing a significant decrease in programmatic funding for the 2011–12 school year. Partially in response, the federal government passed The Education Jobs Fund (“Ed Jobs”) Act of 2010. This act provided California school districts with $1.2 billion to retain or create K–12 education jobs. Though the state authorized distribution of Ed Jobs funds to the field in September of 2010, these funds do not expire until September of 2012, allowing districts, if desired, to spread the funds across the 2010–11 and 2011–12 school years.
Figure 2
One–Time Federal Aid for K–12 Education
(In Millions)
|
Program
|
Funding
|
|
American Recovery and Reinvesment Act (ARRA)
|
|
|
State Fiscal Stabilization Fund
|
$3,243
|
|
Special Education/Individuals With Disabilities Education Act
|
1,327
|
|
Title I program for low–income students
|
1,125
|
|
School Improvement Grant
|
352
|
|
Enhancing Education Through Technology
|
72
|
|
Other
|
15
|
|
Subtotal, ARRA
|
($6,134)
|
|
Education Jobs Fund
|
$1,202
|
|
Total
|
$7,336
|
At the state level, programmatic impacts also have been mitigated by K–12 payment deferrals. The state has used deferrals as a way to avoid programmatic cuts in one year by relying on funds borrowed from the next fiscal year. As shown in Figure 3, the state has relied heavily on deferrals the last three years—with K–12 payment deferrals now totaling $7.4 billion. At existing levels, 17 percent of K–12 Proposition 98 programmatic support is paid using funds borrowed from the next fiscal year. The Governor’s January budget proposes an additional $2.1 billion K–12 deferral, bringing total K–12 deferrals up to $9.4 billion or 21 percent of K–12 Proposition 98 support. (For more information on these deferrals, please see our 2011 budget brief,
To Defer or Not Defer? An Analysis of the Effects of K–12 Payment Deferrals.)
Despite the infusion of one–time federal aid and the state’s reliance on payment deferrals, school districts still have needed to make programmatic reductions since 2007–08. To provide school districts more options to make these reductions in ways that have the least adverse effect on students and teachers, the state has made various policy changes. Among the most significant of these changes has been the removal or relaxing of certain state requirements, discussed in more detail below.
Many Categorical Program Requirements Suspended. Among the most significant policy changes has been the suspension of many categorical program requirements. As part of the 2009–10 budget package, the state removed the requirements associated with about 40 categorical programs (see Figure 4). Prior to 2008–09, the state separately funded approximately 60 K–12 categorical programs. For each of these categorical programs, school districts were required to use program monies to meet associated program requirements. Chapter 2, Statutes of 2009 (ABX4 2, Evans), essentially allowed funding associated with 40 of these categorical programs to be used for any educational purpose. Local governing boards are required to discuss and approve the proposed use of these “flexed” funds at a regularly scheduled public hearing. From a fiscal perspective, the “flex item” effectively converted $4.5 billion, or about 40 percent of all categorical funding, from restricted to unrestricted monies. Under current law, school districts have been granted this flexibility from 2008–09 through 2012–13. The state continues to separately fund the remaining approximately 20 categorical programs (see Figure)—reflecting $6.7 billion, or about 60 percent, of all categorical funding. Funding for these excluded programs remains linked to associated program requirements.
Figure 4
State Removes Strings Tied to About 40 Categorical Programs
(In Millions)
|
Program
|
2010–11 Funding
|
|
Targeted Instructional Improvement Block Grant
|
$855
|
|
Adult education
|
635
|
|
Regional Occupational Centers and Programs
|
385
|
|
School and Library Improvement Block Grant
|
370
|
|
Supplemental instruction
|
336
|
|
Instructional Materials Block Grant
|
334
|
|
Deferred maintenance
|
251
|
|
Professional Development Block Grant
|
218
|
|
Grade 7–12 counseling
|
167
|
|
Charter schools categorical block grant
|
142
|
|
Teacher Credentialing Block Grant
|
90
|
|
Arts and Music Block Grant
|
88
|
|
School Safety Block Grant
|
80
|
|
Ninth–Grade Class Size Reduction
|
79
|
|
Pupil Retention Block Grant
|
77
|
|
California High School Exit Exam supplemental instruction
|
58
|
|
California School Age Families Education
|
46
|
|
Professional Development Institutes for Math and English
|
45
|
|
Gifted and Talented Education
|
44
|
|
Community Day Schools
|
42
|
|
Community Based English Tutoring
|
40
|
|
Physical Education Block Grant
|
34
|
|
Alternative Credentialing/Internship programs
|
26
|
|
Peer Assistance and Review
|
24
|
|
School Safety Competitive Grants
|
14
|
|
California Technology Assistance Projects
|
14
|
|
Certificated Staff Mentoring
|
9
|
|
County offices of education Williams audits
|
8
|
|
Specialized Secondary Programs
|
5
|
|
Principal Training
|
4
|
|
American Indian Education Centers
|
4
|
|
Oral health assessments
|
4
|
|
Advanced Placement fee waivers
|
2
|
|
National Board certification incentive grants
|
2
|
|
Bilingual teacher training assistance program
|
2
|
|
American Indian Early Education Program
|
1
|
|
Reader services for blind teachers
|
—a
|
|
Center for Civic Education
|
—a
|
|
Teacher dismissal apportionments
|
—a
|
|
California Association of Student Councils
|
—a
|
|
Total
|
$4,537
|
Figure 5
About 20 Categorical Programs With Strings Still Attacheda
(In Millions)
|
Program
|
2010–11 Funding
|
|
Special education
|
$3,107
|
|
Economic Impact Aid
|
942
|
|
K–3 Class Size Reduction
|
935
|
|
After School Education and Safety
|
547
|
|
Home–to–School Transportation
|
496
|
|
Quality Education Investment Act
|
402
|
|
Child nutrition
|
151
|
|
Student assessments
|
71
|
|
Charter school facility grants
|
61
|
|
Year–Round School grants
|
31
|
|
Partnership Academies
|
19
|
|
Apprentice programs
|
16
|
|
Foster youth programs
|
15
|
|
Adults in correctional facilities
|
15
|
|
County office oversight
|
9
|
|
K–12 High–Speed Network
|
8
|
|
Agricultural vocational education
|
4
|
|
Total
|
$6,830
|
“Locked In” District Allocations. Prior to 2008–09, funding for the categorical programs that are now flexed was allocated to school districts based mostly on program–specific factors. For example, a district’s Teacher Credentialing Block Grant allocation was based on its number of first– and second–year teachers, its Peer Assistance and Review allocation was based on 5 percent of its total certificated classroom teacher count, and its Art and Music Block Grant allocation was based on its K–12 pupil count. For the next few years, however, districts’ allocations will no longer be linked to these program–specific factors. Instead, a district’s allocation for each flexed program will be based on its share of total program funding either in 2007–08 or 2008–09 (the earlier year was used for certain participation–driven programs). As a result, total funding provided for the flexed programs could change over the next few years depending on state actions, but districts’ proportional share of the total allocation will not change.
Adopted Several Other Flexibility Options. In addition to freeing up substantial categorical funding, the state has adopted various other flexibility provisions over the last few years (see Figure 6). Among the most notable of these changes are provisions (1) allowing school districts to shorten the school year by as many as five days, (2) making more modest funding reductions for K–3 classes that exceed 20 students, and (3) eliminating or suspending some K–12 mandates. Similar to categorical flexibility, these other flexibility options largely are intended to provide districts some relief during a difficult fiscal climate, with most of the options operative through 2012–13.
Figure 6
Summary of Flexibility Options in Recent Budget Packages
|
Program
|
Description
|
Final Year
|
|
Current Law
|
Proposed
|
|
Categorical fund balances
|
Allows districts to spend ending categorical balances (except in seven programs) for any educational purpose.
|
2009–10
|
No change
|
|
K–3 Class Size Reduction
|
Allows districts to exceed 20 students per K–3 classroom without losing as much funding as under previous rules.
|
2011–12
|
2013–14
|
|
Education mandates
|
Suspends some or all requirements associated with six K–12 education mandates.
|
2012–13
|
No change
|
|
Instructional time requirements
|
Provides school district option to reduce length of school year by as many as five days.
|
2012–13
|
2014–15
|
|
Sale of surplus property
|
Allows districts to use the proceeds of surplus property sales for any purpose if property was purchased entirely with local funds.
|
2012–13
|
2014–15
|
|
Categorical program flexibility
|
Allows districts to use funding tied to roughly 40 categorical programs for any educational purpose.
|
2012–13
|
2014–15
|
|
Routine maintenance
|
Lowers the percentage districts must set aside for maintenance of school buildings from 3 percent to 1 percent of expenditures. Districts with facilities in good repair are exempt from any set–aside amount.
|
2012–13
|
2014–15
|
|
Deferred maintenance
|
Eliminates requirement that districts spend their own funds on deferred maintenance in order to qualify for state dollars.
|
2012–13
|
2014–15
|
|
Instructional material purchases
|
Postpones requirement that districts purchase new instructional material packages.
|
2012–13
|
2014–15
|
2011–12 Governor’s Budget Proposes to Extend Flexibility for Two Additional Years. As shown in Figure 6, the Governor’s budget proposes to extend most flexibility options for another two years. The two–year extension would be effective from the date a given flexibility provision is currently set to expire under statute. For instance, flexibility for categorical programs that would have sunset July 1, 2013 instead would sunset July 1, 2015. Similarly, the funding flexibility rules for the CSR program set to expire July 1, 2012 would be extended through July 1, 2014.
The survey we distributed in the fall of 2010 was designed to provide the Legislature with information on how school districts are responding to recent state and federal actions. Specifically, the survey asks a range of questions about the programmatic impact of federal funding, deferrals, and flexibility policies. Out of roughly 1,000 districts statewide, 382 submitted a completed response form. Of those districts, we received responses from eight of the state’s ten largest districts. In total, the districts that responded to our survey represent 58 percent of the state’s ADA.
Survey Respondents Reflective of State. Figure 7 lists several demographic factors and compares our survey respondents with the statewide average. As shown, the districts that responded to our survey are representative of the socioeconomic composition of all students in the state. The percentage of African–Americans, Asians, and English Learner students represented by districts in our survey are within 0.5 percent of the total percentage statewide. Whites, however, were slightly underrepresented whereas Latinos and students eligible for free or reduced–price meals were slightly overrepresented in our survey.
Figure 7
Survey Respondents Representative of State
|
Student Characteristic
|
Percent of Student Population:
|
|
Survey Respondents
|
Total Statewide
|
Difference
|
|
African–American enrollment
|
7%
|
7%
|
—
|
|
Asian enrollment
|
9
|
9
|
—
|
|
White enrollment
|
25
|
27
|
–2%
|
|
Latino enrollment
|
53
|
50
|
3
|
|
English Learners
|
24
|
24
|
—
|
|
FRPM Participation
|
59
|
57
|
2
|
Below, we highlight the major findings from the survey. Survey responses largely confirm that districts are relying heavily on one–time federal funds and deferrals to support more programmatic spending. Districts also are relying heavily on categorical flexibility provisions—dismantling or significantly downsizing certain categorical programs to redirect support to core classroom instruction. Most respondents also are taking advantage of other flexibility options, such as shortening the school year, to balance their budgets. Survey responses indicate these flexibility provisions are helping districts protect certain local priorities in the midst of shrinking budgets. Nonetheless, districts still have had to make notable programmatic reductions—for example, increasing class sizes, instituting employee furloughs, and laying off staff.
Federal Funds Being Used Mostly for Teacher Salaries. As shown in Figure 8, school districts largely spent or plan to spend ARRA and Ed Jobs funds similarly—to hire and retain teachers. Over 75 percent of districts report that paying teacher salaries was a top priority when expending ARRA and Ed Jobs funds. Moreover, most Ed Jobs funding not being used to hire or retain staff directly is reportedly being used for related purposes, such as eliminating furlough days. (Given ARRA funding was somewhat more flexible than Ed Jobs funding, a greater percentage of districts reported using ARRA dollars to backfill cuts to categorical programs and for one–time expenditures.)
Districts Respond to Deferrals Largely by Draining Reserves, Borrowing. As expected, deferrals have been used by districts to help maintain programmatic support. Roughly 75 percent of districts report that they accommodated the deferrals enacted prior to the 2010–11 fiscal year by drawing down district reserves, with a relatively high percentage of districts also borrowing from special funds (46 percent) and/or relying on external borrowing (28 percent). Just over a fifth of districts report that they made programmatic cuts rather than borrow.
Additional Deferrals Likely to Result in More Borrowing, More Programmatic Cuts. Survey results suggest additional deferrals may be more difficult for school districts to accommodate. For example, roughly 45 percent of districts report that they are waiting to spend the $1.7 billion current–year deferral until either late in 2010–11 or in 2011–12. (In essence, this action treats the deferral as a current–year cut rather than an opportunity to increase programmatic spending.) Additional deferrals, such as the new $2.1 billion deferral proposed in the Governor’s budget, would likely also be handled with a greater reliance on cuts and borrowing. As shown in Figure 9, the percentage of districts that would manage a new deferral by making cuts increases from 20 percent for existing deferrals to more than 40 percent for a new deferral. Similarly, the percentage of districts that would rely on external borrowing to accommodate a new deferral in 2011–12 increases by more than 15 percent and the percentage of districts that would borrow from county sources more than doubles.
Flexibility Having Largely Positive Impact on Local Decision Making. Given federal funds and deferrals have not been enough to sustain all programmatic support, districts have had to make a range of decisions to balance their budgets. As expected, categorical flexibility has made such decision making easier. In particular, the vast majority of districts report that categorical flexibility has made it easier to develop and balance a budget, dedicate resources to local education priorities, make personnel decisions, develop and implement a strategic plan, and fund programs for at–risk students. Moreover, an even higher percentage of districts report that categorical flexibility is having a positive effect in 2010–11 compared to 2009–10. For example, in 2009, 87 percent of districts reported that categorical flexibility made developing and balancing a budget easier and 79 percent of districts reported that categorical flexibility helped them dedicate resources to local education priorities. By comparison, in 2010, these figures increased to 95 percent and 93 percent of districts, respectively.
More Funding Being Shifted Away From Categorical Programs. As shown in Figure 10, every major flexed categorical program is having funds shifted from it. Moreover, a large percentage of districts are shifting funds away from certain flexed programs. For example, more than 70 percent of districts report diverting funding away from high school CSR, art and music, adult education, supplemental instruction, gifted and talented education, and professional development. In some cases, a far greater percentage of districts report shifting funds from programs this year compared to last year. For example, the percentage of districts that are diverting funds from their alternative teacher credentialing and intern programs rose from 30 percent in 2009–10 to almost 60 percent in 2010–11 and the percentage of districts that are diverting funds from the California School Age Families Education program rose from 40 percent in 2009–10 to just under 60 percent in 2010–11.
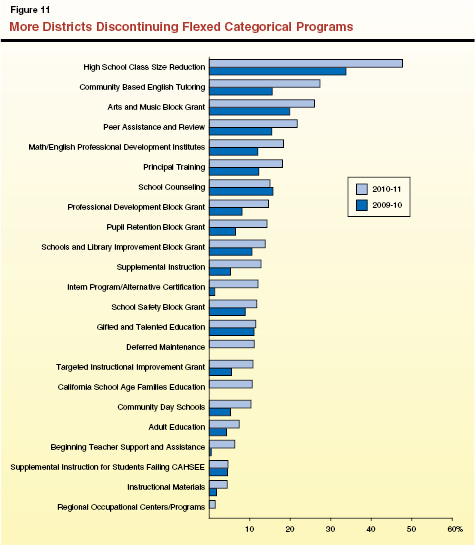
Higher Percentage of Districts Eliminating Programs. Additionally, as shown in Figure 11, more districts are discontinuing flexed programs in 2010–11 compared to 2009–10. For example, about one–third of districts reported discontinuing High School CSR in 2009–10. By comparison, almost half of districts discontinued the program in 2010–11. A notably higher percentage of districts in 2010–11 compared to last year also report discontinuing Community–Based English Tutoring, art and music, and professional development programs. Despite these eliminations, only a small percentage of districts are eliminating programs for at–risk students, though the number of districts eliminating them is on the rise. For example, the percentage of districts discontinuing supplemental instruction rose from 5 percent in 2009–10 to 13 percent in 2010–11.
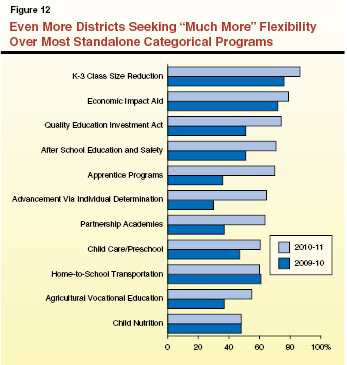
Even More Districts Seeking Additional Flexibility. As shown in Figure 12, many districts also want more flexibility to operate categorical programs that still have strings attached. For example, more than three–fourths of districts report wanting much more flexibility to operate K–3 CSR and Economic Impact Aid. Moreover, the percentage of districts wanting much more flexibility has increased notably from 2009–10 to 2010–11 for some programs. For example, roughly 50 percent of districts wanted much more flexibility to operate the Quality Education Investment Act program in 2009–10 compared to 75 percent in 2010–11. Similarly, notably higher percentages of districts now seek much more flexibility to operate standalone career technical education (CTE) programs. For example, the percentage of districts reporting that they want much more flexibility to operate Apprenticeship programs rose from 36 percent in 2009–10 to 70 percent in 2010–11.
Districts Would Take Advantage of Additional Mandate Flexibility With Little Programmatic Impact. To explore the potential impact of extending flexibility to education mandates, our survey also asks districts how they would respond if certain active education mandates were eliminated. The vast majority of districts report they would continue to perform activities required by active mandates even if the mandate were eliminated. As shown in Figure 13, over 95 percent of districts report they would continue to perform basic student and teacher safety functions without a mandate, as well as reach out to the parents of students who are truant. These responses suggest that current mandate suspensions and eliminations might affect actual services only minimally.
Figure 13
Vast Majority of Districts Would Still Meet Mandate Objectives Even
If Requirements Eliminated
|
Mandated Activity
|
Continue or Achieve Differently
|
No Longer Perform
|
|
Evaluate teachers on their effectiveness helping students meet academic standards
|
98%
|
2%
|
|
Conduct annual evaluations of ineffective or poorly performing teachers
|
98
|
2
|
|
Notify teachers when a student is expelled
|
97
|
3
|
|
Notify parents when a student is truant
|
97
|
3
|
|
Continue to expel students for offenses previously deemed mandatorily expellable
|
96
|
4
|
|
Attempt to meet with parents when a student is habitually truant
|
96
|
4
|
|
Alert law enforcement when a student commits a crime on campus
|
96
|
4
|
|
Develop and implement pupil promotion and retention policies
|
93
|
7
|
|
Ensure students are immunized before entering school for the first time
|
93
|
7
|
|
Update each school’s comprehensive safety plan
|
88
|
12
|
|
Allow students to transfer among schools in the district, provide an appeals process
|
83
|
17
|
|
Provide HIV/AIDS prevention instruction in middle and high school
|
82
|
18
|
|
Send out annual parent notification by mail
|
77
|
23
|
|
Administer physical performance tests (Fitnessgram) during middle and high school
|
71
|
29
|
District Bargaining Contracts Include Variety of Cost–Saving Strategies. Districts also have balanced their budgets by negotiating various other reductions with their employee groups. For example, about half of districts report furloughing their teachers at least one day during 2010–11. (By comparison, about 30 percent of districts report furloughing their teachers at least one day during 2009–10.) Nearly half of districts also have negotiated an increase in class size maximums in 2010–11. A smaller percentage of districts report reducing health benefits (17 percent), retirement benefits (3 percent), or vacation days (3 percent). (Despite these cost–saving measures, the vast majority of districts still provided step–and–column salary increases.)
Class Sizes Generally Increasing. In addition to balancing budgets through staffing and benefit reductions, districts have managed shrinking resources by increasing class sizes. As shown in Figure 14 (see page 17), the average class size by district in kindergarten through third grade rose from roughly 20 in 2008–09 to 25 in 2010–11. Additionally, the average class size in all other grades rose from roughly 28 to more than 31. (Though our survey did not collect specific data on class sizes in excess of 31 students, reports from the field suggest that certain high schools have increased some class sizes to as many as 35 students.)
Figure 14
Average Class Sizes Increasinga
|
Grade
|
2008–09
|
2009–10
|
2010–11
|
|
Kindergarten
|
21
|
23
|
25
|
|
First grade
|
20
|
22
|
25
|
|
Second grade
|
20
|
22
|
25
|
|
Third grade
|
21
|
23
|
25
|
|
Other grades
|
28
|
28
|
31 or more
|
Many Districts Offer Fewer Instructional Days. Finally, an increasing number of districts also are taking advantage of the option provided by the state to reduce the length of the school year by up to five days. Whereas about 20 percent of districts reported reducing the school year in 2009–10, almost 60 percent report reducing the length of the 2010–11 school year. For 2010–11, about 30 percent of districts are reducing the school year to the state minimum of 175 days (only 5 percent of districts reduced to 175 days in 2009–10).
In this section, we make various recommendations for providing school districts with more flexibility in the short term, improving the state’s K–12 finance system in the long term, and then aligning state operations with the streamlined K–12 finance system. Our recommendations are based on our survey findings as well as our ongoing assessment of the state’s K–12 programs and statutory requirements. Figure 15 summarizes these recommendations, each of which is discussed in more detail below.
Figure 15
LAO Recommendations
|
Increase Flexibility in Short Term
|
- Remove strings tied to K–3 Class Size Reduction and Home–to–School Transportation
|
- Remove strings from After School Education and Safety program by repealing Proposition 49
|
- Link flex funding to students
|
- Eliminate certain mandated education activities
|
- Ease restrictions on contracting out for noninstructional services
|
- Ease restrictions regarding pay rates and priority for substitute teaching positions
|
|
Improve K–12 Finance System Moving Forward
|
- Consolidate virtually all K–12 funding into revenue limits and a few block grants moving forward
|
|
Align State Operations With New Finance System
|
- Minimize California Department of Education's (CDE) focus on compliance monitoring
|
- Refocus CDE mission on data, accountability, and dissemination of best practices
|
The state has many options for providing school districts with more flexibility in 2011–12 without negatively impacting the core services provided to students. Below, we use our survey responses to help craft recommendations for providing additional flexibility in the coming year. While these recommendations would give districts more tools to address immediate budget shortfalls, they also represent policy changes that would benefit districts in any fiscal climate. Moreover, taking these actions now will set the foundation for comprehensive improvements to the state’s education finance structure moving forward.
Remove Strings From More Categorical Programs. As we discussed in last year’s survey report, Year–One Survey: Update on School District Finance and Flexibility, K–3 CSR and HTS transportation are strong candidates to be placed in the flex item. For K–3 CSR, the current funding structure is only tenuously linked to the underlying policy objectives. That is, most districts are no longer meeting the program’s central policy objective—to reduce K–3 classes to 20 or fewer students. For HTS transportation, the existing funding structure is widely recognized as antiquated and unfair—resulting in district funding allocations that are very poor reflections of districts’ current underlying needs. The existing HTS formula also contains a “use it or lose it” provision that discourages districts from implementing more cost–effective practices, as decreasing costs in one year means losing funding the next year. In addition, given the current fiscal environment, at least some districts might want to redirect funds from noninstructional services, such as HTS transportation, to classroom instruction. Moreover, most districts responding to our survey indicate they would benefit from more flexibility for CSR (87 percent) and HTS (73 percent). For all these reasons, we recommend folding both programs into the flex item.
Also Remove Strings From ASES Program. We also continue to recommend making ASES flexible by repealing Proposition 49. Passed by the voters in 2002, Proposition 49 requires the state to provide $550 million annually for after school programs. This level of support must be provided for these programs regardless of the state’s fiscal condition or other state and local budget priorities. Given the tight fiscal environment over the last few years, this has resulted in some school districts having to reduce core classroom support more deeply while supplemental after school activities have remained untouched. Likely because of these counterproductive effects, 71 percent of the districts that responded to our survey indicate they want “much more” flexibility in operating after school programs (with most other respondents indicating they wanted at least “some” additional flexibility). If the state were to repeal Proposition 49, then it would be able to assess the merits of after school programs within the context of its overall budget. Based upon such an assessment, the state could include the program in the flex item or retain it as a standalone categorical program but determine the appropriate funding level each year given all other competing priorities. If the state decided to retain after school services, then it could consider giving priority for service to eligible school–age children who might be displaced as a result of reductions in state subsidized child care programs.
Link Flex Funding to Students. Regardless of which specific programs are included in the flex item in 2011–12, we recommend the Legislature modify the methodology used to allocate flex–item funding to school districts. Specifically, we recommend the Legislature develop a per–pupil rate for each district by dividing the amount it received for all flexed programs in 2010–11 by its total ADA. Linking this funding to students would help create a rational basis for making future funding adjustments. If the Legislature chose to streamline its education finance system, the transition to such a system also would be less disruptive if most existing state funding already were linked to students and adjusted annually according to changes in the student population. (As discussed later, the Legislature could choose to equalize general purpose per–pupil funding under a new finance model.)
Expand Mandate Reform. In addition to removing strings attached to certain categorical programs, we also continue to recommend the state eliminate certain mandated education activities. (Categorical programs and education mandates are very similar functionally, with the primary difference being that the state typically funds categorical programs up front whereas it funds mandates only on a reimbursement basis.) Although the state removed some requirements associated with certain K–12 mandated activities last year, we recommend additional requirements be removed in 2011–12. Specifically, in our 2009 report,
Education Mandates: Overhauling a Broken System, we highlighted 26 mandates that the state could eliminate (that have not already been eliminated), including Notification of Truancy, The Stull Act, and Intra–District Transfers. Given all other competing priorities, we think these types of activities are lower priority and requiring districts to undertake them, particularly in this environment and potentially at the expense of other higher priority student services, makes little sense and places unneeded pressure on limited district resources. Furthermore, we continue to recommend that the state consider options for simplifying the process of funding whatever mandates it continues to require. For example, for several of the active mandates, the state could create a block grant that would provide a standard rate to every district. In addition to simplifying the mandate finance system for districts and the state, a block grant approach would help reduce the notable inequities in the amounts districts now receive for performing the same mandated services.
Ease Restrictions on Contracting Out. In addition to reducing the number of categorical and mandate requirements, we recommend the state remove various other statutory restrictions now placed on school districts. One such restriction relates to school districts’ ability to contract out for noninstructional services (such as food services, maintenance, clerical functions, and payroll). Currently, school districts can contract for these services only if certain conditions are met. For example, contracting for services cannot be done solely for the purpose of achieving savings. Contracting out also cannot result in the lay off or demotion of existing district employees. These restrictions make implementing the most cost–effective options for providing noninstructional services very difficult for school districts. We recommend eliminating these restrictions on contracting out to help school districts achieve greater efficiencies in their noninstructional services.
Provide Flexibility in Pay and Priority for Substitute Teaching Positions. Similarly, the state also currently has restrictions relating to substitute teachers. Specifically, the state requires districts to hire substitute teachers based on seniority rankings, with the most senior laid–off teachers given highest priority. Additionally, if a formerly laid–off teacher serves as a substitute more than 20 days in a 60–day period, he/she must be paid at his/her pre–layoff salary rate. This is problematic for two main reasons. First, it reduces districts’ ability to hire the most effective substitute teachers. Second, it imposes a financial strain on districts by forcing them to hire the most expensive substitute teachers. For these reasons, we recommend removing these restrictions. As a result, districts would be able to choose from among the entire pool of substitute teachers and negotiate the associated pay rate at the local level. This could generate savings at the local level and afford districts a better opportunity to hire the most effective substitute–teaching candidates.
While we recommend the Legislature take certain steps to provide school districts with additional flexibility and fiscal relief in 2011–12, we think the state also needs to improve the K–12 finance system on a lasting basis. While helpful, the categorical flexibility package adopted in February of 2009 was not designed as strategically as possible. It also was put in place for a relatively short period of time with no clear exit strategy. As a result, with the end of flexibility potentially only a couple of years away, school districts are having increasing difficulty knowing what the state will expect of them come 2013–14. While the Governor attempted partly to address this issue by extending the flexibility provisions two years, we believe the state needs a more definitive exit strategy. That is, we think this is an opportune time for the state to rethink its overall K–12 finance system and craft a better system. Below, we discuss problems with the current K–12 finance system and make recommendations for how to approach reform moving forward.
State Education Finance System Deeply Flawed. As our office has argued in the past, the state’s categorical program structure, as well as its broader K–12 finance system, is deeply flawed. First, little evidence exists that the vast majority of categorical programs are achieving their intended purposes. This is in part because programs are so rarely evaluated. In addition, separate categorical programs often contain some overlapping and some unique requirements. This magnifies the difficulty that districts have in offering cohesive services to students. It also blurs accountability and increases administrative burden. Moreover, having so many different categorical programs with somewhat different requirements creates a compliance–oriented system rather than a student–oriented system. In California, these problems are further exacerbated by categorical programs that have antiquated funding formulas that over time have become increasingly disconnected from local needs. For all these reasons, several research groups over the last decade have concluded that California’s K–12 finance system is overly complex, irrational, inequitable, inefficient, and highly centralized.
Flex Item Has Helped, but Major Issues Remain. Though the state’s current categorical flexibility provisions have temporarily decentralized some decision making, the provisions have done little to make the K–12 finance system more rational, equitable, and efficient. Even though reduced in number, many categorical requirements still remain that continue to hamper districts’ ability to tailor their investments to their local needs. Indeed, the overwhelming majority of districts in our survey reported wanting much more flexibility to operate virtually every existing standalone categorical program. Additionally, little rationale exists for why some programs are now flexible whereas others are not. For example, two CTE programs are flexible whereas three CTE programs still have strings attached. Moreover, some programs are “flexible” even though the funds traditionally are allocated by the state only to a single entity for a single purpose (for example, the Center for Civic Education). In these cases, “flexibility” means the state now funds the agency without the agency having to deliver anything to the state. In other cases, competitive grant programs were made flexible—as a result, the last set of grant winners continue to receive funding into perpetuity. Other issues remain for certain programs. For example, the deferred maintenance program, which was based on a particularly poor incentive structure, was made flexible without any improvement to the underlying incentives or adjustment in the funding level. In addition, the adult education program was made flexible without any indication whether the state was making a purposeful policy decision to eliminate adult education services. In short, even if the current flexibility structure were made permanent, the K–12 finance system still would have inherent flaws.
Governor’s Proposal Helps Districts but Misses Opportunity to Improve System, Postpones Critical Decisions. By extending most flexibility provisions by two years, the Governor’s proposal helps school districts in building and balancing their budgets over the next few years. It postpones, however, important decisions that the state must ultimately confront regarding the basic structure of its K–12 finance system. Given all the existing problems noted regarding the K–12 finance system—problems that would remain and potentially be exacerbated over the extended flex period—we see little benefit in postponing these decisions.
Recommend Adopting Block Grant Approach, Minimizing Number of Pots. Rather than extend current categorical flexibility for two more years, we recommend the Legislature improve the state’s K–12 finance system on a lasting basis. Regarding a new finance structure, we recommend the Legislature consolidate virtually all K–12 funding into revenue limits and a few block grants. Unlike the current flex item, a few block grants would provide flexibility while also allowing more opportunity for the state to ensure at–risk and/or high–cost students continue to receive the services they need. For example, the state might create a disadvantaged student block grant and a special education block grant to ensure school districts dedicate additional resources to these higher–cost students. (The researchers from both the Getting Down to Facts project and the Public Policy Institute of California have proposed systems that are based only on revenue limits, a disadvantaged student component, and a special education component.) Regarding timing, we recommend the Legislature develop the new finance system in 2011–12, with implementation beginning shortly thereafter (during which districts would be held harmless) and extending throughout an equalization period (during which time the state would use growth funds to make incremental adjustments to district allocations to ensure as much rationality and equity as possible). In addition to making improvements permanent, our recommended approach would create a system that is simpler, more transparent, rational, and better connected to student needs.
Several Major Issues Will Arise as State Builds Block Grants. During the consolidation process, the state would face several significant programmatic and technical issues. Regarding programmatic considerations, the state would need to decide which types of broad services school districts should provide. For example, the state should decide whether K–12 school districts should be responsible for adult schools. The state also would need to decide which types of programs should be consolidated into revenue limits versus a block grant. For example, should alternative education services be funded directly as a separate categorical program or indirectly as part of a disadvantaged student block grant. Other issues would be primarily technical. For instance, some categorical programs (such as child nutrition) reimburse school districts for very specific purposes (purchasing a school breakfast or lunch) and, in these cases, the state would need to decide whether to maintain it as a separate categorical program or instead allow districts to use block grant or revenue limit monies to cover the cost.
As the state develops a refined K–12 finance system, we recommend it align state operations with the new finance system. Below, we provide recommendations for how to better align the mission of the California Department of Education (CDE) with a streamlined, more flexible K–12 finance system.
Move CDE Away From Compliance Monitoring. We recommend redefining the core functions of the CDE to better match a more flexible K–12 finance system. Currently, CDE is focused primarily on ensuring districts comply with various state and federal requirements. For example, prior to categorical flexibility, the CDE was responsible for auditing districts to ensure they met the requirements of all 40 programs in the flex item. Given the state now places fewer programmatic requirements on districts and could reduce them further if broader improvements are made to the K–12 finance system, the CDE’s compliance–oriented mission no longer reflects the state’s approach to education finance.
Refocus Mission on Data, Accountability, and Best Practices. To better align the CDE’s mission with the new K–12 finance system, we recommend focusing the department’s work on data, accountability, and best practices. In return for granting school districts increased flexibility, the state would need to better measure and track educational outcomes. Essentially, going forward, the state would monitor district progress against academic benchmarks rather than compliance requirements. Focusing the CDE’s mission on data, accountability, and best practices would mean the state could do a better job of gauging district progress on outcome measures and, in the event a district is underperforming, provide support and hold it accountable.
To help the Legislature in crafting its 2011–12 education budget, we surveyed school districts to gather information regarding how they were being affected by recent federal and state actions. Most importantly, the survey responses show that many districts: (1) have reserved some federal Ed Jobs for 2011–12; (2) would find an additional deferral in 2011–12 more difficult to accommodate; (3) have benefited notably from existing flexibility provisions and desire additional flexibility; and (4) already have increased class sizes notably, instituted furlough days, laid off some teachers, and shortened the school year. Given these survey findings, we identify several ways the Legislature could provide school districts with more flexibility in the short term. Even with the extra flexibility, however, many underlying problems would remain with California’s system of K–12 finance. Thus, we also provide the Legislature with a relatively simple approach for making more lasting improvements to California’s K–12 finance system.
1. If your district has a strategic plan in place for the 2010–11 school year, please select the three most important objectives of the plan.
|
Most Common Responses
|
|
1. Improve academic achievement for all students
|
|
2. Meet performance targets and accountability benchmarks
|
|
3. Retain teacher jobs
|
|
4. Close the achievement gap
|
|
5. Improve student proficiency in reading
|
2. Roughly what percentage of federal American Recovery and Reinvestment Act funding (including stabilization, Title I, and Individuals with Disabilities Education Act funding) did your district spend in each of the following school years?
|
Response
|
Year
|
|
2008–09
|
2009–10
|
2010–11
|
2011–12
|
|
Unweighted average (by district)
|
10%
|
62%
|
26%
|
2%
|
|
Weighted average (based on total allocation)
|
8
|
63
|
28
|
1
|
3. Roughly what percentage of federal Education Jobs funding is your district spending/planning on spending in each of the following years?
|
Response
|
Year
|
|
2010–11
|
2011–12
|
|
Unweighted average (by district)
|
49%
|
51%
|
|
Weighted average (based on total allocation)
|
33
|
67
|
4. How is your district using these federal funds? Please mark the item or items below that reflect your district’s priorities for using each pot of federal funding.
|
Use of Funds
|
Percent of Respondents
|
|
Job Funds
|
ARRA Funds
|
|
Hire/retain additional teachers
|
77%
|
83%
|
|
Backfill reductions to state categorical programs
|
17
|
47
|
|
Eliminate previously negotiated furlough days
|
14
|
4
|
|
Increase teacher compensation
|
7
|
1
|
|
Eliminate previously negotiated benefits changes
|
6
|
2
|
|
Make one–time purchases of equipment/ supplies/materials
|
4
|
40
|
|
Undertake school facility projects
|
—
|
4
|
|
Other
|
16
|
18
|
5. Prior to the deferral adopted in 2010–11, the state had deferred many other K–12 payments. Please select the item or items below that best reflect how your district is responding to the increase in late payments. Our district is:
|
Response
|
Percent of Respondents
|
|
Drawing down district reserves
|
74%
|
|
Borrowing from our special funds
|
45
|
|
Relying on external borrowing
|
28
|
|
Making cuts because internal and external borrowing options are exhausted or too costly
|
20
|
|
Borrowing from our county treasurer
|
7
|
|
Borrowing from our county office of education
|
4
|
|
Doing something else
|
8
|
6. The 2010–11 state budget package contained a $1.7 billion K–12 payment deferral. Please select the item or items below that best reflect how your district is responding to this new deferral. Our district:
|
Response
|
Percent of Respondents
|
|
Has already included the funds in our 2010–11 budget and is spending the funds throughout the year
|
55%
|
|
Is setting the funds aside until the state has completed its special session budget activities
|
27
|
|
Is reserving the funds for potential use in 2011–12
|
18
|
|
Is doing something else
|
11
|
7. If the state were to do an additional K–12 payment deferral in 2011–12 (on top of all existing deferrals), what would be the likely impact on your district? Please mark the item or items below that best reflect the likely impact. Our district would:
|
Response
|
Percent of Respondents
|
|
Draw down district reserves
|
64%
|
|
Borrow more heavily from our special funds
|
50
|
|
Rely more heavily on external borrowing
|
44
|
|
Make cuts because internal and external borrowing options are exhausted or deemed too costly
|
42
|
|
Borrow more heavily from our county treasurer
|
20
|
|
Borrow more heavily from our county office of education
|
16
|
|
Do something else
|
13
|
8. For each of the following items, please indicate the extent to which the categorical flexibility the state granted in February 2009 has affected your ability to:
|
Activity
|
Percent of Respondents
|
|
Made Easier
|
Made MoreDifficult
|
No Effect/Unsure
|
|
Develop and balance a budget
|
96%
|
3%
|
1%
|
|
Dedicate resources to local education priorities
|
93
|
3
|
4
|
|
Make hiring/layoff decisions
|
84
|
2
|
14
|
|
Fund teacher salaries and benefits
|
79
|
3
|
18
|
|
Develop and implement a strategic plan
|
77
|
2
|
22
|
|
Fund programs for struggling/at–risk students
|
74
|
7
|
19
|
|
Decide how much funding to provide to each school in the district
|
54
|
4
|
42
|
9. For each program listed below, please choose the option that best reflects what your district has done since the state granted categorical flexibility in February 2009. Our district has:
|
Program
|
Percent of Respondents
|
|
Discontinued Program
|
Changed Program in Major Ways
|
Changed Program in Minor Ways
|
Not Changed Program
|
|
High School Class Size Reduction
|
48%
|
27%
|
12%
|
14%
|
|
Community Based English Tutoring
|
27
|
21
|
31
|
21
|
|
Arts and Music Block Grant
|
26
|
26
|
33
|
15
|
|
Peer Assistance and Review
|
22
|
23
|
29
|
26
|
|
Math/English Professional Development Institutes
|
18
|
24
|
39
|
19
|
|
Principal Training
|
18
|
23
|
34
|
25
|
|
School Counseling
|
15
|
35
|
30
|
20
|
|
Professional Development Block Grant
|
15
|
36
|
34
|
16
|
|
Pupil Retention Block Grant
|
14
|
32
|
33
|
20
|
|
School and Library Improvement Block Grant
|
14
|
41
|
31
|
14
|
|
Supplemental Instruction
|
13
|
41
|
35
|
12
|
|
Intern Program/Alternative Certification
|
12
|
14
|
35
|
39
|
|
School Safety Block Grant
|
12
|
31
|
39
|
18
|
|
Gifted and Talented Education
|
11
|
28
|
38
|
22
|
|
Deferred Maintenance
|
11
|
46
|
28
|
15
|
|
Targeted Instructional Improvement Grant
|
11
|
33
|
35
|
21
|
|
California School Age Families Education
|
11
|
19
|
40
|
31
|
|
Community Day Schools
|
10
|
13
|
26
|
51
|
|
Adult Education
|
7
|
39
|
32
|
22
|
|
Beginning Teacher Support and Assistance
|
6
|
15
|
35
|
44
|
|
Supplemental Instruction for Students Failing CAHSEE
|
5
|
28
|
43
|
2
|
|
Instructional Materials
|
4
|
46
|
29
|
20
|
|
Regional Occupational Centers/Programs
|
1
|
15
|
40
|
44
|
10. For each program listed below, please choose the option that best reflects what your district has done since the state granted categorical flexibility in February 2009. Our district has:
|
Program
|
Percent of Respondents
|
|
Shifted Funds Away From the Program
|
Shifted Funds To the Program
|
Made No Change
|
|
High School Class Size Reduction
|
86%
|
1%
|
13%
|
|
School and Library Improvement Block Grant
|
78
|
4
|
19
|
|
Arts and Music Block Grant
|
77
|
5
|
18
|
|
Deferred Maintenance
|
77
|
4
|
20
|
|
Adult Education
|
75
|
4
|
21
|
|
Supplemental Instruction
|
75
|
8
|
18
|
|
Gifted and Talented Education
|
73
|
4
|
23
|
|
Math/English Professional Development Institutes
|
73
|
7
|
20
|
|
Community Based English Tutoring
|
73
|
3
|
24
|
|
Pupil Retention Block Grant
|
72
|
5
|
23
|
|
Professional Development Block Grant
|
71
|
6
|
23
|
|
Peer Assistance and Review
|
70
|
3
|
27
|
|
Targeted Instructional Improvement Grant
|
68
|
5
|
27
|
|
School Counseling
|
68
|
8
|
24
|
|
Instructional Materials
|
67
|
7
|
25
|
|
Principal Training
|
67
|
5
|
28
|
|
School Safety Block Grant
|
67
|
5
|
28
|
|
Supplemental Instruction for Students Failing CAHSEE
|
63
|
7
|
30
|
|
California School Age Families Education
|
58
|
4
|
37
|
|
Intern Program/Alternative Certification
|
57
|
6
|
37
|
|
Beginning Teacher Support and Assistance
|
48
|
4
|
48
|
|
Regional Occupational Centers/Programs
|
35
|
4
|
61
|
|
Community Day Schools
|
32
|
11
|
57
|
11. Looking forward, please indicate the amount of additional flexibility, if any, your district would like for each of the programs listed below.
|
Program
|
Percent of Respondents
|
|
Much More
|
Some
|
None
|
|
K–3 Class Size Reduction
|
86%
|
9%
|
4%
|
|
Economic Impact Aid
|
79
|
19
|
2
|
|
Quality Education Investment Act
|
74
|
17
|
9
|
|
After School Safety and Education
|
71
|
22
|
7
|
|
Apprentice Programs
|
70
|
14
|
16
|
|
Advancement Via Individual Determination
|
65
|
19
|
17
|
|
Partnership Academies
|
64
|
23
|
14
|
|
Child Care/Preschool
|
60
|
23
|
16
|
|
Home–to–School Transportation
|
60
|
20
|
20
|
|
Agriculture Vocational Education
|
55
|
25
|
20
|
|
Child Nutrition
|
48
|
32
|
20
|
12. For each of the mandates listed below, please select the action that best reflects what your district would likely do if the mandate were eliminated.
|
Mandated Activity
|
Percent of Respondents
|
|
Continue to Perform
|
Perform Other Activities That Meet The Same Goal
|
No Longer Perform
|
|
Alert law enforcement when a student commits a crime on campus
|
80%
|
16%
|
4%
|
|
Continue to expel students for offenses previously deemed mandatorily expellable
|
73
|
23
|
4
|
|
Conduct annual evaluations of ineffective or poorly performing teachers
|
70
|
28
|
2
|
|
Notify teachers when a student is expelled
|
70
|
27
|
3
|
|
Attempt to meet with parents when a student is habitually truant
|
70
|
26
|
4
|
|
Ensure students are immunized before entering school for the first time
|
68
|
25
|
7
|
|
Notify parents when a student is truant
|
67
|
30
|
3
|
|
Evaluate teachers on their effectiveness helping students meet academic standards
|
62
|
36
|
2
|
|
Allow students to transfer among schools in the district, provide an appeals process
|
51
|
32
|
17
|
|
Develop and implement pupil promotion and retention policies
|
51
|
42
|
7
|
|
Update each school's comprehensive safety plan
|
39
|
50
|
12
|
|
Provide HIV/AIDS prevention instruction in middle and high school
|
36
|
46
|
18
|
|
Send out annual parent notification by mail
|
32
|
44
|
23
|
|
Administer physical performance tests (Fitnessgram) during middle and high school
|
23
|
47
|
29
|
13. Periodically, the state provides one–time funding to districts to pay for prior–year unpaid mandate claims. (For example, in 2010–11, the state provided a total of about $200 million for this purpose.) Please mark the item or items that best reflect how your district typically uses this funding. Our district:
|
Response
|
Percent of Respondents
|
|
Replenishes our unrestricted reserves
|
69%
|
|
Uses the funds for one–time expenses
|
40
|
|
Uses the funds for teacher salaries
|
6
|
|
Negotiates how best to use the funds with our teachers union
|
2
|
|
Does something else
|
10
|
14. For each of the following years, please estimate how many full–time equivalent teachers your district employed (excluding substitutes).
|
Response
|
Year
|
|
2007–08
|
2008–09
|
2009–10
|
2010–11
|
|
Teachers employed
|
148,042
|
146,236
|
136,095
|
130,009
|
|
Percent change since 2007–08
|
—
|
–1%
|
–8%
|
–12%
|
15. For each of the following years, please estimate how many full–time equivalent teachers your district laid off as part of a “Reduction in Force” process.
|
Response
|
Year
|
|
2008–09
|
2009–10
|
2010–11
|
|
Teachers laid off each year
|
3,452
|
4,300
|
3,175
|
|
Percent of prior–year teacher workforce
|
2.3%
|
2.9%
|
2.3%
|
16. For each of the following years, please mark the item or items below that best reflect the changes your district made to its teacher contract. Our district:
|
Change Made
|
Percent of Respondents
|
|
2008–09
|
2009–10
|
2010–11
|
|
Provided no cost–of–living adjustment
|
80%
|
88%
|
86%
|
|
Instituted furlough days for teachers
|
4
|
29
|
51
|
|
Negotiated higher class size maximums compared to prior year
|
9
|
33
|
44
|
|
Reduced health benefits for teachers compared to prior year
|
7
|
13
|
17
|
|
Provided no step–and–column salary increases
|
3
|
6
|
6
|
|
Reduced retirement benefits for new teachers
|
1
|
1
|
3
|
|
Took away certain vacation days
|
1
|
2
|
3
|
|
Other
|
6
|
8
|
12
|
17. If your district instituted furlough days for teachers, please indicate the number of furlough days instituted in 2009–10 and/or 2010–11.
|
Response
|
Year
|
|
2009–10
|
2010–11
|
|
Average number of furlough days
|
1
|
3
|
|
Average weighted by teachers per district
|
2
|
5
|
18. If your district increased maximum class sizes in your teacher contract, please indicate the average maximum class size negotiated in each of the following years.
|
Grade
|
Year
|
|
2008–09
|
2009–10
|
2010–11
|
|
Kindergarten
|
21
|
23
|
25
|
|
First grade
|
20
|
22
|
25
|
|
Second grade
|
20
|
22
|
25
|
|
Third grade
|
21
|
23
|
25
|
|
Other grades
|
28
|
28
|
31 or more
|
19. For each of the following years, please indicate the number of instructional days provided in your district.
|
Number of Instructional Days
|
Percent of Respondents
|
|
2008–09
|
2009–10
|
2010–11
|
|
180
|
100%
|
81%
|
43%
|
|
178–179
|
—
|
10
|
11
|
|
176–177
|
—
|
4
|
17
|
|
175
|
—
|
5
|
30
|