LAO 2010-11 Budget: Higher Education Table of Contents
February 25, 2010
The Governor portrays his 2010-11 budget proposal as protecting education from additional deep cuts. Nonetheless, the administration’s budget plan would affect areas of education quite differently. Under the Governor’s plan, Proposition 98 support for K-12 education would be cut from current-year levels by $1.9 billion, and total funding for child care and development programs would be cut slightly more than $300 million. In contrast, higher education mainly receives augmentations, with state funding for the California Community Colleges (CCC) increasing by $200 million, and funding for the California State University (CSU) and University of California (UC) increasing by about $800 million combined.
Differences Magnified When Put in Terms of Per-Student Funding. The figure below compares programmatic funding across areas of education from 2007-08 (actual) through 2010-11 (proposed). As reflected in the figure, some areas of education would be affected differently than other areas under the Governor’s proposal. From 2007-08 levels, programmatic funding would decline almost 3 percent per child care slot, more than 10 percent per K-12 student, and almost 5 percent per budgeted CCC student. (Programmatic CCC funding would decline roughly 10 percent based on actual student counts.) By comparison, programmatic funding (including fee revenue) would increase by almost 4 percent per budgeted CSU student and more than 5 percent per UC student.
Programmatic Per-Student Funding by Education Areaa
|
|
2007-08
|
2008-09
|
2009-10
|
2010-11
|
Change From
2007-08 to 2010-11
|
|
Child care and development (CCD)
|
$6,914
|
$7,312
|
$7,113
|
$6,733
|
-2.6%
|
|
K-12 education
|
8,364
|
8,423
|
7,957
|
7,417
|
-11.3
|
|
California Community Colleges (CCC)
|
5,591
|
5,499
|
5,376
|
5,321
|
-4.8
|
|
California State University (CSU)
|
11,289
|
9,842
|
11,614
|
11,722
|
3.8
|
|
University of California (UC)
|
21,778
|
18,054
|
20,641
|
22,920
|
5.2
|
Building a More Balanced Education Budget. These comparisons offer one perspective on the relative impact of the Governor’s proposals across areas of education, but the Legislature will want to consider various other factors as it develops its education budget. Most importantly, the different populations, needs, programmatic quality, and public benefits of these different education areas should be considered. In an attempt to weigh all these factors, we provide the Legislature with alternatives to the Governor’s education budget proposal. Our proposal makes more modest cuts for child care programs (about $100 million less than the Governor); makes approximately $800 million in targeted cuts to K-12 education, with additional K-12 cuts, as needed, coming from general purpose and/or categorical funding; and raises CCC fees to provide additional funding for community colleges. Our proposal would reduce the proposed augmentations for UC and CSU, while still restoring their per-student funding rates to 2007-08 levels.
Higher Education Budget Recommendations. In this report, we offer the following recommendations to the Legislature:
-
Universities—Restore 2007-08 Funding Rates. We recommend the Legislature restore total funding per university student to the amounts provided in 2007-08. Our suggested enrollment levels at this funding rate would augment universities’ budgets considerably but still save $298 million compared to the Governor’s budget.
-
Community Colleges—Augment Funding With Fees. The Governor’s budget provides an augmentation for CCC enrollment and a reduction for a negative cost-of-living adjustment. We recommend the Legislature reject this reduction. We also recommend that this funding restoration, as well as the enrollment augmentation, be funded from an increase in student fees from $26 per unit to $40 per unit. Such an approach would take better advantage of federal dollars available for students.
-
Protect Cal Grants.
The Governor proposes to suspend new competitive Cal Grants starting in 2010-11. We recommend the Legislature reject this proposal, and offer several alternatives to achieve similar General Fund savings that would do less harm to the state’s financial aid framework.
K-12 Recommendations in Companion Publication. Our analysis of the Governor’s K-12 budget proposals—as well as the Proposition 98 funding requirements more broadly—are discussed in our companion publication, The 2010-11 Budget: Proposition 98 and K-12 Education. Major recommendations include:
-
Consider Alternative Courses of Action for Proposition 98. We offer two alternatives: suspending Proposition 98, and meeting the minimum funding guarantee through increased revenues or spending cuts in other areas.
-
Use Multiple Budget Strategies for K-12 Education. We offer an alternative to the Governor’s proposal that identifies additional ways to reduce state and local costs, expands flexibility for schools, includes comprehensive mandate reform, aligns existing programs, and seeks new federal aid.
The Governor’s budget proposal includes $10.9 billion in General Fund support for higher education in 2010-11. This is about 12 percent more than the estimated funding level for the current year. The higher education budget includes funding for the University of California (UC), the California State University (CSU), the California Community Colleges (CCC), Hastings College of the Law, the California Student Aid Commission (CSAC), and the California Postsecondary Education Commission.
General Fund Support. In presenting his budget proposal to the Legislature, the Governor asserted that he is seeking “even greater reductions in nearly every aspect of state government than were necessary in 2009.” The major exception is education programs, which he proposes to exempt “from additional deep cuts.” (See nearby box on Governor’s proposed constitutional amendment to guarantee that key segments of higher education receive at least 10 percent of total General Fund spending.) This is illustrated in Figure 1, which shows that all higher education segments and agencies would receive net increases in General Fund support. When all these augmentations are combined, General Fund support for higher education would be $1.2 billion, or 11.9 percent, higher than the revised current-year amount.
Figure 1
Higher Education Core Funding (Per Governor’s 2010–11 Budget Proposal)
(Selected Core Funds, in Millions)
|
|
2007–08Actual
|
2008–09Actual
|
2009–10Estimated
|
2010–11Proposed
|
|
University of California (UC)
|
|
General Fund
|
$3,257.4
|
$2,418.3
|
$2,596.1
|
$3,018.6
|
|
Feesa
|
1,064.6
|
1,114.5
|
1,370.7
|
1,794.0
|
|
ARRAb
|
—
|
716.5
|
—
|
—
|
|
Lottery
|
25.5
|
24.9
|
28.1
|
26.7
|
|
Totals
|
$4,347.5
|
$4,274.3
|
$3,994.8
|
$4,839.4
|
|
California State University (CSU)
|
|
General Fund
|
$2,970.6
|
$2,155.3
|
$2,350.1
|
$2,723.4
|
|
Feesa
|
900.3
|
1,092.1
|
1,158.1
|
1,260.5
|
|
ARRAb
|
—
|
716.5
|
—
|
—
|
|
Lottery
|
58.1
|
42.1
|
45.8
|
43.6
|
|
Totals
|
$3,929.1
|
$4,005.9
|
$3,554.0
|
$4,027.5
|
|
California Community Colleges
|
|
General Fund
|
$4,170.3
|
$3,944.1
|
$3,734.4
|
$3,991.1
|
|
Fees
|
291.3
|
302.7
|
357.3
|
365.2
|
|
Local property taxes
|
1,970.7
|
2,010.7
|
1,953.2
|
1,913.3
|
|
ARRA
|
—
|
—
|
35.0
|
—
|
|
Lottery
|
168.7
|
151.3
|
160.8
|
153.2
|
|
Totals
|
$6,601.0
|
$6,408.8
|
$6,240.7
|
$6,422.8
|
|
Hastings College of the Law
|
|
General Fund
|
$10.6
|
$10.1
|
$8.3
|
$8.4
|
|
Feesa
|
21.6
|
26.6
|
30.6
|
35.7
|
|
Lottery
|
0.1
|
0.1
|
0.2
|
0.2
|
|
Totals
|
$32.4
|
$36.9
|
$39.1
|
$44.2
|
|
California Postsecondary Education Commission
|
|
General Fund
|
$2.1
|
$2.0
|
$1.8
|
$2.0
|
|
California Student Aid Commission
|
|
General Fund
|
$866.7
|
$888.3
|
$1,008.9
|
$1,110.2
|
|
SLOFc
|
94.9
|
117.3
|
124.3
|
92.3
|
|
Totals
|
$961.6
|
$1,005.6
|
$1,133.1
|
$1,202.5
|
|
Grand Totals
|
$15,873.6
|
$15,733.4
|
$14,963.6
|
$16,538.4
|
|
General Fund
|
$11,277.7
|
$9,418.0
|
$9,699.4
|
$10,853.7
|
|
Fees
|
2,277.8
|
2,536.0
|
2,916.8
|
3,455.4
|
|
ARRA
|
—
|
1,433.0
|
35.0
|
—
|
|
Local Property Taxes
|
1,970.7
|
2,010.7
|
1,953.2
|
1,913.3
|
|
SLOFc
|
94.9
|
117.3
|
124.3
|
92.3
|
|
Lottery
|
252.4
|
218.4
|
234.8
|
223.7
|
The figure also shows annual funding levels back to 2007-08, which can be considered the last fairly typical year for higher education funding. (The 2008-09 and 2009-10 budgets were complicated with retroactive reductions, backfills with federal stimulus revenue, new funding deferrals, unallocated reductions, midyear funding cuts, and other budget solutions that make it difficult to determine meaningful, programmatic funding levels for those years.) As shown in the figure, higher education received about $11.3 billion in General Fund support in 2007-08, which is $424 million more than it would receive in 2010-11 under the Governor’s proposal. However, as described below, this does not tell the whole story.
|
As part of his budget package, the Governor proposes a constitutional amendment that, beginning in 2014-15, would require at least 10 percent of annual state General Fund support to be spent on the University of California, the California State University, and the state’s Cal Grant program. (An earlier version of the Governor’s proposal only indicated the universities.) This would represent a substantial increase in funding for these purposes, which together currently receive about 7 percent of General Fund support. The amendment would also require that no more than 7 percent of General Fund expenditures go to state corrections. (Corrections currently receives about 9.5 percent of General Fund spending.)
We recommend that the Legislature reject this proposal for several reasons:
-
The proposed spending floor, based only on General Fund support, fails to capture the state’s commitment to higher education spending. For example, it ignores student fee revenues, which are a key source of financing for the universities’ basic instructional programs.
-
The proposal excludes spending in California Community Colleges. As a result, the measure would make coherent budgeting for higher education more difficult.
-
The measure implicitly suggests that there is a linkage of crucial budgetary significance between prisons and some higher education programs, and inappropriately pits the two program areas against each other. This is not what budgeting is about. Each year, the Legislature must make decisions among all programs, choosing where best to direct resources.
-
The spending floor for the higher education programs (like the spending cap for prisons) is arbitrary. It would require a significant increase in state spending without any requirement that this funding be used to provide any particular public benefit.
-
The measure is unnecessary, as the state already can shift funding between corrections and higher education in the regular budget process. A constitutional provision imposing these floors and ceilings on spending in different sectors would simply limit budget options, rather than permit new ones.
We provide a fuller analysis of this proposal in our policy brief, Prisons vs. Universities Proposal Would Unwisely Lock Up Budget Flexibility (January 26, 2010). |
Total Core Funding. The state General Fund is not the only major source of funding for higher education. Core funding is also provided by student fee revenue, local property taxes, state lottery funds, and, in recent years, the Student Loan Operating Fund and federal stimulus funds. Combining all core fund sources provides a clearer picture of the amount of resources available to support higher education programs. As shown in Figure 1, total core funding for higher education would increase by about 10.5 percent between the current year and the budget year. Compared to 2007-08, core funding for higher education would grow from $15.9 billion to $16.5 billion, or about 4.2 percent. This is roughly equivalent to the effect of inflation over the same period.
Major Augmentations for UC and CSU. As shown in Figure 1, the two university systems would receive General Fund increases above current-year amounts of roughly 16 percent each: $423 million for UC and $373 million for CSU. These increases primarily consist of augmentations to (1) restore earlier General Fund reductions and (2) provide new funding for enrollment. (The augmentations for enrollment are included on the Governor’s “trigger list” of spending that would be eliminated if the level of federal funding assumed in his budget did not materialize.)
In addition to these General Fund augmentations, UC and CSU would receive more than a half-billion dollars in new core funding as the result of student fee increases. Specifically, UC’s and CSU’s fee revenue would increase by $423 million and $102 million, respectively. When all core funds are combined, UC’s and CSU’s general-purpose funding would increase by 21 percent and 13 percent, respectively.
Modest Increase for CCC. The community colleges are subject to Proposition 98, which specifies a minimum funding level each year that they and K-12 schools combined are to receive from state General Fund appropriations and local property tax revenue. Under the Governor’s proposal, CCC would receive $5.9 billion in Proposition 98 support, which is $219 million (3.9 percent) more than the revised current-year amount. However, most of this augmentation is intended to cover “deferred” costs that were incurred in the current year. After adjusting for this deferral, CCC’s programmatic increase in Proposition 98 funding amounts to $56 million. The Governor proposes no fee increase for CCC students, who would continue to pay $26 per unit.
Mixed Bag for Financial Aid Programs. The CSAC administers the Cal Grant programs, which generally provide fee coverage for financially needy students. Under the Governor’s proposal, CSAC’s General Fund support would increase by $101 million (10 percent). This is primarily the result of (1) a $132 million augmentation to fully fund the Cal Grant entitlement program (whose costs increase with UC’s and CSU’s planned fee increases) and (2) a $45.5 million reduction for the Cal Grant competitive program (which under the Governor’s proposal would issue no new awards in 2010-11). In addition, the Governor places another $79 million of Cal Grant funding (primarily from decoupling award amounts from fee levels) on his trigger list of spending reductions if federal funding falls short of his assumptions.
“Growth” Not Based on Actual Enrollment. For all three segments, the Governor’s budget includes augmentations designated for enrollment growth. However, these growth calculations are built upon estimates of current-year “funded” enrollment—not actual enrollment. The Governor’s estimates are far lower than actual enrollment in the current year.
2010-11 Enrollment Targets Lower Than Current Levels. Based on his approach to current-year funded enrollment, the Governor sets 2010-11 enrollment targets for the three segments. These targets are lower than current-year actual levels. If the three segments met the Governor’s proposed enrollment targets, they would serve an estimated 114,000 fewer full-time equivalent (FTE) students than they are serving in the current year. Recent student enrollment trends, as well as the Governor’s assumptions for 2010-11, are shown in Figure 2.
Figure 2
Higher Education Enrollment
(Full-Time Equivalent Students)
|
|
2007-08
|
2008-09 Actual
|
2009-10 Estimated
|
2010-11 Proposed
|
Change
2009-10 to 2010-11
|
|
Budgeted
|
Actual
|
Amount
|
Percent
|
|
UC
|
|
|
|
|
|
|
|
|
Undergraduate
|
160,824
|
166,206
|
172,142
|
173,590
|
170,161
|
-3,429
|
-2.0%
|
|
Graduate
|
25,400
|
24,556
|
24,967
|
25,625
|
26,874
|
1,249
|
4.9
|
|
Health Sciences
|
12,231
|
13,144
|
13,449
|
13,673
|
12,941
|
-732
|
-5.4
|
|
Subtotals
|
(198,455)
|
(203,906)
|
(210,558)
|
(212,888)
|
(209,976)
|
(-2,912)
|
(-1.4%)
|
|
CSU
|
|
|
|
|
|
|
|
|
Undergraduate
|
294,242
|
304,729
|
307,872
|
293,634
|
292,919
|
-715
|
-0.2%
|
|
Graduate/post baccalaureate
|
48,651
|
49,185
|
49,351
|
47,009
|
46,954
|
-55
|
-0.1
|
|
Subtotals
|
(342,893)
|
(353,914)
|
(357,223)
|
(340,643)
|
(339,873)
|
(-770)
|
(-0.2%)
|
|
CCC
|
1,169,606
|
1,182,627
|
1,260,497
|
1,298,300
|
1,188,129
|
-110,171
|
-8.5%
|
|
Hastings College of the Law
|
1,250
|
1,262
|
1,291
|
1,335
|
1,315
|
-20
|
-1.5%
|
|
Totals
|
1,712,204
|
1,741,709
|
1,829,569
|
1,853,166
|
1,739,293
|
-113,873
|
-6.1%
|
Figure 3 shows past, current, and proposed annual student fees at the public colleges and universities. Undergraduate fees at UC would increase by 23 percent (due to an approved 15 percent increase for 2010-11, as well as the annualization of a midyear increase imposed in the current year). The Governor also assumes that CSU will increase its undergraduate fees by 10 percent. No fee increase is proposed for the community colleges.
Figure 3
Annual Education Fees for Full-Time Resident Students
2007-08 Through 2010-11
|
|
|
|
|
2010-11
Proposed
|
Change
2009-10 to 2010-11
|
|
|
2007-08
|
2008-09
|
2009-10
|
Amount
|
Percent
|
|
University of California
|
|
|
|
|
|
|
|
Undergraduate
|
$6,636
|
$7,126
|
$8,373
|
$10,302
|
$1,929
|
23.0%
|
|
Graduate
|
7,440
|
7,986
|
8,847
|
10,302
|
1,455
|
16.4
|
|
Hastings College of the Law
|
$21,303
|
$26,003
|
$29,383
|
$36,000
|
$6,617
|
22.5%
|
|
California State University
|
|
|
|
|
|
|
|
Undergraduate
|
$2,772
|
$3,048
|
$4,026
|
$4,429
|
$403
|
10.0%
|
|
Teacher Credential
|
3,216
|
3,540
|
4,674
|
5,141
|
467
|
10.0
|
|
Graduate
|
3,414
|
3,756
|
4,962
|
5,458
|
496
|
10.0
|
|
Doctoral
|
7,380
|
7,926
|
8,676
|
9,544
|
868
|
10.0
|
|
California Community Colleges
|
$600
|
$600
|
$780
|
$780
|
—
|
—
|
In recent years, confusion has surrounded the question of how the budget crisis has affected higher education budgets. To a large extent, this confusion results from different characterizations that focus on different funding sources, or which use different baselines for their comparisons. There is no single correct way to describe higher education funding. However, in this section we explain what we consider to be the most relevant facets of changes to this funding since 2007-08. That year is considered by most to be the last fairly “normal” year for higher education funding—enrollment growth and cost-of-living increases were funded at all three segments, no large unallocated reductions were imposed, and no payments for new costs were deferred to future years.
As shown in Figure 4, General Fund support for higher education has declined by about $1.6 billion, or 14 percent, since 2007-08. The majority of this reduction was absorbed by the state’s public universities, whose General Fund support declined roughly 20 percent over this period. State funding for student financial aid is a notable exception to the theme of higher education reductions, increasing by $142 million, or 16 percent, since 2007-08.
Figure 4
General Fund Support for Higher Education Has Declined
(Dollars in Millions)
|
|
2007-08
|
2008-09
|
2009-10
|
Change From 2007-08
|
|
Amount
|
Percent
|
|
Universities
|
$6,228
|
$4,574
|
$4,946
|
-$1,282
|
-21%
|
|
CCC
|
4,170
|
3,944
|
3,734
|
-436
|
-10
|
|
Cal Grants
|
867
|
888
|
1,009
|
142
|
16
|
|
Other
|
13
|
12
|
10
|
-3
|
-21
|
|
Totals
|
$11,278
|
$9,418
|
$9,699
|
-$1,578
|
-14%
|
Simply looking at state General Fund support can be misleading for purposes of understanding trends in programmatic support for higher education. Other sources of funding work in combination with General Fund revenues to support core higher education programs. In fact, if the other sources (primarily fee revenue, local property taxes, and federal stimulus funding) are also considered, the 14-percent decline in higher education support noted above would drop to about 5 percent. Below, we provide a fuller description of the impact of recent budgets upon the higher education segments and programs.
Figure 5 shows major funding changes for UC and CSU since 2007-08.
General Fund. As shown in the figure, state General Fund support for UC and CSU declines by about $660 million and $620 million, respectively, between 2007-08 and the current year. This reflects a reduction of about 20 percent each.
Student Fee Revenue. The figure shows increasing fee revenue, which is the result of fee increases imposed each year. This fee revenue supports general costs at the universities and is interchangeable with General Fund support. As shown in the figure, UC’s fee revenue increased by about $300 million between 2007-08 and the current year. The CSU’s fee revenue increased by about $260 million. These amounts do not include the portion of fee revenue that is redirected to campus-based financial aid.
Federal Stimulus Funding. In 2009, the two university systems each received $716.5 million in federal funding through the American Recovery and Reinvestment Act (ARRA). This one-time funding is intended to help compensate the universities for General Fund reductions that were imposed as a result of the state’s fiscal crisis. The funding is almost identical to one-time 2008-09 General Fund reductions that were imposed on the universities retroactively as part of the 2009-10 budget package. For this reason, the General Fund reductions and ARRA funding can be viewed as canceling each other out in 2008-09.
Bottom Line. When all the above funding changes are combined, it is clear that UC and CSU experienced almost no net change in general-purpose funding between 2007-08 and 2008-09. For 2009-10, UC and CSU experienced net reductions of roughly $350 million each (8 percent and 9 percent, respectively) from their 2007-08 levels.
Growth and Cost-of-Living Adjustment (COLA) Provided in 2007-08. As with the universities, community colleges last received fairly standard workload and cost adjustments in 2007-08. In that year, the budget provided CCC with $263 million to fund a 4.5 percent base increase (following the same statutory formula used to calculate the K-12 COLA), and $114 million to fund new enrollment growth of 2 percent. (As discussed later in the “Enrollment and Access” section of this report, the budget also reduced CCC’s base enrollment funding by $80 million to account for enrollment declines occurring a few years earlier that left many slots unfilled.) Although the CCC system received about $90 million less in local property tax revenue than assumed in the 2007-08 Budget Act, the state ultimately backfilled most (about $75 million) of that shortfall, thereby largely mitigating the programmatic impact on CCC that year.
CCC Largely Spared From Base Reductions in 2008-09. As illustrated in Figure 6, net programmatic funding for CCC in 2008-09 increased slightly compared to 2007-08 levels. While the CCC system did not receive a COLA, it received additional funding for 2 percent enrollment growth. As discussed in the “Enrollment and Access” section of this report, though, student demand for classes significantly outpaced enrollment growth funding. In addition, CCC experienced another local property tax shortfall (totaling $47 million), none of which was backfilled by the state. Acknowledging these resource constraints, the Legislature opted not to reduce CCC’s general-purpose “apportionment” funding. Instead, it achieved General Fund savings for 2008-09 by simply postponing (“deferring”) $340 million in CCC’s apportionment payments by several months, into the 2009-10 fiscal year. Thus, while community colleges incurred costs for certain programs and services in 2008-09, they did not receive these payments until early 2009-10. The Legislature also made no reductions to programmatic funding for any of CCC’s categorical programs (which are earmarked for specific purposes).
Figure 6
Community College “Programmatic” Fundinga
(Dollars in Millions)
|
|
2007-08
Final
|
2008-09
Revised
|
2009-10
Revised
|
Change From 2007-08
|
|
Amount
|
Percent
|
|
Proposition 98
|
$6,112.8
|
$5,928.6
|
$5,675.1
|
-$437.7
|
-7.2%
|
|
New deferralsb
|
—
|
340.0
|
163.0
|
163.0
|
—
|
|
Subtotals, Proposition 98 Programmatic
|
($6,112.8)
|
($6,268.6)
|
($5,838.1)
|
(-$274.7)
|
(-4.5%)
|
|
Proposition 98 Reversion Account
|
$19.1
|
—
|
$5.0
|
-$14.1
|
-73.9%
|
|
One-time backfillsc
|
74.9
|
—
|
—
|
-74.9
|
-100.0
|
|
Quality Education Investment Act
|
32.0
|
$48.0
|
—d
|
-32.0
|
-100.0
|
|
Oil and mineral
|
9.2
|
10.8
|
9.2
|
—
|
—
|
|
Federal stimulus funds
|
—
|
—
|
35.0
|
35.0
|
—
|
|
Student fees
|
291.3
|
302.7
|
357.3
|
66.0
|
22.7
|
|
Totals
|
$6,539.3
|
$6,630.1
|
$6,244.7
|
-$294.7
|
-4.5%
|
Proposition 98 Reductions in 2009-10... The 2009-10 Budget Act, by contrast, included significant reductions to CCC’s apportionment and categorical-program base budgets. For example, the budget imposed an unallocated reduction of $130 million (about 2 percent) for apportionments. Community college apportionments were further reduced by a local property tax shortfall, which, after accounting for a partial backfill of General Fund monies, is currently estimated to be approximately $50 million. The budget package also deferred an additional $163 million in apportionment payments from 2009-10 to 2010-11. (This brings total interyear deferrals to $703 million when combined with the $340 million from 2008-09 and a $200 million deferral from 2003-04.)
The budget also reduced General Fund support for categorical programs by a total of $263 million (about 37 percent) compared with 2008-09 levels. Ten of CCC’s 21 categorical programs received base cuts of 50 percent of more, with 8 other programs cut between 30 percent and roughly 40 percent. As discussed later in the “Categorical Flexibility” section, 12 of CCC’s categoricals were moved to a “flex item” to improve colleges’ ability to contend with the cuts.
…Partially Mitigated by New Revenues From Fees and Federal Funds. These Proposition 98 reductions were partially offset by additional funds from two sources. First, the 2009-10 budget package increased CCC enrollment fees from $20 to $26 per unit, which restored student fees back to their 2006 level. These higher fees are estimated to generate an additional $80 million in revenue that will mitigate the impact of reduced state support for apportionments. (Lower- and middle-income students are largely shielded from the fee increase by CCC’s fee waiver program and recently expanded federal tax credits.)
Second, the community colleges received $35 million in federal stimulus funding in 2009-10, which they can use to backfill cuts to apportionments or categorical programs. (The 2009-10 Budget Act had originally assumed that the CCC system would receive $130 million.) Figure 6 shows that, after accounting for these new fee and federal monies, the net programmatic reduction for CCC in 2009-10 totals about $385 million, or 5.8 percent, compared with 2008-09.
Bottom Line. Like UC and CSU, CCC was largely spared from significant funding reductions in 2008-09, but was subject to reductions in 2009-10. Over the two-year period, CCC’s Proposition 98 funding declined by $438 million, or 7.2 percent. However, after adjusting for deferrals and other funding sources, CCC’s programmatic funding declined by $295 million, or 4.5 percent.
Augmentations Cover Higher Grant Costs. Since the inception of the Cal Grant entitlement and competitive programs in 2000, annual augmentations have been provided to cover increased participation in all segments and fee increases at the universities. (Fees at community colleges are covered by a separate fee waiver program.) From 2007-08 to 2009-10, General Fund support was increased by a total of $147 million to cover these Cal Grant costs, as shown in Figure 7. Proceeds from the student loan program provided an additional $24 million in 2008-09 and $32 million in 2009-10 toward Cal Grant funding—bringing the two-year increase in total funding to about 20 percent. Participation in the programs has remained relatively stable for the past three years. Most of the cost increases are due to higher fees—which drive up the cost of the program for each student served.
Figure 7
General Fund Support for California Student Aid Commission
(In Millions)
|
|
Actual
2007-08
|
Actual
2008-09
|
Estimated
2009-10
|
Change From 2007-08
|
|
Amount
|
Percent
|
|
Grant Aid Programs
|
$851.7
|
$877.4
|
$999.0
|
$147.3
|
17.3%
|
|
State Operations
|
13.6
|
10.8
|
9.8
|
-3.7
|
-27.4
|
|
Totals
|
$865.2
|
$888.3
|
$1,008.9
|
$143.6
|
16.6%
|
Funding for Program Administration Cut. The figure also shows that support for the commission’s operations declined by more than 25 percent over the same period. The commission has absorbed these reductions by a combination of improvements in automation and lower levels of service, such as reduced customer service call center hours.
Prior to the recession, the Legislature and Governor typically provided General Fund support in the annual budget act to support a specific number of students at the two university segments. The segments typically serve slightly more or fewer FTE students than budgeted because enrollment is difficult to manage with precision. The number of eligible applicants to the UC and CSU fluctuates from year to year depending upon a number of factors including population growth, demographic changes, economic conditions, and student preferences. Under the state Master Plan, all eligible applicants are guaranteed admission to some campus within the university system to which they apply. Each year, the state and the segments take steps to manage the number of students who attend because funding and campuses’ physical capacity in any given year are limited. Some examples of these enrollment management techniques include adjusting application deadlines and restricting lower division transfers.
Enrollment Growth Funding Last Provided in 2007-08. The last time the state budget specified enrollment levels for UC and CSU was in 2007-08. In that year, both segments received augmentations for 2.5 percent enrollment growth, bringing their budgeted enrollment levels to 198,455 FTE students at UC and 342,893 FTE students at CSU. However, UC enrolled approximately 5,400 more students than budgeted and CSU enrolled approximately 11,000 more students than budgeted. This over-enrollment was unusually high compared to previous years, suggesting that the number of eligible applicants choosing to enroll was higher than usual or that campuses did not effectively manage their enrollment levels.
No Enrollment Targets Set for UC and CSU in the Last Two Budgets. In a departure from past practice, the 2008-09 Budget Act and 2009-10 Budget Act did not include explicit augmentations for enrollment growth and did not specify enrollment targets for UC and CSU. Instead, the segments were given the discretion to manage their own enrollment levels for both years in order to provide flexibility for responding to unallocated General Fund reductions. The estimated actual enrollment levels over this time period for UC and CSU are shown in Figure 8.
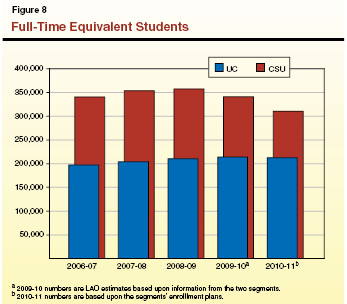
UC Enrollment Growth Slows. For 2008-09, UC decided to raise its total enrollment by about 5,000 FTE students, or 2.5 percent. However, actual enrollment exceeded this target by approximately 1,600 FTE students. For 2009-10, UC adopted a policy to decrease freshman enrollment by approximately 2,300 FTE students, increase transfer enrollment by approximately 500 FTE students, and maintain graduate enrollment at the previous year’s level. Even with the decrease in freshman enrollment, UC expected its overall enrollment would increase about 1.5 percent in 2009-10 due to increased transfer enrollment and because the incoming freshman class would still be larger than the outgoing graduating class. In January 2010, UC reported that it had generally achieved its targeted enrollment reductions for freshmen.
CSU Enrollment Begins to Decline. For 2008-09, CSU attempted to manage enrollment levels closer to the 2007-08 budgeted level by moving fall 2008 application deadlines earlier. Despite this effort, CSU’s enrollment still increased by approximately 3,300 FTE students in 2008-09. For 2009-10, CSU implemented more aggressive enrollment management strategies and estimates a decrease in enrollment of 16,500 FTE students (4.6 percent) compared to the previous year.
Both UC and CSU have reduced enrollment for new students in recent years and plan to make further reductions in the budget year. Yet the proposed enrollment plans would still abide by the Master Plan’s guarantee that all eligible students who meet application deadlines would be able to attend at least one campus within that university system. Of course, this does not mean that students applying to the universities are unaffected by the enrollment reductions. Some students, for example, may find it more difficult to enroll in the campus or major that is their first choice. The segments are also imposing stricter requirements for meeting application deadlines, verifying eligibility, and completing prerequisites.
Changes at UC. As in previous years, UC would continue to guarantee admission to one of its campuses if an applicant meets the system’s minimum eligibility criteria through a redirection policy—if an eligible student applies to a more competitive campus and does not meet that campus’ higher criteria, the student would instead receive an offer of admission to a campus with lower admittance criteria (usually UC Merced or Riverside). This can reduce systemwide enrollment because many students will pursue other opportunities rather than attend a UC campus that is not one of their top choices. In order to reduce freshman enrollment in 2009-10 and the budget year, UC is redirecting more students than in the past. The UC has also announced that it will use a waiting list for the first time in 2010-11. Numerous universities throughout the country use waiting lists to ensure that campuses are not too far above or below their enrollment targets.
Changes at CSU. The CSU has implemented more significant changes to its enrollment procedures as it has sought to reduce enrollment over the last few years. Unlike UC, CSU does not redirect students to campuses with available space. Instead, CSU has historically guaranteed that eligible applicants have access to their regional campus if they apply by the priority deadline. However, eligible students might not be admitted to some campuses outside of their region since those campuses could use stricter criteria for reviewing applications from nonlocal students. This local admissions guarantee applies to most applicants with a few exceptions:
-
Impacted Majors. High-demand programs that are declared impacted are exempt from the local admissions guarantee. Impacted majors have higher admissions criteria for all applicants including local-area applicants. This means that a local applicant meeting the minimum systemwide eligibility criteria could still enroll at the campus, but would be precluded from certain majors.
-
San Diego State University. San Diego State recently declared all of its majors impacted for fall 2010. This means that all applicants are required to meet higher criteria for admission. Although the campus plans to provide some preferential treatment for local applicants, it will not provide a local guarantee. As a result, this policy is likely to mean that some eligible local applicants are denied admission. These students could still attend one of the less popular CSU campuses that does not have higher admissions criteria for nonlocal students. However, because CSU does not practice redirection, the student would need to apply to the alternate campus and be able to attend college outside of their region.
Another change implemented to reduce enrollment that affects CSU applicants is that almost all campuses stopped accepting applications after November 30—a departure from a recent practice of extending application deadlines into the spring or summer. The CSU also closed spring admissions in 2010, requiring some eligible students—mostly transfer students, since first-time freshmen usually enter during the fall—to delay plans to enroll until fall 2010.
Some Changes Are Not Tied to Financial Situation. It is worth noting that some aspects of the segments’ enrollment reduction plans would make sense even without the current funding shortfalls. For example, campuses have been directed to make acceptance offers contingent on satisfactory completion of high school work in progress; accept transfer students only if they meet minimum requirements; and require continuing students to maintain good academic standing. Each of these policies uphold academic standards the universities should promote regardless of the state’s budget situation.
For 2010-11, the Governor proposes an augmentation totaling $112 million to fund an additional 2.5 percent enrollment at UC and CSU. Under the Governor’s marginal cost methodology, the augmentation would provide $51.3 million for 5,121 FTE students at UC and $60.6 million for 8,290 FTE students at CSU. Under the Governor’s plan, the augmentation for enrollment growth would be one of the items cut as part of the trigger mechanism if the federal funds sought by the administration do not materialize.
The Governor also proposes new enrollment targets for both segments. These targets were determined in two steps: First, the administration estimated the number of students it assumes the universities would have funding to serve in 2010-11 after current-year, one-time reductions are restored. Second, the Governor added 2.5 percent enrollment growth for new budgeted enrollment levels of 209,977 FTE students at UC and 339,873 FTE students at CSU. These levels are less than current-year enrollment for both segments.
Both segments have adopted plans to reduce the number of new students they admit in 2010-11. At the time this report was prepared, UC planned to curtail freshman enrollment by 1,500 FTE in 2010-11—on top of the 2,300 FTE reduction in 2009-10. In addition, UC plans another modest expansion of transfer enrollment with an increase of 500 FTE students.
The CSU has adopted a plan to reduce its enrollment by approximately 30,000 FTE students in the budget year. This would represent a reduction of approximately 9 percent from current-year levels, and a two-year decrease of 13 percent (almost 47,000 FTE students). Similar to UC, CSU indicated the reduction could be less severe if augmentations—such as those provided in the Governor’s budget—are provided, but that it still expects to reduce enrollment compared to the current year.
In our view, providing enrollment growth funding for the universities in the budget year does not make sense because neither UC nor CSU would actually enroll more students. In fact, the Governor’s proposed enrollment levels, as well as the segments’ own plans, call for reduced enrollment in 2010-11 (see Figure 9). For this reason, we recommend that the Legislature reject the Governor’s proposal to provide $112 million for enrollment growth in 2010-11.
As we discuss below, the Legislature could still consider augmentations to UC and CSU in order to restore service levels from reductions made in the previous two years.
Figure 9
Enrollment Would Decrease in 2010-11
Full-Time Equivalent Students
|
|
2009-10
Enrollment
Estimate
|
2010-11
Enrollment
|
|
|
Segments’
Plan
|
Percent
Change
|
Governor’s
Budget
|
Percent
Change
|
|
University of California
|
213,880
|
213,049
|
-0.4%
|
209,977
|
-1.8%
|
|
California State University
|
340,643
|
310,317
|
-8.9
|
339,873
|
-0.2
|
The state’s Master Plan and current statute direct the community colleges to serve as “open enrollment” institutions. As such, community colleges do not deny admission to students. Instead, students simply register for classes that have available space, usually on a first-come, first-served basis. Many factors affect the number of students who attend a community college. Changes in the state’s population, particularly among young adults, can be a major factor affecting enrollment levels. Factors such as economic conditions, enrollment decisions at UC and CSU, and the perceived value of the education to potential students also affect residents’ demand for CCC instruction.
After Period of Lackluster and Overfunded Growth... As Figure 10 shows, after peaking in 2002, enrollment levels entered a phase of decline then modest growth over a few years. As we discussed in the 2008-09 Analysis of the Budget Bill, during this time of uneven growth, the state budget repeatedly provided more funding for enrollment growth than community colleges could use. In fact, in order to bring funding into line with the lower enrollment levels, in 2007 the Legislature reduced the system’s base budget by $80 million (the amount of funding associated with approximately 20,000 slots that became vacant before 2006-07).
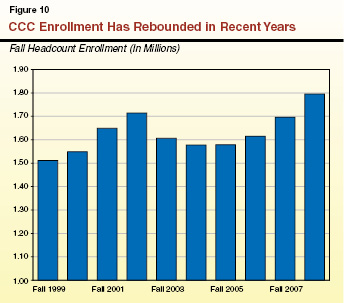
...Enrollment Reached an All-Time High. Consistent with nationwide trends, enrollment at California’s community colleges has rebounded strongly since 2007. (This is due in large part to individuals responding to a tight job market.) In fact, as Figure 11 shows, enrollment grew so rapidly in 2007-08 that systemwide growth exceeded the budgeted level by about 13,000 FTE students. If funded, this excess enrollment would have required about $56 million in additional apportionment monies. The budget, however, also provided a total of $43 million in “stability” funding—representing over 9,000 students—for slots that became vacant in declining districts that year.
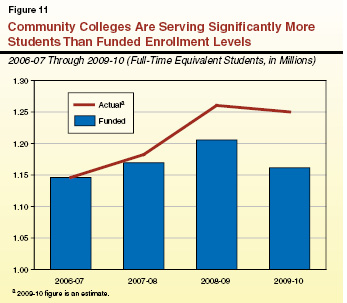
The 2008-09 Budget Act included an augmentation of $114 million to fund new enrollment growth of 2 percent, or about 23,000 FTE students. In addition, the 2008-09 base budget retained $43 million for the enrollment slots that became newly vacant in 2007-08. As a result, the budget provided CCC with enough funding to accommodate an additional 32,000 FTE students, or about 3 percent of base enrollment. Yet, this was insufficient to accommodate the number of students served by CCC. By the end of the year, enrollment had exceeded funding by over 50,000 FTE students. A total of 47 districts ended 2008-09 with at least some “overcap” students, with the remaining 25 districts right at or just below their respective enrollment targets.
2009-10 Budget Act Reduced Funding. The 2009-10 budget package included a net $190 million cut to CCC apportionments (comprised of General Fund reductions as well as shortfalls in other revenue sources). To maintain the same amount of funding per student, districts’ enrollment targets were reduced in proportion to the net reduction in base apportionment funding. As a result, funded enrollment levels for CCC in 2009-10 declined by 3.3 percent from the budgeted level in 2008-09 (about 43,000 FTE student slots).
To accommodate these reductions, community colleges have cut the number of course sections that they offer. Districts began the 2009-10 year by reducing the number of course sections offered during the summer by about 30 percent. Although systemwide data for the fall term were not available in time for inclusion in this report, most community colleges that we have contacted indicate that they have cut sections by 5 percent or more compared with the previous fall, and that they have made even deeper cuts in the spring term to achieve sufficient savings. Many districts report that while virtually all areas of instruction have been affected by cuts, they have disproportionately targeted physical education and other recreational courses—consistent with intent language included in the 2009-10 Budget Act that directed colleges to preserve “core” academic and workforce training instruction as much as possible. Based on preliminary information from the statewide Chancellor’s Office, current-year enrollment at CCC is projected to drop modestly from 2008-09 levels—though this would still be far above budgeted enrollment levels. (This projected decrease in enrollments is proportionally less than the significant cuts in course sections, for reasons explained in the nearby box.)
Many community colleges have significantly reduced course sections, yet enrollments are on track to being only slightly below last year’s levels. For example, a 10 percent cut to course section offerings might result in only a 5 percent drop in enrollments. There are two main reasons for this. First, districts have often targeted for elimination their sections with low enrollments (such as classes that were only one-half full the prior year). Elimination of these low-demand classes fulfills the goal of saving money (particularly in instructor-related costs), but results in a much smaller drop in full-time equivalent students. Second, many course sections that districts opted to retain this year had capacity (available space) to add students. Adding students to fill these seats adds only negligible costs to providing the course section. Thus, districts have filled up these previously vacant seats in the current year—at times beyond courses’ class-size maximum—adding to districts’ average number of students served per class. As a result of these factors, the “fill” rate (the percentage of available seats that are filled) and other measures of district efficiency and productivity have increased considerably throughout the California Community Colleges (CCC) system in 2009-10.
|
Greater Unmet Demand. Shrinking course offerings in the face of continued strong enrollment demand has resulted in an unknown but likely significant number of students who have had trouble getting into the classes they want. For example, San Diego City College District reports that two-thirds of course sections in spring 2010 have waiting lists for students to get in, which is up significantly from the prior year’s spring term. Santa Clarita Community College District has over 80 percent of its spring 2010 sections with waiting lists. San Mateo Community College District reports that the number of students on waiting lists for spring classes (over 13,000) was about 90 percent higher than the same time last year.
The 2010-11 budget requests $126 million for enrollment growth to fund about 26,000 additional FTE students—a 2.2 percent increase over current-year levels. Typically, new enrollment funding allows colleges to accommodate more students than they currently serve. Because of the large number of students that are already over enrollment caps, however, districts have indicated that the benefit of growth funds would be to reduce the gap between funded workload and actual enrollments. Absent these additional enrollment monies, overcap districts indicate that they would likely further reduce course sections to bring the number of students they serve closer to the funded levels. (For this reason, a more accurate term for these proposed monies would be enrollment preservation funds.) The likely small number of districts that enter the budget year with no overcap workload would presumably use the new funding to increase total enrollments beyond their current-year base.
Recommend Funding Overcap Enrollment With New Fee Revenue. The community colleges are currently facing strong demand for their services, as adults seek job retraining and other skills at a time of weak state and national economic growth. In addition, most districts are enrolling more students than they are funded to serve. For these reasons, we recognize a need for additional funding to support this enrollment. Given the state’s fiscal condition, however, we do not recommend that the Legislature fund this enrollment using General Fund support. Instead, we recommend providing necessary resources to the colleges by augmenting student fee revenue, which would supplement Proposition 98 support. As we discuss later in this chapter, our recommended fee increases would not affect financially needy students (because they are eligible to receive full fee waivers) and would be fully offset for most middle-income students (who qualify for federal tax credits).
The universities have increased fees for the last three consecutive years, and the state raised community college fees this year after several years of constant or reduced fees. Financial aid has also increased substantially, mitigating the effects of fee increases on affordability.
Fees at all three public higher education segments have been increased in partial response to General Fund constraints.
UC and CSU Fees Have Increased Substantially. A student entering UC as a freshman in fall 2006 and graduating in spring 2010 will have seen an increase in annual fee costs of more than $2,200, or 36 percent, while enrolled. A CSU student during the same years will have experienced an increase of more than $1,500, or nearly 60 percent. (Students enrolled over a longer period will experience even greater total increases.) Figure 12 shows recent fee history for the universities.
Figure 12
Total Mandatory Systemwide Charges
|
|
|
|
|
|
Increase Since 2006-07
|
|
|
2006-07
|
2007-08
|
2008-09
|
2009-10
|
Amount
|
Percent
|
|
UC
|
|
|
|
|
|
|
|
Residents
|
|
|
|
|
|
|
|
Undergraduates
|
$6,141
|
$6,636
|
$7,126
|
$8,373
|
$2,232
|
36%
|
|
Graduate Students
|
6,897
|
6,654
|
7,986
|
8,847
|
1,950
|
28
|
|
Professional Studentsa
|
21,418
|
21,858
|
29,014
|
29,014
|
7,596
|
35
|
|
Nonresidents
|
|
|
|
|
|
|
|
Undergraduates
|
24,825
|
26,256
|
27,734
|
31,090
|
6,265
|
25
|
|
Graduate Students
|
21,858
|
22,464
|
22,992
|
23,889
|
2,031
|
9
|
|
Professional Students
|
33,663
|
34,103
|
41,259
|
41,259
|
7,596
|
23
|
|
CSU
|
|
|
|
|
|
|
|
Residents
|
|
|
|
|
|
|
|
Undergraduates
|
$2,520
|
$2,772
|
$3,048
|
$4,026
|
$1,506
|
60%
|
|
Teacher Credential Students
|
2,922
|
3,216
|
3,540
|
4,674
|
1,752
|
60
|
|
Graduate Students
|
3,102
|
3,414
|
3,756
|
4,962
|
1,860
|
60
|
|
Professional Students
|
3,102
|
3,414
|
3,756
|
5,382
|
2,280
|
74
|
|
Nonresidents
|
|
|
|
|
|
|
|
Undergraduates
|
12,690
|
12,942
|
13,218
|
15,186
|
2,496
|
20
|
|
Teacher Credential Students
|
13,092
|
13,386
|
13,710
|
15,834
|
2,742
|
21
|
|
Graduate Students
|
13,272
|
13,584
|
13,926
|
16,122
|
2,850
|
21
|
|
Professional Students
|
13,272
|
13,584
|
13,926
|
16,542
|
3,270
|
25
|
The universities have also raised fees for graduate, professional, and nonresident students over this time, as shown in the figure. In some cases, these increases are less steep than for resident undergraduates. For example, the UC Regents have moderated increases in graduate student charges because they are concerned about UC’s ability to attract the best graduate students.
Community College Fees Raised This Year. The 2009-10 budget includes an increase of $6 per unit (30 percent) in community college fees, following four years in which fees were reduced or held constant.
Even With Increases, Fees Remain Well Below Averages. Despite recent fee increases, fees at all three segments remain below national or comparison group averages. Both undergraduate and graduate fees for resident students at UC are less than 90 percent of the average of UC’s public research university comparison group. Fees at CSU are 61 percent of its comparison group average, making them the second-lowest among 16 comprehensive state universities. Community college fees remain by far the lowest in the nation, at about 27 percent of the national average.
Need-based financial aid programs have expanded to partially or fully offset increased fees and other costs for most low- and middle-income students.
Cal Grants Are Tied to Fee Levels. The Cal Grant program is the state’s primary student financial aid program. Over 200,000 students at public and private postsecondary institutions will receive an estimated $1 billion in awards this year. Income ceilings for eligibility are relatively high. For example, a student from a four-person family making $80,000 per year could qualify.
The Cal Grant award amount for UC and CSU students is set by statute at the mandatory systemwide fee level for each segment. (Some Cal Grant recipients are not eligible for a fee payment in their first year, but most of these students receive additional support from the institutions to cover their fees.) When the segments increase fees, CSAC increases award amounts accordingly. As a result, all university students whose fees are paid by Cal Grants are protected from fee increases.
Campus-Based Financial Aid Programs Expand With Fee Revenues. For many years, the universities have set aside a portion of revenues from fee increases to augment their own “institutional” financial aid programs. In the current year, fee revenues directed to aid programs total $630 million at UC and $435 million at CSU. In addition, each segment receives General Fund support specifically for student financial aid—$52 million at UC and $34 million at CSU. Combined, these funds provide about $1.2 billion in campus-based aid.
The campuses use institutional aid funds in combination with other sources to meet students’ financial need. The UC campuses fully fund any costs of attendance—including fees, room and board, books, supplies, and other costs—that are not covered through federal and state grants, the expected family contribution (EFC), and a manageable student self-help contribution from work and borrowing. (The EFC is calculated for each family in accordance with the federal needs analysis methodology. The self-help contribution, currently set at $9,100, is consistent for undergraduates at all campuses.)
The CSU uses a different approach to meeting student need, concentrating their resources on students with the greatest financial need rather than maintaining a common self-help expectation for all students. Campuses use institutional aid to ensure that fees (but not necessarily all costs of attendance) are fully covered for students above a certain need threshold who do not qualify for Cal Grants. The threshold varies depending on available funding, but generally corresponds to an EFC of $4,000 or less using the federal methodology. (In the current year, a family of four with one child at CSU would meet this threshold with an income of about $55,000.)
If campuses have remaining funds after serving these students, they can raise the EFC threshold, provide awards that exceed fee coverage for some students, or otherwise supplement students’ financial aid packages. At both UC and CSU, campuses generally cover any fee increases for grant recipients by increasing financial aid awards. The UC campuses also offer partial fee coverage, equal to half the amount of any fee increases, to non-needy students with family incomes up to $100,000 in 2009-10 ($120,000 in 2010-11) who are not otherwise eligible for grant assistance.
The CCC’s primary campus-based aid is provided through the Board of Governors (BOG) fee waiver program. All financially needy students qualify to have their enrollment fees waived, and thus are not affected by fee increases.
New and Expanded Federal Aid Programs. Although not directly tied to fees, federal financial aid programs have helped to offset some cost increases in recent years. See the box for information about these programs.
|
Recent changes in federal financial aid have helped California students:
-
Federal Grants. The maximum Pell Grant has increased by $1,300 since 2006-07. The maximum in 2009-10 is $5,350. (In 2007-08, about 14 percent of California Community Colleges [CCC] students had federal grants averaging $2,500, and about 32 percent of University of California [UC] and California State University [CSU] students had federal grants averaging $3,400.)
-
Veterans’ Education Benefits. The Post-911 GI Bill became effective August 1, 2009, and covers tuition and fees, a monthly housing allowance, and an annual stipend for books and supplies. Estimated benefits exceed $25,000, $23,000, and $12,000 annually for full-time students at UC, CSU, and CCC respectively.
-
Federal Tax Credits.
Expanded federal tax credits in 2009 and 2010 are helping to cover all or a portion of fee increases for many students. The American Opportunity Tax Credit (AOTC) reimburses students (or their parents) with a family income of up to $160,000 for 100 percent of the first $2,000 in costs, and 25 percent of the next $2,000. This is an enhancement of the Hope tax credit, which reimbursed 100 percent of the first $1,200 and 50 percent of the next $1,200, and had lower income ceilings. The AOTC is refundable—even families who do not owe taxes can qualify for partial refunds.
|
Aid Programs Meet Financial Need for Many Students. As a result of these financial aid programs, nearly one-half of undergraduates at CSU and about one-third at UC and CCC effectively pay no fees. As such, they are fully protected from fee increases. Furthermore, many of these students receive financial aid to cover additional costs of attendance.
The general public often does not have a good understanding of how various financial aid programs work together to help make college affordable for many families. The nearby box describes one way UC is trying to communicate this to families.
The financial aid programs described above are designed to help low- and middle-income families afford college costs. They do not, however, cover all costs of attendance for students who qualify. Moreover, there are many students who do not qualify for need-based aid, even though their families may find it difficult to afford college costs. This is especially true for families above California’s median income. Their income may be high enough to disqualify them from grant aid, but not so high as to cover all costs of attendance without substantial loans and student contributions from work.
Low-Cost Options Are Available—But Increasingly Difficult to Navigate. California has earned high marks for affordability in national rankings, primarily because it provides a low-cost option for students through the community colleges. Attending a community college or public university while living at home with parents remains an affordable option for many Californians. Recent funding reductions and enrollment surges at the community colleges, however, have made it more difficult for students in many districts to enroll in the courses they need. Low cost options remain available, but are increasingly difficult to navigate at resource-constrained campuses.
The Governor’s proposed budget assumes fee increases at the universities, but not at the community colleges.
Fifteen Percent Fee Increase Approved by UC Regents. The UC Regents approved a 15 percent fee increase for 2010-11, raising mandatory systemwide fees for resident undergraduates by over $1,900, to $10,302 per year. Combined with fee increases for other categories of students, this is projected to generate $423.3 million in new revenues (after setting aside one-third to augment institutional financial aid programs). The Governor reflects these increases in his budget.
Ten Percent Increase Expected at CSU. Although the CSU Trustees have not approved a fee increase for 2010-11, they approved a support budget that includes a request for state funds in lieu of a 10 percent increase in the State University Fee. The Governor instead reflected this fee increase and associated revenues of $102.3 million (after institutional aid) in his budget. A 10 percent increase would raise fees by about $400 for full time undergraduates, to $4,429.
Recommend No Change to Proposed Fee Increases. Fee revenues are an important component of total funding for higher education. They work together with General Fund support to maintain instructional and support services at the campuses. Even with the proposed fee increases, charges at the universities remain below average, and need-based financial aid programs fully offset the costs for many financially needy students. Some of these programs also blunt the impact of fee increases for middle-income students.
In the past, we have recommended that the annual budgets for UC and CSU include moderate and predictable fee increases at the universities, and suggested 10 percent as a guideline for the upper limit of “moderate.” The Governor’s proposed fee increase for CSU falls within this guideline, but UC’s board-approved increase, at 15 percent, exceeds the guideline.
Given the extraordinary pressure on the state budget, we do not recommend any change to the proposed fee increases at the universities. Supplanting the additional UC fee revenue with General Fund support would require an additional $62 million, and foregoing the additional revenue would hinder efforts to restore service levels at UC campuses.
|
In an effort to communicate financial aid opportunities clearly to families concerned about affordability, the University of California developed the Blue and Gold Opportunity Plan—a guarantee that fees will be covered for students from families earning up to $60,000. (The income cap will rise to $70,000 for 2010-11, and will be reviewed annually to ensure it remains at or above the median California household income.) Fees for nearly all of these students are covered by Cal Grants and institutional aid, irrespective of the Blue and Gold plan. The new program is primarily a packaging strategy that reduces a more complex discussion of financial aid into an easily understood message. The California State University has announced a similar guarantee, as have numerous public and private universities around the country.
|
Fee Revenue Helps Support Colleges. Community colleges receive three main sources of general-purpose funding: state General Fund dollars, local property taxes, and student fee revenue. In 2009-10, student fees cover about $350 million of CCC costs. Even when state budget constraints require reduced state support for CCC, the effect of these reductions on CCC programs can be softened by increasing fee revenue.
No Fee Increase Proposed. The Governor proposes no change to the current fee level of $26 per unit, which is the lowest among the country’s public two-year colleges. Yet, as we discuss in California Community Colleges: Raising Fees Would Mitigate Program Cuts and Leverage More Federal Aid, additional revenue could be raised through CCC fees with minimal effect on most students’ costs. This is made possible by multiple state and federal financial aid programs, as described below.
State Fee Waivers and Federal Tax Breaks Help Offset Fee Costs. The state’s BOG fee waiver program exempts financially needy students from paying fees. As we note in the 2009-10 Budget Analysis Series: Higher Education (pages HED-24 and 25), the program has relatively high income cut-offs. For example, a student with one child could have an income up to roughly $80,000 and still qualify for a waiver.
The vast majority of students who do not qualify for BOG waivers are still eligible for federal financial assistance that covers all or a part of their fees. Figure 13 summarizes the features of the federal American Opportunity Tax Credit (AOTC), Lifetime Learning Credit, and tuition and fee tax deduction. As we note in our Federal Economic Stimulus Package report (pages FED-13 and 14), ARRA replaced the Hope tax credit with AOTC in the 2009 and 2010 tax years. (The Hope tax credit would return in 2011, although the President’s budget proposes to make AOTC a permanent program.) As the figure details, income thresholds for all three programs are high. In addition, AOTC reimburses students for 100 percent of the first $2,000 in tuition, fee, and textbook costs. We estimate that about 90 percent of CCC students would qualify for either a fee waiver or a full or partial tax offset to their fees. Roughly three-quarters of these students would effectively pay no fees at all.
Figure 13
Federal Tax Benefits Applied Toward Higher Education Fees
2010
|
American Opportunity Tax Credit
|
Lifetime Learning Credit
|
Tuition and Fee Deduction
|
- Directly reduces tax bill and/or provides partial tax refund to those without sufficient income tax liability.
|
- Directly reduces tax bill for unlimited number of years.
|
|
- Covers 100 percent of the first $2,000 in tuition payments and textbook costs. Covers 25 percent of the second $2,000 (for maximum tax credit of $2,500).
|
- Covers 20 percent of first $10,000 in fee payments (up to $2,000 per tax year).
|
- Deducts between $2,000 and $4,000 in fee payments (depending on income level).
|
- Designed for students who:— Are in first through fourth year of college.— Attend at least half time. — Are attempting to transfer or acquire a certificate or degree.
|
- Designed for students who:— Already have a bachelor’s degree. — Carry any unit load. — Seek to transfer or obtain a degree/ certificate—or simply upgrade job skills.
|
- Designed for any student not qualifying for a tax credit.
|
- Provides full benefits at adjusted income of up to $160,000 for married filers ($80,000 for single filers) and provides partial benefit at adjusted income of up to $180,000 ($90,000 for single filers).
|
- Provides full benefits at adjusted income of up to $100,000 for married filers ($50,000 for single filers) and provides partial benefit at adjusted income of up to $120,000 ($60,000 for single filers).
|
- Capped at adjusted income of $80,000 for single filers and $160,000 for married filers.
|
Recommend Raising Fees to Maximize Federal Aid and Benefit CCC Programs. We recommend the Legislature increase CCC fees to leverage more federal aid and provide needed funds to the CCC system. An increase to $40 per unit (from $26 per unit) would mean that a full-time student taking 30 units per academic year would pay $1,200. Students taking advantage of AOTC would thus qualify for a full fee credit—while leaving room to receive up to $800 as reimbursement for course-materials costs. (Should this credit not be extended, the Hope tax credit also would fully cover $1,200 in fee costs in 2011.) These higher fees would generate approximately $150 million in additional revenues to the CCC system. These revenues would effectively provide funds for CCC enrollment as well as “buy out” the Governor’s proposal to apply a negative COLA to the system. Lastly, we note that even at this higher amount, CCC fees would still be the lowest in the country.
Fully Funds Most Aid Programs. The proposed budget augments funding for Cal Grant entitlement programs to cover increased costs resulting from fee increases at the universities. It also fully funds the Cal Grant C program for occupational and technical training, and several loan assumption programs.
Suspends Competitive Program. The Governor’s budget proposes to suspend Cal Grant competitive awards. Although current law authorizes 22,500 new competitive awards annually, the budget includes no funding for new awards in 2010-11. Trailer bill language proposed by the administration would authorize new awards only to the extent funding is provided in the annual budget act.
The Governor’s proposed trigger reductions, to be implemented in the event a proposed $6.9 billion in additional federal funding does not materialize, include additional reductions of $79 million in Cal Grants. These include decoupling award amounts from fee levels ($78 million), and freezing income eligibility limits ($1.1 million).
As discussed below, we recommend rejecting the Governor’s proposed financial aid cuts and implementing alternative reductions that would better preserve the structure of the state’s financial aid system.
Competitive Program Is Part of Comprehensive Affordability Strategy. The competitive program accounts for about one-fifth of Cal Grants and 14 percent of grant dollars. Unlike the entitlement programs, it is selective. Criteria are weighted with 70 percent based on grade point average (GPA) and 30 percent based on various measures of disadvantage (such as parents’ educational level, family income, and household size).
In his budget summary, the Governor describes the suspension of new awards as Cal Grant reform, and asserts that the competitive program is largely duplicative of the entitlement programs. In our assessment, this is not accurate.
Figure 14 compares average age, income, GPA, and family size for recipients of the high school entitlement and competitive programs. The competitive program serves older students, many of whom are financially independent from their parents. Both programs serve very low-income, financially needy students. The competitive program recipients have a higher average GPA than those in entitlement programs.
Figure 14
Cal Grant Recipient Characteristics
2007-08
|
Averages
|
Entitlement
Programa
|
Competitive
Program
|
|
Age
|
18
|
30
|
|
Grade point average
|
3.10
|
3.27
|
|
Income
|
$28,771
|
$14,895
|
|
Family size
|
4.1
|
3
|
The Cal Grant competitive program serves nontraditional students who are seeking education and training. About two-thirds of these students attend CCC. In our view, suspending the state competitive program would undermine a key part of the state’s affordability strategy. In order to maintain the state’s commitment to affordability in higher education, we recommend the Legislature seek alternative savings, and consider suspension of the competitive program only as a last resort.
Full Fee Coverage Is Key Feature. Under the Governor’s trigger proposal, Cal Grants would no longer cover full fees. As a result, Cal Grant recipients would have to secure additional financial aid or pay for the fee increases out of pocket. This proposal would affect all Cal Grant recipients at UC and CSU (about 115,000 students), as well as other recipients planning to transfer to one of the public universities. In addition to creating a potential barrier to affordability for these students, this action would complicate public awareness efforts about college affordability. Currently, CSAC and its outreach partners can deliver a clear message: if students meet established eligibility criteria and enroll in a public university, they will qualify for Cal Grants that pay their full fees for three to four years of postsecondary education. If the link with fees is broken, the clarity of the message will suffer. This is important because studies show that perceived complexity in financial aid programs deters students and families from applying. In addition, linking Cal Grant amounts to fee levels provides a logical basis for funding. Without this link, the amounts would be arbitrary, making budgeting more difficult for state policymakers as well as students and families.
Consistency Counts. The second part of the Governor’s trigger reduction, freezing income ceilings for Cal Grant eligibility at current-year levels, would have a smaller impact, affecting about 280 students. (The income limits are normally increased by the previous year’s percent change in per capita personal income.) The projected savings, however, are also relatively small. We question the value of “moving the bar” on income eligibility for these savings. Initially, the number of students affected would be small, especially during a period of slow or negative income growth. If this practice is continued, however, it could cause an erosion of the program’s value over time by reducing the pool of eligible applicants. It could also set a precedent for arbitrary changes to eligibility requirements that reduce the program’s effectiveness in serving financially needy students.
Other alternatives could yield General Fund savings with less damage to the structure of California’s financial aid system. We recommend the Legislature adopt these alternatives:
-
Increase Minimum GPA for Cal Grant B Eligibility to 2.5. Under the High School Entitlement program, students must attain a high school GPA of 3.0 to qualify for a Cal Grant A which provides full fee coverage for four years. Students may qualify for the Cal Grant B, which provides a stipend of $1,551 each year and full fee coverage after the first year, with a 2.0 GPA. Students with a GPA of 2.0 have extremely low rates of persistence and success in college. Estimates show fewer than 20 percent of students with high school GPA of 2.0 or less graduate from the CSU in six years or more. Raising the GPA requirement would eliminate about 13,500 students from entitlement program eligibility, and save $13 million.
-
Limit New Competitive Cal Grant Awards to Stipends Only. While suspending competitive Cal Grant awards would affect about 17,000 students and create a significant gap in the state’s financial aid strategy, the state has other options for reducing expenditures in this program that would affect fewer students. Currently, community college students receive three-quarters of new competitive awards but only one-third of new funding. Students at UC, CSU, nonprofit colleges and universities, and private career schools receive one-quarter of awards (about 4,000) with the majority of funding. This is largely because community college students do not receive fee coverage as part of their grant awards. (They qualify for BOG fee waivers, and receive a $1,551 annual stipend to cover expenses other than fees.) Restricting all new competitive awards to this amount would not affect the three-quarters of new recipients who are CCC students. Other students would have the option to attend a community college for two years with fee waivers and stipends, or seek additional financial aid at other institutions. This would create about $20 million in General Fund savings versus the $45 million the Governor assumed from suspending competitive awards.
-
Eliminate Non-Need-Based Fee Waivers. The state has two programs which waive fees for survivors and dependents of deceased and disabled public safety workers and veterans—regardless of a student’s financial situation. These programs account for more than $20 million in foregone fees at public colleges and universities. Although we recognize the desirability of honoring service and sacrifice, we believe that state financial aid resources should be targeted to students who would otherwise not be able to afford college. In both instances, there are similar federal assistance programs that serve these populations.
As we noted earlier, the Governor seeks no budget solutions from the universities in 2010-11. In fact, the proposed budget includes augmentations that would return UC and CSU to pre-recession funding levels. In this section, we discuss the costs of restoring funding for the universities in 2010-11, and compare those costs to the funding levels the Governor proposes.
Throughout this report, we have treated the 2007-08 fiscal year as the last normal year of higher education funding prior to the disruptions created by the recession. Based on this approach, we believe the 2007-08 funding level would be an appropriate level of support for 2010-11, should the Legislature wish to restore the universities’ budgets. More specifically, returning per-student funding to the 2007-08 rate would permit campuses to restore instructional and support services for students similar to those levels in place before the recession, for any 2010-11 enrollment level. However, restoration of funding should take into account all available funding—including student fee revenue—that is available to support education programs.
Based on these considerations, we calculated the average programmatic funding per FTE student (per-student funding) in 2007-08 as a funding target. Programmatic funding includes General Fund support, systemwide fee revenues, and State Lottery funds. We then divided this total funding amount by resident student enrollment (undergraduate, teacher credential, graduate, and professional) to determine per-student funding. Although the segments were overenrolled in 2007-08, we used the segments’ budgeted enrollment levels in calculating the average funding amount because they reflect the number of students that the Legislature expected UC and CSU to enroll when the 2007-08 budget was enacted. Based on these calculations, core funding sources provided $21,907 per funded student at UC and $11,459 at CSU in 2007-08. (These amounts differ slightly from those in Figure 1 because they include State Lottery Fund allocations.)
Restoring Funding to 2007-08 Per-Student Level Would Provide More Resources Than Last Two Years. As shown in Figure 15, total funding per student declined significantly in 2008-09 and again in 2009-10, despite new revenue from federal stimulus funds and fee increases. To accommodate these reductions, the universities reduced part-time faculty, increased class sizes, implemented furloughs for faculty and staff, reduced course offerings, and streamlined some administrative functions. They also made fuller use of enrollment management tools (in some cases by enforcing existing rules) to better ensure efficient use of higher education resources. Following these back-to-back reductions, restoring funding to 2007-08 rates would require increases above 2009-10 funding amounts at virtually any feasible enrollment level.
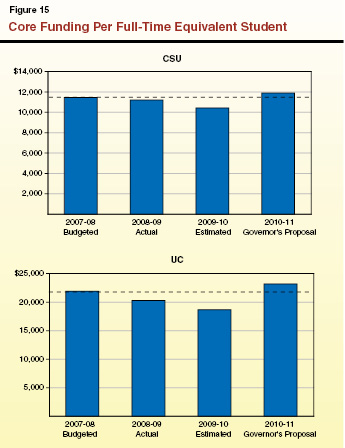
Inflationary Cost Increases. California has experienced modest inflation each year since 2007-08. The state has not provided inflation adjustments for the universities (or virtually any state program or department) in the last two years. The 2009-10 budget package expressly prohibits automatic annual price increases in future years for higher education and most other areas of state government.
Nonetheless, the universities have experienced price increases in several areas including health insurance premiums and salary adjustments. Like other state agencies, they have had to absorb these cost increases within their reduced budgets by creating efficiencies and other cost savings. The CSU, for example, reports embarking on a variety of cost-saving and academic efficiency initiatives—such as regional sharing of certain technology functions and concerted efforts to increase on-time graduation rates.
Given low inflation, continuing budget pressures, and the state’s move away from automatic price increases, we believe it is reasonable to continue expecting the universities to absorb cost increases through efficiencies. For these reasons, our 2010-11 target for funding per student is not adjusted for inflation.
Earlier in this report, we recommended rejecting the Governor’s proposed augmentations for enrollment growth because no enrollment growth is anticipated. Even without the enrollment and funding associated with these augmentations, the Governor’s budget still would provide $298 million more than would be required to restore total funding per student to 2007-08 budgeted levels. As illustrated in Figure 15, average per-student funding under the Governor’s proposal (excluding his enrollment augmentations) would exceed budgeted 2007-08 levels by about $1,300 at UC and more than $400 at CSU.
In order to respond to the Governor’s budget proposal, the Legislature will need to evaluate how much of a General Fund augmentation, if any, to provide to the universities, given existing budget constraints as well as competing priorities. Whatever level of total funding the Legislature chooses for the universities can be viewed as involving two important choices: (1) what amount of funding should be provided per student and (2) what number of students should be served?
As mentioned above, restoring programmatic funding per student to the 2007-08 levels would permit the universities to substantially reinstate instructional and student support services that have deteriorated over the past two years while requiring them to continue some cost-saving initiatives to accommodate price increases. As such, we think the 2007-08 rates are an appropriate funding target for 2010-11. (In order to ensure that this restored funding is used to improve education services, the Legislature would be well advised to clarify its expectations of the segments in budget bill language.)
Such a funding restoration would be a notable legislative achievement in this fiscal environment. Per-unit funding rates for many state services have been reduced over the past two years and face further reductions in 2010-11. Restoring university funding to 2007-08 rates, even without inflation, would leave the universities in a far better position than most other agencies.
We recommend the Legislature adopt specific enrollment targets for 2010-11. In doing so, the Legislature would clarify expectations of the segments and provide an unambiguous base from which to provide annual enrollment funding in subsequent years. This would avoid continued confusion about funded enrollment levels, and paradoxical proposals such as the Governor’s “enrollment growth” augmentations amid enrollment reductions.
Below, we discuss various enrollment levels that could be considered. These options and the corresponding costs and savings compared to the current year and the Governor’s budget are summarized in Figure 16. Although we specifically recommend one of the enrollment options presented in this section, the Legislature’s selection of an enrollment target will depend on how it wishes to balance higher education funding with support for other priority areas.
Figure 16
Costs to Restore 2007-08 Programmatic Funding for Various Enrollment Options
|
|
Enrollment
|
|
Augmentationsa
|
|
Savingsb
|
|
Enrollment Targets:
|
UC
|
CSU
|
|
UC
|
CSU
|
Totals
|
|
Totals
|
|
Level General Fund supportc
|
202,194
|
312,494
|
|
—
|
—
|
—
|
|
$610.0
|
|
Segments‘ targets
|
213,049
|
310,317
|
|
$162.9
|
-$18.5
|
$144.4
|
|
465.6
|
|
Governor‘s enrollment leveld
|
204,855
|
331,583
|
|
39.9
|
162.1
|
202.0
|
|
408.0
|
|
LAO Proposal
|
213,049
|
330,000
|
|
162.9
|
148.6
|
311.5
|
|
298.5
|
|
Estimated current enrollment
|
213,880e
|
340,643
|
|
175.3
|
239.0
|
414.3
|
|
195.7
|
“Level” General Fund Support Would Result in Lowest Enrollment Target. The Legislature could maintain current-year General Fund support for the universities in 2010-11, providing about $610 million in General Fund relief compared with the Governor’s proposal. (This is roughly the minimum funding level allowed under federal maintenance-of-effort requirements the state agreed to when it accepted federal stimulus funding for the universities in 2009.) This level of General Fund support, combined with expected fee revenues, would fund about 202,000 FTE students at UC and 312,500 FTE students at CSU at 2007-08 per-student levels—declines of about 12,000 and 28,000 students respectively compared with current-year enrollment levels. An enrollment reduction of this magnitude would be difficult for UC to achieve by 2010-11. The CSU, however, has been working toward an enrollment reduction of this size.
Current Enrollment Levels Represent Highest Target. As noted in the “Enrollment and Access” section of this report, both UC and CSU have sought to constrain their enrollment in recent years. Considering these efforts, we think it is unlikely that the segments would be able to exceed current-year enrollment levels in the budget year. In fact, the universities have already established 2010-11 enrollment targets that are below current enrollment levels. The campuses are using these targets as the basis for 2010-11 admission decisions which are well underway. Most campuses stopped accepting applications November 30, and have begun accepting students for admission based on the segments’ enrollment targets. It is possible for institutions to increase their enrollment plans after the budget is adopted—most readily by using waiting lists and adjusting winter and spring term admissions—but difficult for them to make large changes for the fall.
Given campus enrollment targets that are below current-year levels, the maximum enrollment the campuses could reasonably accommodate in 2010-11 while restoring service levels to prior standards, in our judgment, is a return to current-year levels. The Legislature could fund these enrollment levels at the 2007-08 per-student programmatic funding amounts while saving $196 million relative to the Governor’s proposal. The resulting enrollment—about 214,000 at UC and 341,000 at CSU—is higher than the Governor’s and segments’ proposed targets, most markedly for CSU.
Universities’ and Governor’s Targets Are in Middle of Range. The CSU’s board-approved enrollment target is fairly close to the level funding target described above. The Chancellor’s Office developed its target under the conservative assumption that the system would receive no new General Fund augmentations. The Governor’s enrollment level for the CSU is much higher because it is based on significant augmentations. The UC system’s target and the Governor’s proposed enrollment for UC both exceed the level funding target by several thousand students. Funding enrollment at the universities’ targets—at 2007-08 per-student programmatic funding rates—would free up $466 million relative to the Governor’s budget. Funding at the Governor’s enrollment levels would free up $408 million at these rates.
Recommend Adopting UC Target, Setting New Target for CSU. We recommend adopting UC’s enrollment target (213,049). The university developed its target several months ago and has proceeded with admissions and staffing plans for the fall as noted. Furthermore, the allocation of recent budget reductions was left up to the university, which developed its plans under this premise. The resulting target reflects a modest reduction, but not a dramatic departure, from recent enrollment levels. It also includes an increase in transfer admissions. For these reasons, we recommend accepting UC’s enrollment target. Supporting this enrollment level at the 2007-08 per-student funding rates would require an augmentation of $163 million, creating a savings of $142 million relative to the Governor’s proposed augmentation.
The CSU’s target, on the other hand, represents a dramatic departure from recent enrollment levels—a 9 percent reduction from the current year, and 13 percent over two years. Furthermore, it is feasible for CSU to increase its target by admitting students in the winter and spring terms as was customary before this year, and by utilizing campus waiting lists for qualified applicants. We expect some enrollment decline to result from CSU’s efforts to better manage its enrollment. For example, the CSU Trustees amended regulations so that campus presidents can now confer a degree—and prevent a student from enrolling in additional courses—once the student has met all degree requirements. More consistent enforcement of other enrollment management strategies, such as requiring students to maintain good academic standing, will also somewhat reduce enrollment.
Based on these considerations, we recommend an enrollment level of 330,000 FTE students for CSU. This is about a 3 percent reduction compared with current-year levels. Supporting this enrollment level at 2007-08 per-student funding rates would require an augmentation of $149 million, or a savings of $156 million relative to the Governor’s proposed augmentation.
Maintain Accountability Provisions. The Governor’s proposed budget includes a provision, common in recent years, requiring the reversion of enrollment funds if the universities do not meet specified enrollment targets. We think this is an important provision given the uncertainty about budget-year enrollment levels. Therefore, we recommend maintaining this provision, as well as clarifying the Legislature’s expectations of the segments in budget bill language.
As a result of unallocated reductions and unspecified enrollment targets, among other things, it is difficult to define the current base budgets for the universities, let alone the amount of access and quality of services they should be expected to provide. By returning per-student funding to 2007-08 levels and setting explicit enrollment targets, the Legislature would be able to restore clarity and accountability to the universities’ budgets, as well as help ensure that enrolled students can receive the quality of education services the Legislature expects.
Slight Programmatic Funding Increase Proposed. Most funding for the community colleges comes from Proposition 98 (General Fund and local property taxes). As Figure 17 shows, the Governor’s proposal for 2010-11 would increase total Proposition 98 funding for CCC by $219 million, or 3.9 percent, over the revised current-year level. This augmentation is the net of several changes, including:
-
An increase of $126 million for 2.2 percent enrollment growth for apportionments (general-purpose monies).
-
A reduction of $23 million resulting from a -0.38 percent COLA to apportionments and certain categorical programs.
-
A reduction of $28 million in Proposition 98 support for the Career Technical Education (CTE) Pathways Initiative (Chapter 352, Statutes of 2005 [SB 70]). (As discussed in the “Categorical Flexibility” section, the Governor’s budget leaves $20 million in base Proposition 98 funding for the program, and provides an additional $48 million in non-Proposition 98 support through the Quality Education Investment Act [QEIA].)
-
Base cuts of $10 million each to Extended Opportunity Programs and Services (EOPS), and Part-Time Faculty Compensation.
-
A technical adjustment of $163 million, which represents payments owed to community college districts in 2009-10 that were deferred until 2010-11.
Figure 17
California Community CollegesGovernor’s Proposition 98 Budget Proposal
(Dollars in Millions)
|
2009-10 (Enacted)
|
$5,668.8
|
|
Local property tax adjustment
|
$6.3
|
|
2009-10 Revised
|
$5,675.1
|
|
Proposed Budget-Year Augmentations
|
|
|
Enrollment growth for apportionments
|
$126.0
|
|
Proposed Budget-Year Reductions
|
|
|
Cost-of-living adjustment (COLA) for apportionments
|
-22.1
|
|
COLA adjustment for certain categorical programs
|
-0.8
|
|
Reduce Career Technical Education (CTE) Initiative
|
-28.0a
|
|
Reduce Extended Opportunity Programs and Services
|
-10.0
|
|
Reduce Part-Time Faculty Compensation program
|
-10.0
|
|
Suspend mandates
|
—b
|
|
Other Adjustments
|
|
|
Payment of prior-year deferral
|
163.0
|
|
Technical adjustments
|
1.3
|
|
2010-11 Proposal
|
$5,894.6
|
|
Change From 2009-10 Revised Budget
|
|
|
Amount
|
$219.4
|
|
Percent
|
3.9%
|
When this deferral payment is excluded, Proposition 98 programmatic support for CCC grows by about $56 million (about 1 percent) over current-year levels.
Figure 18 shows Proposition 98 expenditures for CCC programs. As shown in the figure, apportionment funding totals $5.4 billion in 2010-11, an increase of $264 million, or 5.1 percent, from the current-year level. The Governor’s budget would reduce total funding for categorical programs by about 11 percent from the current-year level. As proposed by the Governor, CCC would receive 11.8 percent of total Proposition 98 funding in 2010-11.
Figure 18
Community College Programs Funded by Proposition 98a
(Dollars in Millions)
|
|
Actual
2007-08
|
Actual
2008-09
|
Revised
2009-10
|
Proposed
2010-11
|
Change
From 2009-10
|
|
|
Amount
|
Percent
|
|
Apportionments
|
|
|
|
|
|
|
|
General Fund
|
$3,385.7
|
$3,144.2
|
$3,213.0
|
$3,517.0
|
$304.0
|
9.5%
|
|
Local Property Taxes
|
1,970.7
|
2,010.7
|
1,953.2
|
1,913.3
|
-40.0
|
-2.0
|
|
Subtotals
|
($5,356.4)
|
($5,154.9)
|
($5,166.2)
|
($5,430.3)
|
($264.1)
|
(5.1%)
|
|
Categorical Programs
|
|
|
|
|
|
|
|
Academic Senate
|
$0.5
|
$0.5
|
$0.3
|
$0.3
|
—
|
—
|
|
Apprenticeships
|
15.2
|
14.6
|
7.2
|
7.1
|
—
|
-0.4%
|
|
Basic Skills Initiative
|
33.1
|
33.1
|
20.0
|
20.0
|
—
|
—
|
|
CalWORKs student services
|
43.6
|
43.6
|
26.7
|
26.7
|
—
|
—
|
|
Campus child care support
|
6.8
|
6.8
|
3.4
|
3.3
|
—
|
-0.4
|
|
CTE Initiative
|
10.0
|
20.0
|
48.0
|
20.0
|
-$28.0
|
-58.3
|
|
Disabled Students Program
|
115.0
|
115.0
|
69.2
|
69.0
|
-0.3
|
-0.4
|
|
Economic and Workforce Development
|
40.7
|
46.8
|
22.9
|
22.9
|
—
|
—
|
|
EOPS
|
122.3
|
122.3
|
73.6
|
63.3
|
-10.3
|
-14.0
|
|
Equal Employment Opportunity
|
1.7
|
1.7
|
0.8
|
0.8
|
—
|
—
|
|
Financial Aid Administration
|
51.6
|
51.3
|
52.9
|
55.0
|
2.1
|
4.0
|
|
Foster Parent Education
|
5.2
|
5.3
|
5.3
|
5.3
|
—
|
—
|
|
Fund for Student Success
|
6.2
|
6.2
|
3.8
|
3.8
|
—
|
—
|
|
Matriculation
|
101.8
|
101.8
|
49.2
|
49.0
|
-0.2
|
-0.4
|
|
Nursing grants
|
21.0
|
22.1
|
13.4
|
13.4
|
—
|
—
|
|
Part-Time Faculty Compensation
|
50.8
|
50.8
|
24.9
|
14.9
|
-10.0
|
-40.1
|
|
Part-Time Faculty Office Hours
|
7.2
|
7.2
|
3.5
|
3.5
|
—
|
—
|
|
Part-Time Faculty Health Insurance
|
1.0
|
1.0
|
0.5
|
0.5
|
—
|
—
|
|
Physical Plant/Instructional Support
|
27.3
|
27.3
|
—
|
—
|
—
|
—
|
|
Telecommunications/Technology
|
26.2
|
26.2
|
15.3
|
15.3
|
—
|
—
|
|
Transfer Education
|
1.4
|
1.4
|
0.7
|
0.7
|
—
|
—
|
|
Subtotals
|
($688.7)
|
($705.0)
|
($441.5)
|
($394.8)
|
(-$46.7)
|
(-10.6%)
|
|
Other Appropriations
|
|
|
|
|
|
|
|
District financial-crisis oversight
|
$0.6
|
$0.6
|
$0.6
|
$0.6
|
—
|
—
|
|
Lease revenue bond payments
|
63.1
|
68.1
|
66.8
|
68.9
|
$2.0
|
3.0%
|
|
Mandates
|
4.0
|
—
|
—
|
—
|
—
|
—
|
|
Subtotals
|
($67.7)
|
($68.7)
|
($67.4)
|
($69.4)
|
($2.0)
|
(3.0%)
|
|
Totals
|
$6,112.8
|
$5,928.6
|
$5,675.1
|
$5,894.6
|
$219.4
|
3.9%
|
Governor Proposes Some Additional Flexibility for CCC. As we discuss in the “Proposition 98” section of the companion report of this budget series—Proposition 98 and K-12 Education—the Governor proposes to increase fiscal and program flexibility for K-14 education. For CCC, the budget proposes to:
-
Ease certain restrictions on districts to contract out for noninstructional services.
-
Suspend all, thereby allowing districts to choose whether to perform various activities.
-
Place three currently protected categorical programs in CCC’s “flex item.” (The Governor also proposes to remove a categorical program from the flex item, which would
reduce districts’ flexibility.)
-
Suspend a requirement that prescribes the percentage and number of full-time faculty that districts must employ each year.
Fund Overcap Enrollments by Increasing CCC Fees, Leveraging More Federal Aid. Our recommendations regarding the Governor’s community college proposals are discussed throughout this report. As discussed earlier in the “Enrollment and Access” section, we recommend that the Legislature increase fees to $40 per unit. This would generate approximately $150 million in additional fee revenues for CCC, while having no effect on most students’ net costs due to multiple state and federal aid programs. These monies could be used to fund overcap enrollments, as well as reverse the Governor’s negative COLA proposal (see the “Student Fees and Financial Aid” section). The net effect of our fee recommendation would provide slightly more overall resources for the CCC system relative to the Governor’s budget, while achieving about $125 million in Proposition 98 General Fund savings.
Expand District Flexibility. We support the general spirit of the Governor’s attempt to increase CCC districts’ fiscal and program flexibility. For example, as we discuss in the companion report—Proposition 98 and K-12 Education—we recommend the Legislature adopt the administration’s language to allow additional contracting out. As regards the Governor’s mandates proposal, however, we recommend that rather than suspending all CCC mandates, the Legislature take the extra step of eliminating virtually all of them. (See our recently released report,
Education Mandates: Overhauling a Broken System, for our evaluation of each mandate.)
We discuss our other recommendations concerning CCC flexibility below.
2009-10 Budget Act Cut Categorical Programs… As discussed earlier, the cuts that community colleges received in the 2009-10 Budget Act were focused primarily on categorical programs. Year-to-year support for categorical programs declined by 37 percent, from $705 million in 2008-09 to $441 million in 2009-10.
…Accompanied by Some Fiscal Flexibility for Districts. To help districts better accommodate these reductions, the budget package moved 12 of CCC’s 21 categorical programs into a flex item (see Figure 19). From 2009-10 to 2012-13, districts are permitted to transfer funds from categorical programs in the flex item to any other categorical spending purpose. (Such decisions must be made by local governing boards at publicly held hearings.) By contrast, funds in categoricals that are excluded from the flex item must continue to be spent on their own specific program in accordance with statutory and regulatory requirements. For example, funds in the Economic and Workforce Development program (within the flex item) may instead be spent on Financial Aid Administration (outside the flex item), though Financial Aid Administration can only be spent for that purpose.
Figure 19
2009-10 Budget Package Created “Flex Item” for Many California
Community College Categorical Programs
|
Programs Included in Flex Item
|
Programs Excluded From Flex Item
|
|
Academic Senate
|
Basic Skills Initiativea
|
|
Apprenticeship
|
CalWORKs Student Services
|
|
Campus Child Care Support
|
Disabled Students Program
|
|
Career Technical Education Initiativeb
|
Extended Opportunity Programs and Servicesa
|
|
Economic and Workforce Development
|
Financial Aid Administration
|
|
Equal Employment Opportunity
|
Foster Care Education Program
|
|
Matriculation
|
Fund for Student Successa
|
|
Part-Time Faculty Compensation
|
Nursing Grants
|
|
Part-Time Faculty Health Insurance
|
Telecommunications and Technology Services
|
|
Part-Time Faculty Office Hours
|
|
|
Physical Plant and Instructional Support
|
|
|
Transfer Education and Articulation
|
|
Governor Proposes to Add Three Currently Protected Categorical Programs to Flex Item. As part of his emphasis on flexibility, the Governor’s budget proposes to add three categorical programs to the flex item: the Basic Skills Initiative, EOPS, and the Fund for Student Success.
Funds in the Basic Skills Initiative (formally known as “Student Success for Basic Skills Students,” which is separate from the Fund for Student Success) are used by districts for activities and services such as curriculum development, professional development workshops, and supplemental counseling and tutoring for CCC students who lack college-level proficiency in English and mathematics. (“Basic skills” is a term typically used interchangeably with foundational skills and remedial and developmental education.)
The EOPS program provides various supplemental services (such as orientation, counseling, tutoring, and financial assistance to purchase textbooks) for low-income—and typically underprepared—students. (The Cooperative Agencies Resources for Education program is a subset of EOPS that serves welfare-dependent single parents who are attending CCC.)
The Fund for Student Success consists of three separate programs: Middle College High School (MCHS); Puente; and Mathematics, Engineering and Science Achievement (MESA).
-
The 13 existing MCHS are located on community college campuses. Students in the program typically take their high school classes together during one half of the school day, and attend community colleges classes during the other half. In addition to working toward a high school diploma, MCHS students have an opportunity to earn an associate’s degree and credits that are transferable to a four-year institution. The $1.5 million of 2009-10 General Fund support for MCHS is typically used for purposes such as helping high school students buy their college textbooks and paying the partial salary of a CCC counselor to advise students and their parents on courses to take.
-
Puente is a partnership among 58 community colleges, the UC, and the private sector. Staff from the UC Office of the President train CCC faculty to implement the program, which consists of intensive reading and writing classes (typically involving Latino literature), mentoring, and counseling services. The program is designed for students from historically underrepresented groups who are interested in transferring to a four-year institution. In 2009-10, the state provides Puente with $1.6 million in General Fund monies.
-
The purpose of MESA is to increase transfer rates of low-income students pursing degrees in math-based fields (such as engineering, computer science, and physics). Students in the MESA program receive counseling, tutoring, mentoring, and other services at one of the 30 participating community college campuses. The
2009-10 Budget Act provides $2.1 million in General Fund support for the program.
Budget Also Would Expand and Silo CTE. At the same time that it would add flexibility to three categorical programs, the administration proposes to remove another—the CTE Pathways Initiative—from the flex item.
The CTE Pathways Initiative was created by SB 70. Senate Bill 70 established a program to “improve linkages and career technical education pathways” between K-12 and community colleges. These “pathways” are designed to help K-12 students develop vocational skills sought by employers in the area, while also preparing students for more-advanced academic or vocational coursework at a community college or university.
The CCC Chancellor’s Office and California Department of Education (CDE) administer the initiative and allocate funds through a competitive grant process. Local projects are jointly developed by community colleges and K-12 entities (high schools and Regional Occupation Centers/Programs). Most local projects also are required to involve local business. Grants typically provide short-term improvement funding to develop or strengthen CTE programs rather than ongoing operational support. Currently, the initiative consists of 19 separate grant categories.
As Figure 20 shows, the program was funded with Proposition 98 funds during the first two years of operation (2005-06 and 2006-07). Chapter 751, Statutes of 2006 (SB 1133, Torlakson), included additional annual funding for the initiative as part of the QEIA. The QEIA payments are suspended in the current year. Instead, the program is funded by $48 million in Proposition 98 funds in the current year. As Figure 20 also shows, the administration’s proposal would augment total support for the program to $68 million in 2010-11. It would pay for this augmentation by reducing base support by $10 million each from the part-time faculty compensation program (currently in the flex item) and EOPS (proposed to be in the flex item).
Figure 20
State Support for Career Technical Education Pathways Initiative (SB 70)
2005-06 Through 2010-11(In Millions)
|
|
Proposition 98
|
QEIAb
|
Totals
|
|
2005-06
|
$20a
|
—
|
$20
|
|
2006-07
|
60a
|
—
|
60
|
|
2007-08
|
10
|
$32
|
42
|
|
2008-09
|
20
|
38
|
58
|
|
2009-10
|
48
|
—
|
48
|
|
2010-11 (Proposed)
|
20
|
48c
|
68
|
|
Totals
|
$178
|
$118
|
$296
|
Increase CCC’s Program and Fiscal Flexibility. The Governor’s plan to add the three categorical programs to the flex item is generally consistent with recommendations we have made in past Analyses. By placing these programs in the flex item, districts would be permitted to decide for themselves how best to allocate funds to targeted purposes. Districts would be free to modify an existing program model to better suit their students, including combining separate pots of categorical funds (such as Matriculation, the Basic Skills Initiative, and Apprenticeships) to address the problem of underprepared students. This could help districts operate their services more efficiently, such as by consolidating categorical programs’ various counseling functions (provided through Matriculation, the Basic Skills Initiative, Puente, MESA, and EOPS, among others). In addition, increasing the number of programs in the flex item could generate savings to districts by eliminating numerous application, accounting, and monitoring requirements.
We recommend that the Legislature approve the Governor’s proposal to add the Basic Skills Initiative, EOPS, and Fund for Student Success to the flex item. In addition, we recommend that the Legislature add the Financial Aid Administration program to the flex item. Doing so would give districts greater ability to select for themselves the best strategies for advising and providing outreach to financially needy students (including perhaps combining elements of the program with other categorical programs that provide services to low-income CCC students).
Fund Pathways Initiative Through QEIA Only. As we discussed in our 2007-08 Analysis of the Budget Bill, the CTE Pathways Initiative recognizes an important need—better alignment and coordination of vocational programs among K-12 schools, community colleges, local employer communities, and other entities. However, this need must be balanced against many other educational needs in the budget year. In particular, the CCC system is faced with extraordinary demand for classes and various student services. It is for this reason that community colleges need enhanced flexibility over how they allocate their funding. Yet, the administration’s proposal works at cross purposes by cutting base support for two programs in the flex item, while increasing funding for the Pathways Initiative. In order to give districts more discretion in how they use their limited resources, we recommend that the Legislature reject the Governor’s proposal to provide $20 million in additional Proposition 98 support for the program, and instead fund the program entirely with $48 million in non-Proposition 98 QEIA funds.
Opportunities for Pathway Efficiencies. Although the administration seeks to fund the initiative at a higher level than our recommended amount, we believe that there are opportunities to achieve similar levels of programmatic activity through efficiencies. For instance, we find significant overlap among the initiative’s numerous grant categories—for example, grants for career exploration and other outreach-related activities aimed at K-12 students are included in two different grant categories. There are also two additional grant categories related to career development just in health-care fields. There are also numerous grant categories related to professional development.
In addition, we note that the Carreer Technical Education Pathways Initiative’s 2008-09 Annual Report (submitted by the CCC Chancellor’s Office and CDE to the Legislature in November 2009) has identified cases where grantees have failed to provide the state with complete and accurate information about their funded activities (such as the number of students served). The Legislature may wish to restrict grants to only those recipients which fully comply with program requirements.
Governor Proposes to Suspend Full-Time Faculty Requirements. Instruction at the community colleges is provided by a combination of full-time (permanent) and part-time (adjunct) faculty. State statute expresses legislative intent that 75 percent of credit instructional hours be taught by full-time faculty, with no more than 25 percent taught by part-time faculty. Implementing regulations developed by BOG (which oversees the statewide system) generally require districts move closer to the 75 percent target by hiring more full-time faculty in years in which they receive additional enrollment funding. While the 75/25 statutory ratio is merely a guideline for districts, the CCC regulation (common known as the full-time Faculty Obligation Number, or “FON”) imposes financial penalties on districts that fail to meet their employment target for full-time faculty members. The Governor proposes to suspend the 75/25 law (and with it, the FON regulation) until 2012-13 in order to provide added flexibility to districts.
No Analytical Basis for Specific Full-Time Faculty Ratio or Number. There are several benefits to colleges employing full-time faculty. For example, full-time faculty members are more likely to provide direction and leadership for program planning and curriculum development. However, it is widely acknowledged that part-time faculty can provide many benefits, as well. For example, they can bring unique and practical experience to the classroom. The use of part-time faculty can also allow colleges to respond quickly to changing student demands and labor-market needs. While the state has an interest in ensuring that districts employ faculty to maximize educational outcomes, we have not seen any evidence that prescribing a specific ratio or number for full- and part-time faculty will do this.
Recommend Suspending Requirement. If the community colleges received additional enrollment growth funds (as proposed by the Governor) and the FON requirement continued to remain in effect, districts could be required to hire new full-time faculty regardless of their own local spending preferences or priorities. For instance, certain districts might prefer to delay making a commitment to employ additional permanent faculty (and instead hire part-time faculty) given the uncertainty of the state’s—and, by extension, CCC’s—current fiscal condition. Other districts may prefer to first hire back valued noninstructional staff that were recently let go, such as tutors. In order to increase districts’ ability to make their own resource-allocation decisions, we thus recommend the Legislature adopt the Governor’s proposal.
Statute Restricts How Districts Allocate Their “General Purpose” Funds. The Governor’s budget does not address another arbitrary budget constraint facing community colleges. Current law requires districts to spend at least 50 percent of their general operating budget on salaries and benefits of faculty and instructional aids engaged in direct classroom instruction. As Figure 21 shows, spending on other faculty such as academic counselors and librarians is not counted as instructional costs. Costs for staff that provide services such as campus safety, facilities maintenance, and information technology services also are excluded (as well as operating costs such as insurance and utilities). Districts that fall below the 50 percent mark can be subject to financial penalties by the statewide BOG.
Figure 21
The 50 Percent Law Limits How Much Districts Can Spend on Non-Instructional Costs
|
Counts Toward 50 Percent Target
|
Does Not Count
|
Outside the 50 Percent Calculation
|
|
Salary and Benefit Costs of:
|
Salary and Benefit Costs of:
|
Costs funded by categorical programs
|
|
Classroom faculty
|
Counselors (faculty)
|
Building and equipment leases
|
|
Instructional aides
|
Librarians (faculty)
|
New equipment
|
|
|
Faculty coordinators (such as nursing)
|
Community education
|
|
|
Faculty directors (such as EOPSa)
|
|
|
|
Release time for department chairs
|
|
|
|
Non-faculty in departments
|
|
|
|
Deans and other administrators
|
|
|
|
Board of Trustees
|
|
|
|
Admissions and records staff
|
|
|
|
Business services staff
|
|
|
|
Campus safety staff
|
|
|
|
Facilities and maintenance staff
|
|
|
|
Human resources staff
|
|
|
|
Computer technical support staff
|
|
|
|
Operating Costs:
|
|
|
|
Utilities
|
|
|
|
Insurance
|
|
|
|
Legal
|
|
|
|
Audit fees
|
|
|
|
Travel and conference expenses
|
|
|
|
Materials and supplies
|
|
|
|
Replacement equipment
|
|
Law Has Effect of Shifting District Spending From Vital Support Services. The law, which dates back to 1959, was created presumably to ensure that noninstructional functions (such as administrators’ salaries) do not squeeze out course section offerings. Yet, districts already have a strong fiscal incentive to provide classes to students, as the CCC’s funding model is based primarily on the number of students they enroll and instruct in classes. (Moreover, districts can increase their instructional costs simply by raising faculty salaries rather than hiring more faculty.)
Furthermore, as we discussed in
Back to Basics: Improving College Readiness of Community College Students, most districts hover near the 50 percent threshold (the statewide average in 2008-09 was about 52 percent). This law can force core student-support services such as counseling and library services to be funded at a lower level than what a campus would otherwise desire. This is problematic because research in recent years consistently has concluded that support services outside the classroom are essential to student success. This is particularly true given that the vast majority of CCC students arrive unprepared for college-level work and often need extra one-on-one help and advising.
The law is arbitrary in many ways, as well. For example, the prorated costs of a counselor who teaches a class on choosing a major and related subject matter “counts” toward the 50 percent law, but the portion of personnel costs for the same counselor who later that day advises a student in her office on the same issue does not.
Recommend Amending Law to Include Counselors and Librarians. As with the full-time faculty requirements discussed above, we find no evidence that this policy, which sets arbitrary restrictions on how colleges can allocate resources, improves student outcomes. Indeed, by limiting districts flexibility to respond to local needs, they can impede the ability of community colleges to provide adequate support services that improve student performance. In order to provide colleges with the flexibility they need to provide the best mix of services for their students, we recommend amending statute to include expenditures on counselors and librarians as part of instructional costs. Alternatively, the Legislature could take the same approach as we recommend for the 75/25 law and suspend it until 2012-13.
Bond Funds Drying Up. The Governor’s budget proposal includes no capital outlay projects for UC or CSU, and proposes a limited capital outlay program of four projects for CCC. Such a limited proposal reflects the fact that all three segments have essentially exhausted their general obligation bond balances. As shown in Figure 22, the lack of new general obligation bond funds has considerably slowed the amount of spending on higher education capital outlay projects in recent years.
Figure 22
Higher Education Capital Outlay Appropriations
(In Millions)
|
|
2007-08
|
2008-09
|
2009-10
|
Proposed
2010-11
|
|
University of California
|
|
|
|
|
|
General obligation bonds
|
$450
|
$57
|
$31
|
—
|
|
Lease revenue bonds
|
70
|
205
|
—
|
—
|
|
Subtotals
|
($520)
|
($261)
|
($31)
|
—
|
|
California State University
|
|
|
|
|
|
General obligation bonds
|
$417
|
$72
|
$16
|
—
|
|
Lease revenue bonds
|
—
|
224
|
—
|
—
|
|
Subtotals
|
($417)
|
($296)
|
($16)
|
—
|
|
California Community Colleges
|
$536
|
$444
|
$194
|
$32
|
|
Totals
|
$1,473
|
$1,001
|
$241
|
$32
|
The Legislature approved $428 million in lease revenue bonds for UC and CSU projects in 2008-09, but rejected the Governor’s proposal for additional lease-revenue bond projects in 2009-10. At this time, the approved lease-revenue bond projects have not moved forward due to the continued freeze on interim financing from the Pooled Money Investment Account. Meanwhile, the segments have been able to move forward on many nonstate-funded projects—such as those funded with revenue bonds or local funds.
Modest CCC Proposal. The Governor’s budget includes reversions of $28 million in general obligation bonds from three CCC projects, which the local community college districts no longer wish to pursue due to changing priorities or lack of local funds. The unappropriated balance of CCC’s approved general obligation bonds, combined with funds from the three proposed reversions, would be sufficient to cover the $32 million in costs of the four proposed projects. The proposed funding would complete three projects previously funded by the state and fully fund one new project. Although the Governor’s proposal would fund the completion of the three continuing projects, there would still be 13 community college projects that received state funding for preliminary plans and working drawings in previous years that lack sufficient funding to complete. The estimated cost of completing these 13 projects would be approximately $195 million.
New Proposals in May? The Governor’s budget proposal states that the administration intends to propose funding for additional higher education facilities in the May Revision. There are no details on the source of funding for any additional projects. The administration will also likely seek reappropriations for various projects delayed by the state’s interim financing freeze and other factors. We would recommend that the Legislature exercise heightened scrutiny in reviewing new projects proposed in May and any reappropriation requests, as projects approved in previous years may no longer be high priorities due to the state’s fiscal situation and changes in higher education such as declining enrollments.
Return to LAO 2010-11 Budget: Higher Education Table of Contents
Return to LAO 2010-11 Budget: Full Table of Contents