Report in PDF
Brief
January 23, 2024Trends in Higher Education
Student Access
- California's Higher Education System
- Enrollment Drivers
- Enrollment Levels
- Undergraduate Enrollment
- Undergraduate Demographics
- First-Time Freshmen
- Transfer Students
- Emerging CCC Enrollment Strategies
- STEM Enrollment
- Online Enrollment
- Graduate Enrollment
Introduction
This brief is the first of a new six-part analytical series focused on higher education trends. Each part of the series hones in on a major area of higher education, beginning with student access, followed by college affordability, student outcomes, finance, faculty and staff, and facilities. The series has two main objectives. The first is to help legislators, staff, and the general public track many of the key changes that higher education has undergone over the past few decades. The second is to help legislators and staff leverage their better understanding of the past to aid them in better navigating the future. To this end, each brief is punctuated by key issues for legislators to consider as they move forward in making higher education policy and budget decisions.
The six briefs within the series each contains a set of infographics highlighting trends over time. In compiling the series, we draw primarily from data sources at the federal, state, and segment levels, as these sources tend to contain the most relevant, accurate, and complete data available on higher education policy and fiscal issues. We tend to provide data for the past one to three decades. We select the exact time period for each chart by considering the availability of the particular data at issue, comparability of the reported data over time, and the most interesting trends emanating from the data. Because the focus is on trends over time, we adjust funding and spending data for inflation, such that the infographics show changes in real terms. Throughout the series, we give greatest attention to trends in California, but we also cover national trends when helpful for broader context.
Whereas this 2024 series focuses on higher education changes over time, California’s Education System: A 2019 Guide explains the inner workings of the state’s education system. Much of that guide remains relevant today and can assist those who are looking for more basic information on education policy and fiscal matters in California.
California's Higher Education System
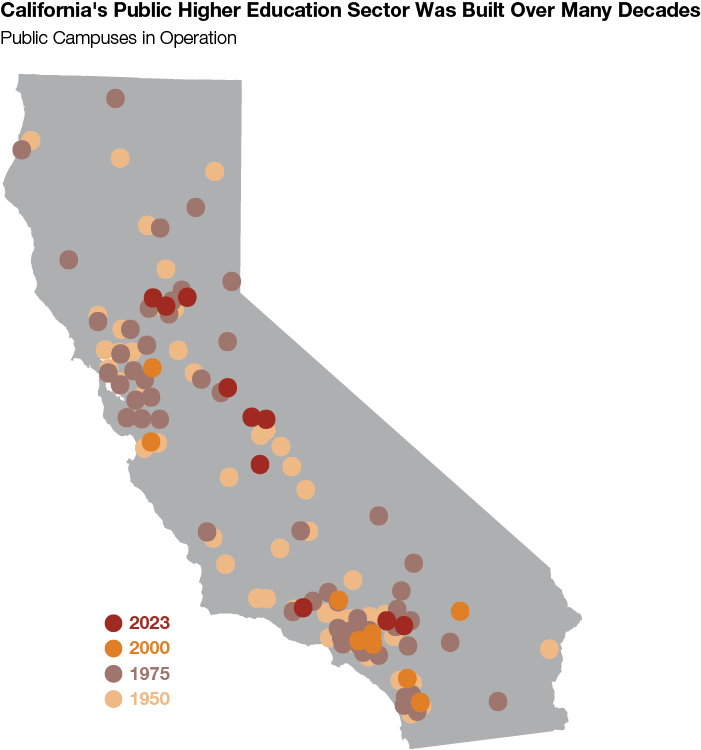
California’s public higher education sector consists of the California Community Colleges (CCC), California State University (CSU), and University of California (UC). The number of public colleges and universities nearly doubled between 1950 and 1975—reflecting demographic and policy changes. Growth in the public sector has continued since 1975 but at a slower pace.
Number of Public Campuses in Operation
|
1900 |
1950 |
1975 |
2000 |
2023 |
|
|
CCC |
— |
51 |
101 |
108 |
116 |
|
CSU |
4 |
12 |
20 |
22 |
23 |
|
UC |
2 |
4 |
9 |
9 |
10 |
|
Totals |
6 |
67 |
130 |
139 |
149 |
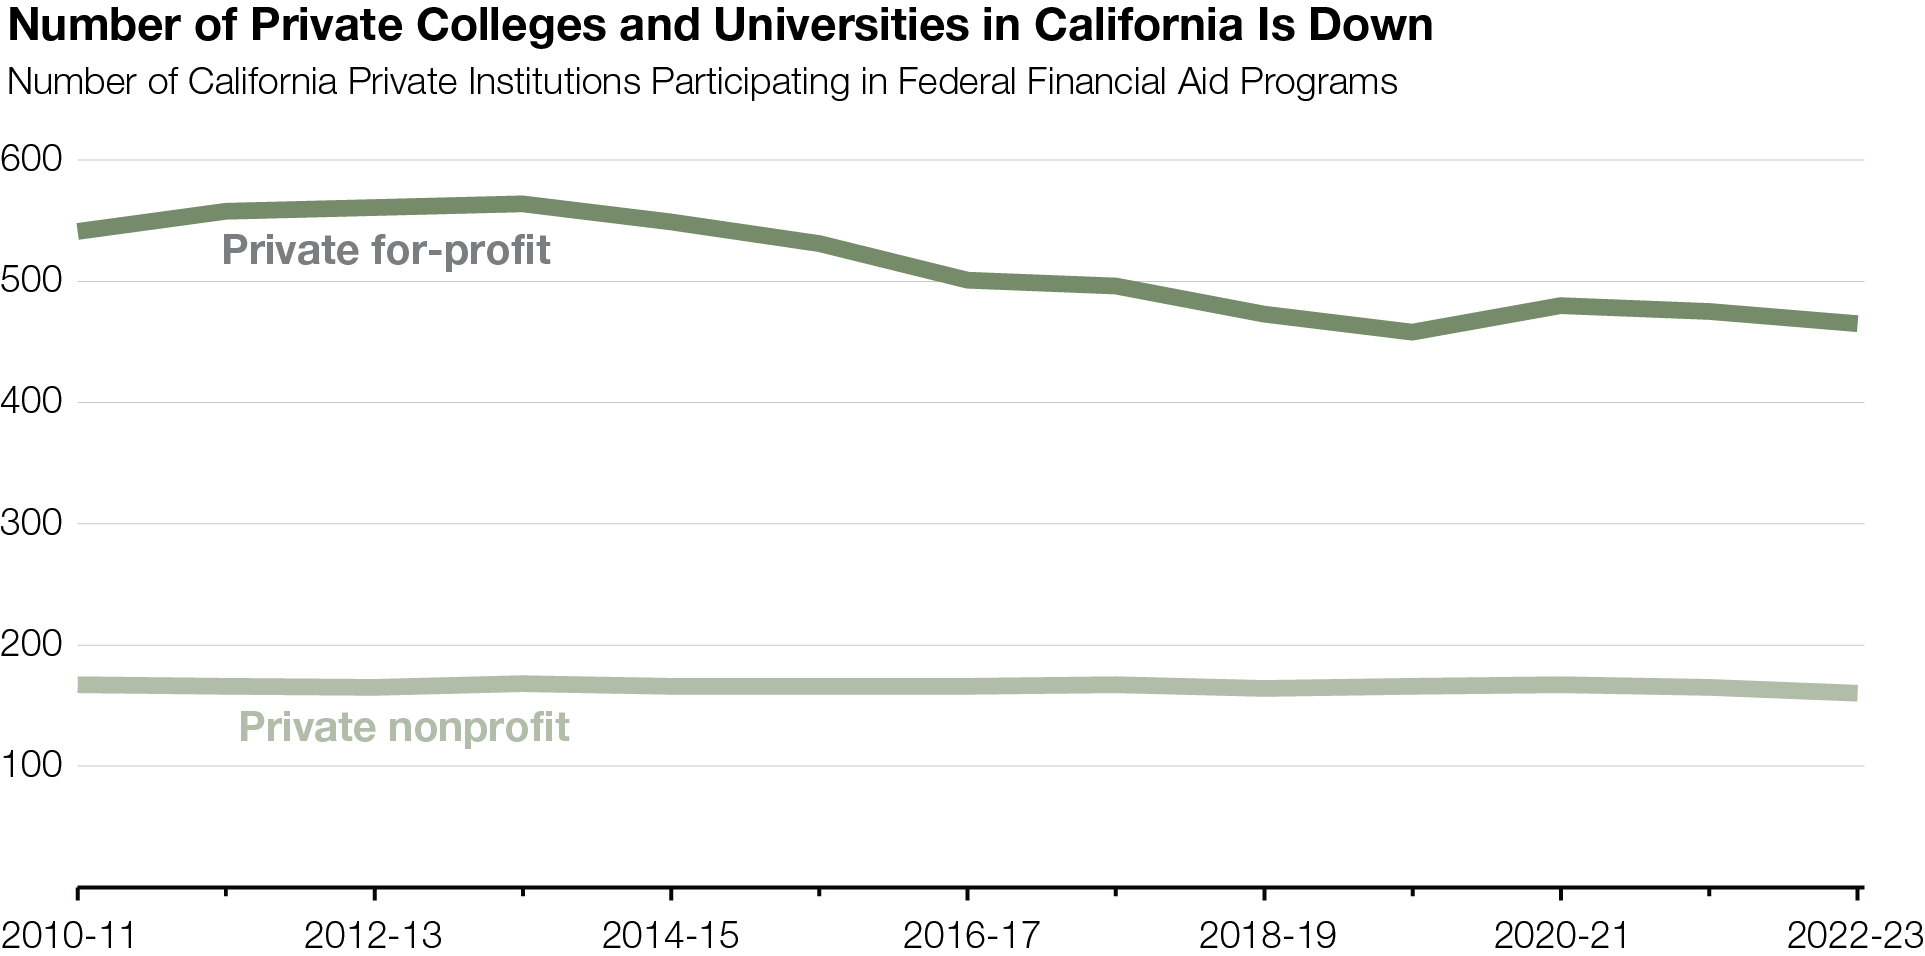
Since 2013-14, the number of private for-profit institutions in California participating in federal financial aid programs has declined by 23 percent. The number of private nonprofit institutions, however, has remained relatively steady.
Enrollment Drivers
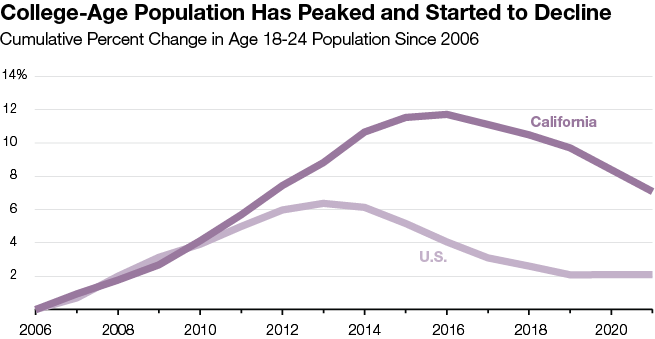
Since peak levels, the college-age population has shrunk by nearly 1.3 million (4 percent) nationally and nearly 175,000 (4.1 percent) in California.
College Participation Rate Has Dipped Since 2017-18
Percent of California Public High School Completers Enrolling in Postsecondary Education by Segment
|
Any College |
CCC |
CSU |
UC |
In-State Private |
Out of State |
|
|
2014-15 |
64% |
37% |
12% |
6% |
3% |
7% |
|
2015-16 |
67 |
38 |
12 |
8 |
3 |
7 |
|
2016-17 |
65 |
36 |
12 |
7 |
3 |
6 |
|
2017-18 |
68 |
37 |
13 |
7 |
3 |
7 |
|
2018-19 |
65 |
36 |
12 |
7 |
3 |
7 |
|
2019-20 |
63 |
34 |
12 |
8 |
3 |
7 |
|
2020-21 |
62 |
32 |
12 |
8 |
3 |
8 |
|
Note: Chart reflects the percent of public high school completers who enrolled at each segment within 12 months of completing high school. |
||||||
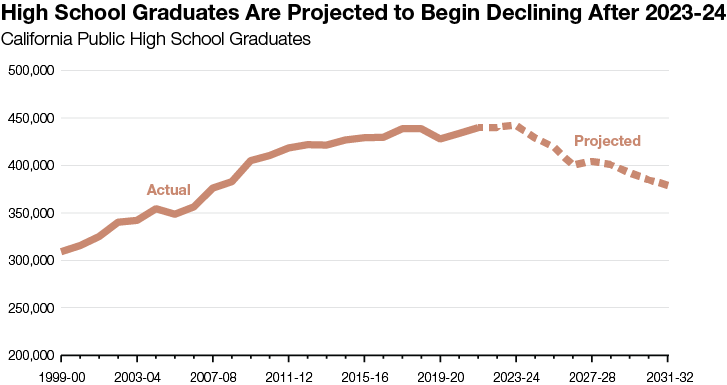
The number of public high school graduates in California is expected to peak in 2023-24, followed by several years of declines. By 2031-32, high school graduates are projected to be 14 percent below the peak level.
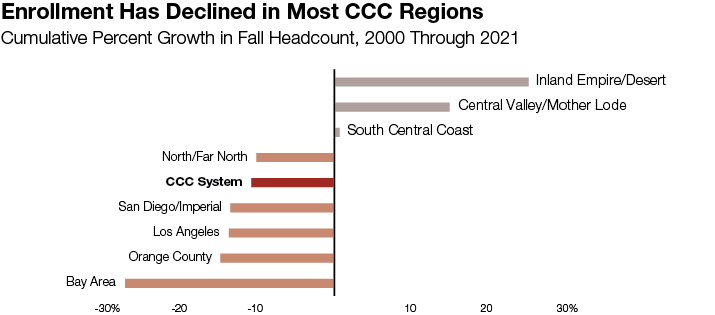
Enrollment Levels
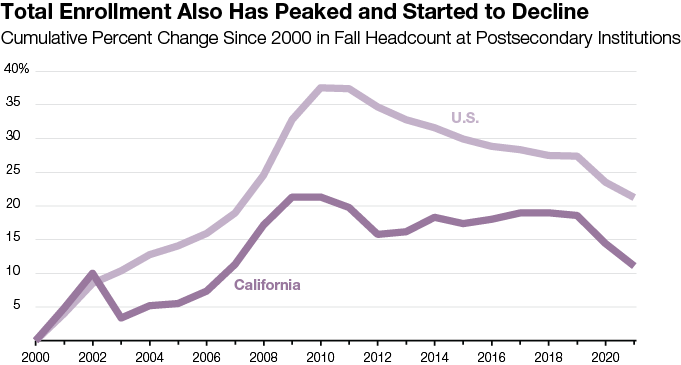
Since peak levels, total higher education enrollment has shrunk by about 2.5 million students (12 percent) nationally and 240,000 students (8.4 percent) in California.
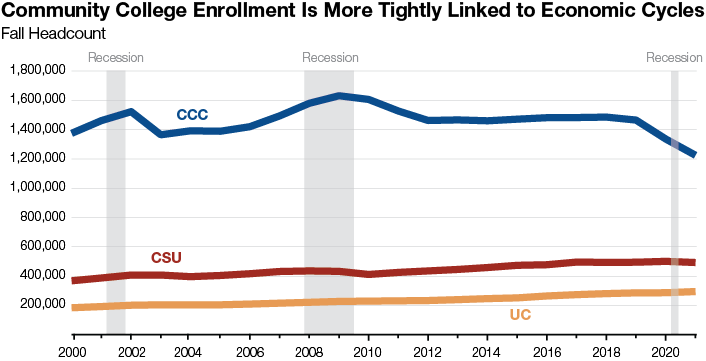
Community college enrollment tends to be countercyclical—increasing during recessions, as job markets weaken. The COVID-19 recession was an exception, as it was short-lived and followed by a very strong job market and declines in community college enrollment. Universities tend to be less affected by economic cycles.
Undergraduate Enrollment
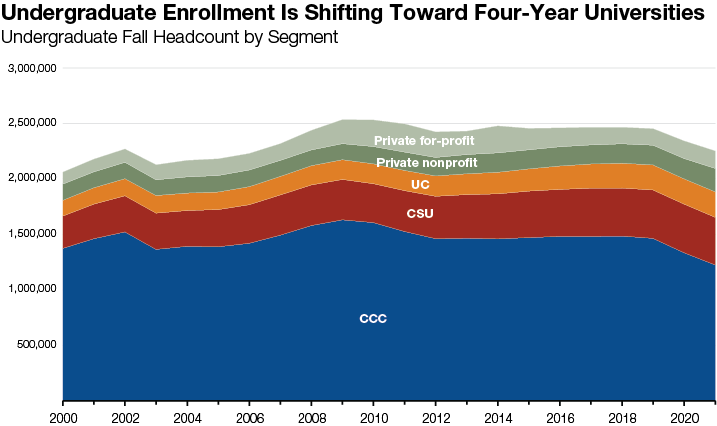
As community college enrollment has declined, overall enrollment at four-year universities has grown. Since 2010, CSU has grown from 14 percent to 19 percent of undergraduate enrollment, UC has grown from 7 percent to 10 percent, and the private nonprofit sector has grown from 6 percent to 9 percent.
Key Issue
As the high school graduate and college-age populations decline, the segments are likely to begin competing more for students. The Legislature will continue to face key decisions about how much enrollment to fund at each of the public segments. Such decisions could have important implications for the size of each segment in the years to come.
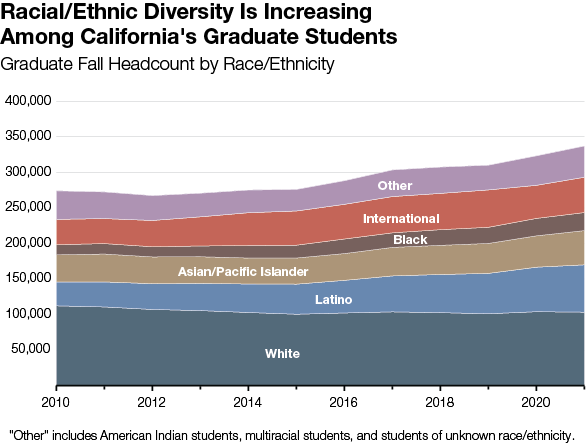
Undergraduate Demographics
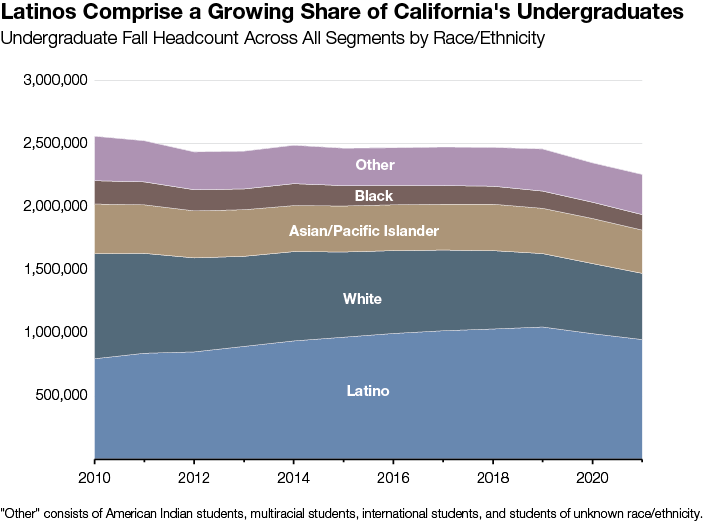
From 2010 to 2021, the share of undergraduates who are Latino increased notably (from 31 percent to 42 percent). The share of undergraduates in other racial/ethnic groups declined, with the largest decline among white students (from 33 percent to 23 percent).
Latino and Black Students Continue to Access UC at Lower Rates
Racial/Ethnic Distribution of Californians Age 18-24 and UC Resident Undergraduates
|
2000 |
2010 |
2021 |
||||||
|
CA |
UC |
CA |
UC |
CA |
UC |
|||
|
Latino |
42% |
14% |
44% |
20% |
50% |
31% |
||
|
White |
36 |
42 |
33 |
33 |
26 |
23 |
||
|
Asian/Pacific Islander |
13 |
39 |
14 |
42 |
15 |
40 |
||
|
Black |
7 |
4 |
8 |
4 |
8 |
5 |
||
|
American Indian |
1 |
1 |
1 |
1 |
1 |
1 |
||
|
Totals |
100% |
100% |
100% |
100% |
100% |
100% |
||
|
Note: Figure excludes individuals of unknown race/ethnicity or another race not listed in the figure. |
||||||||
In 1996, California voters approved Proposition 209 banning the consideration of race, sex, color, ethnicity, or national origin in public programs, including admission to public universities. Since then, UC (the state's most selective public segment) has adopted certain other practices to promote a diverse student body, including a "comprehensive review" policy beginning in fall 2002 that considers applicants' academic and non-academic achievements in the context of their opportunities and life experiences.
In 2023, the U.S. Supreme Court ruled that race-based admissions were unconstitutional, effectively ending the consideration of race at California’s private institutions too.
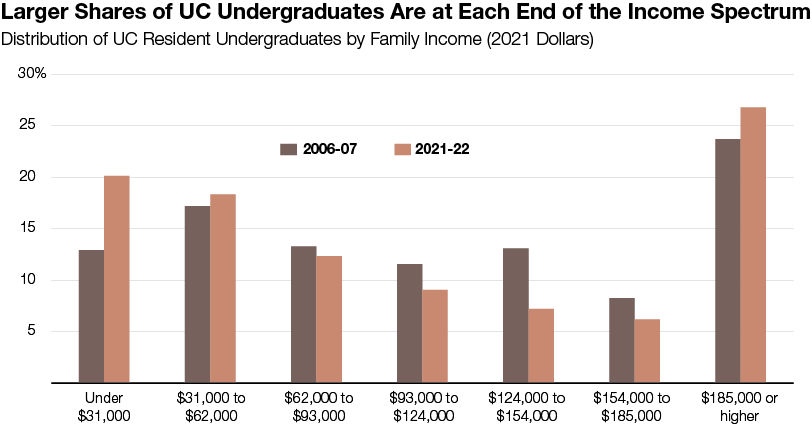
UC and CSU also report data on “first-generation students”—specifically the percent of undergraduates whose parents do not have a bachelor’s degree or higher. From 2013 to 2022, the share of undergraduates who are first generation fell from 42 percent to 37 percent at UC and from 56 percent to 53 percent at CSU.
First-Time Freshmen
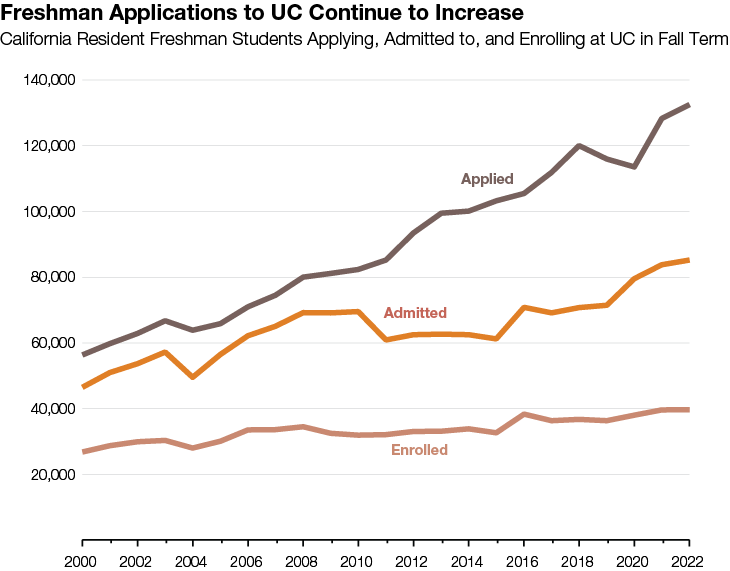
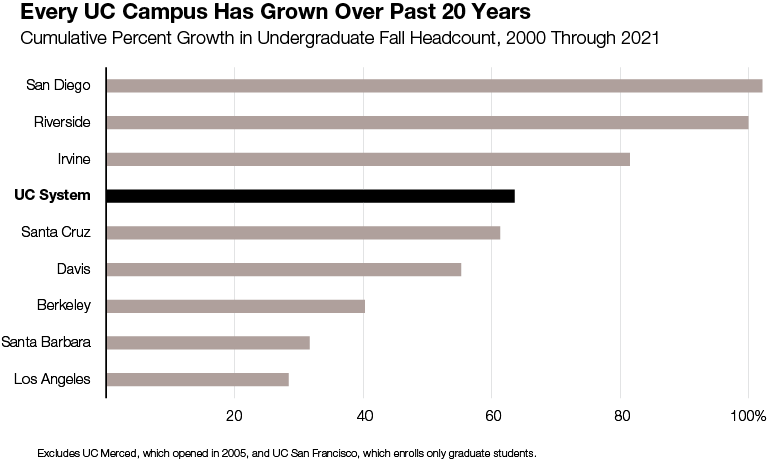
Since 2000, more high schools have begun offering college-preparatory courses and more students have completed those courses. Additionally, UC has made several changes to its admission policies, including establishing comprehensive review and removing the requirement to submit standardized test scores. These factors have resulted in more students potentially being eligible to attend as freshmen. Notably, even as California’s college-age population has declined steadily since 2016, UC freshman applications have continued rising (up 26 percent).
Freshman Admission Rates Are
Decreasing at Nearly All UC Campuses
Percent of California Resident Freshman Applicants
Who Are Admitted in Fall Term
|
2002 |
2012 |
2022 |
|
|
Los Angeles |
25% |
19% |
9% |
|
Berkeley |
26 |
18 |
14 |
|
Irvine |
58 |
38 |
18 |
|
San Diego |
44 |
32 |
24 |
|
Santa Barbara |
52 |
42 |
27 |
|
Davis |
64 |
45 |
32 |
|
Santa Cruz |
84 |
61 |
43 |
|
Riverside |
83 |
61 |
67 |
|
Merced |
— |
77 |
92 |
Under UC’s freshman referral policy, eligible applicants who are not admitted to their campus(es) of choice are redirected to the Merced campus. On average, fewer than 2 percent of redirected freshmen have enrolled at the Merced campus since this policy has been in place.
Freshman Admission Rates Are
Increasing at Most CSU Campuses
Number of CSU Campuses by Fall Admission Rate
for California Resident Freshmen
|
Admission Rate |
2018 |
2019 |
2020 |
2021 |
2022 |
|
90% or more |
1 |
2 |
3 |
12 |
12 |
|
75-90% |
3 |
8 |
12 |
6 |
6 |
|
50-75% |
13 |
9 |
5 |
2 |
2 |
|
Less than 50% |
6 |
4 |
3 |
3 |
3 |
|
Totals |
23 |
23 |
23 |
23 |
23 |
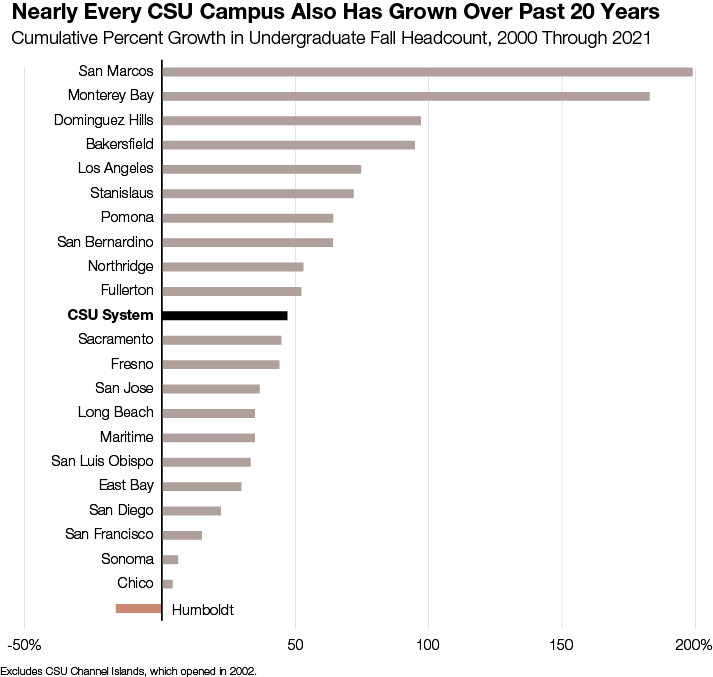
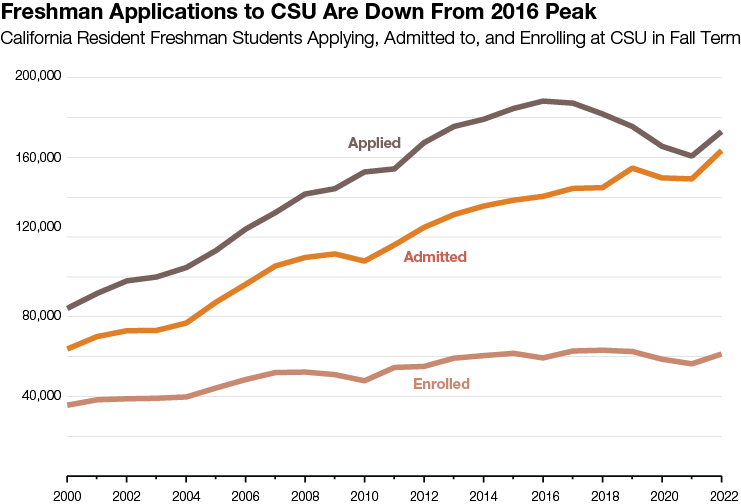
Though CSU admission rates are increasing, some CSU campuses and programs remain impacted, with more student demand than enrollment slots. To manage demand, impacted campuses and programs adopt stricter admissions criteria. Six CSU campuses have all their academic programs impacted in 2023-24. Students who are not admitted to their CSU campus(es) of choice are redirected to other CSU campuses that have space.
Transfer Students
Transfer Admission Rates Are Up at
Some UC Campuses, Down at Others
Transfer Admission Rates for California Residents in Fall Term
|
2002 |
2012 |
2022 |
|
|
Berkeley |
32% |
22% |
25% |
|
Los Angeles |
33 |
28 |
25 |
|
Irvine |
67 |
42 |
41 |
|
Santa Barbara |
70 |
50 |
58 |
|
Davis |
70 |
56 |
60 |
|
San Diego |
61 |
42 |
61 |
|
Riverside |
73 |
64 |
61 |
|
Santa Cruz |
69 |
67 |
61 |
|
Merced |
— |
48 |
64 |
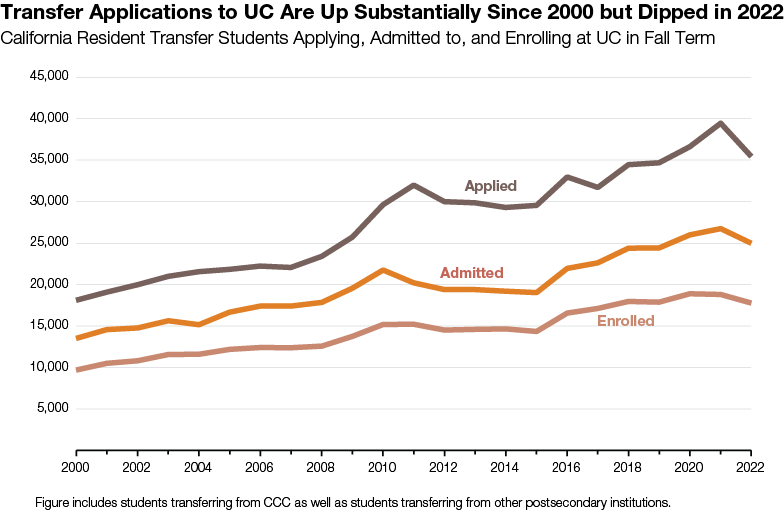
Under UC’s referral policy, transfer applicants who meet systemwide eligibility requirements but are not admitted to their campus(es) of choice are redirected to the Merced, Riverside, and Santa Cruz campuses.
Transfer Admission Rates Are Increasing at Most CSU Campuses
Number of CSU Campuses by Fall Admission Rate for California Resident Transfer Students
|
Admission Rate |
2018 |
2019 |
2020 |
2021 |
2022 |
|
90% or more |
— |
2 |
4 |
5 |
1 |
|
75-90% |
7 |
6 |
5 |
5 |
11 |
|
50-75% |
10 |
6 |
10 |
9 |
8 |
|
Less than 50% |
6 |
9 |
4 |
4 |
3 |
|
Totals |
23 |
23 |
23 |
23 |
23 |
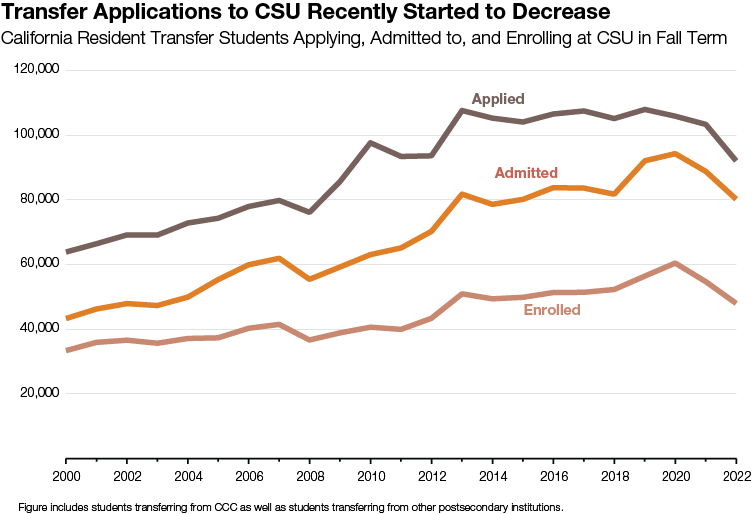
Key Issue
With the segments competing more intensely with one another for students, the Legislature is likely to face fundamental decisions about each segment’s mission, including which programs and degrees each segment offers. As with enrollment growth decisions, these decisions could have important implications for the size and cost of each segment in the years to come.
Emerging CCC Enrollment Strategies
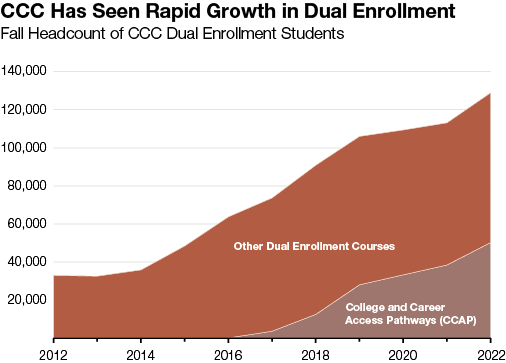
Although overall CCC enrollment has declined, enrollment has increased among certain student populations—including high school students dually enrolled in college courses. Since 2016, growth in dual enrollment has been due in large part to CCAP, a program that allows high school students to take college-level classes on a high school campus. As of fall 2022, dual enrollment students account for about 10 percent of total CCC headcount (and about 5 percent of total CCC full-time equivalent students).
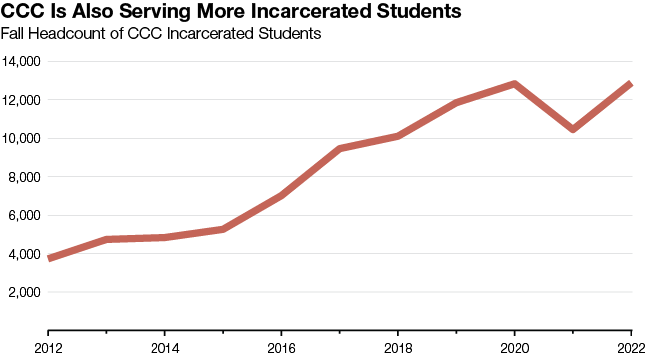
In 2015, the federal government created a pilot program offering certain incarcerated students Pell Grants. Beginning in July 2023, incarcerated students are more broadly eligible for Pell Grants.
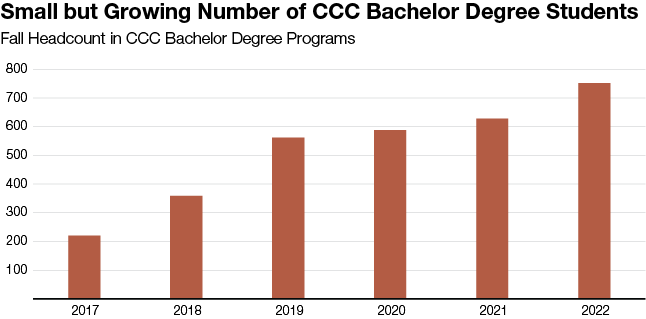
Since 2016, 15 community colleges have offered certain bachelor’s degree programs on a pilot basis. Beginning in 2022, state law authorizes CCC to add up to 30 additional bachelor’s degree programs each year.
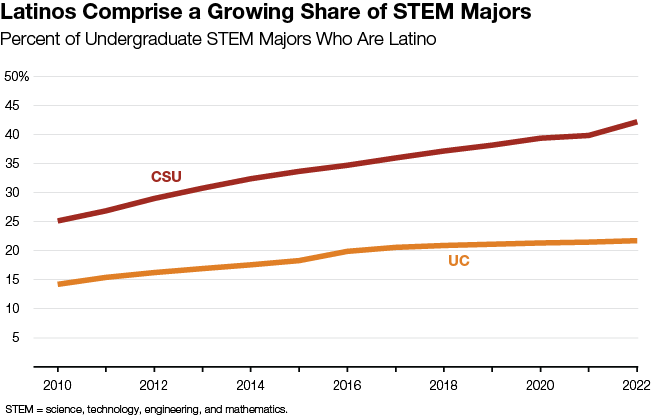
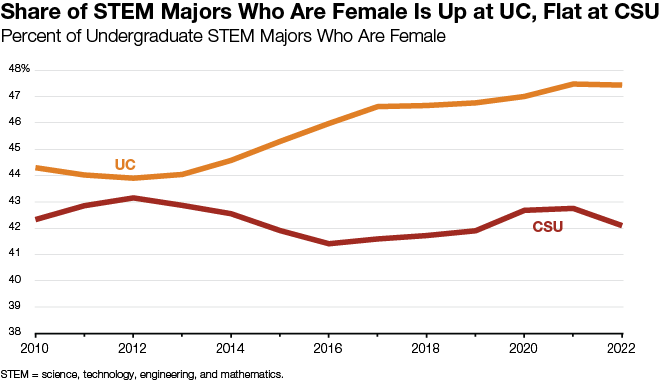
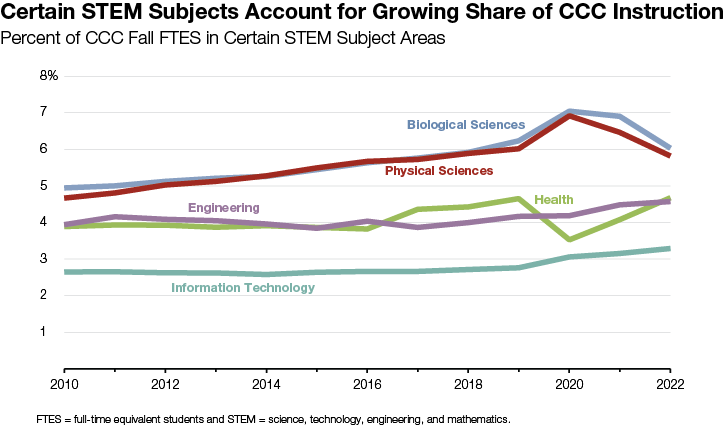
STEM Enrollment
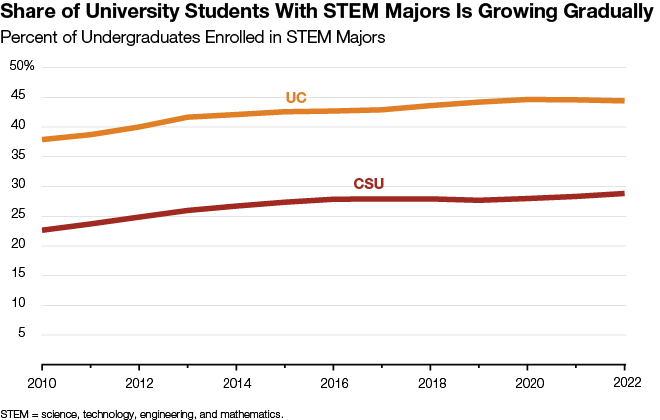
Key Issue
The state’s economy likely will continue to see growth in particular areas, such as health care, which in turn will have implications for the labor force and educational programs. Moving forward, the Legislature will face key decisions about how best to train workers in these areas.
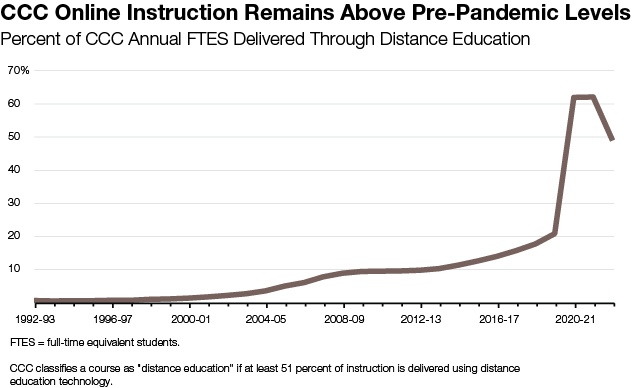
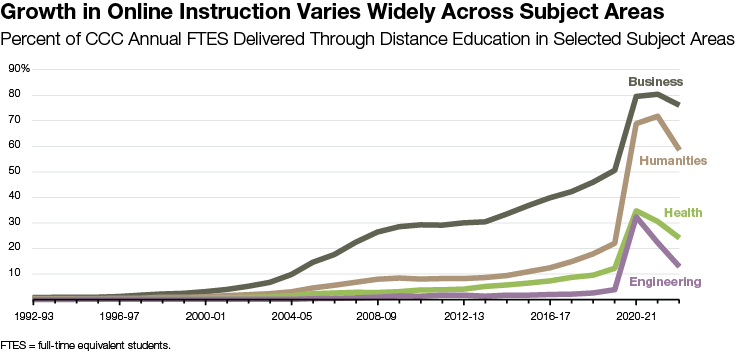
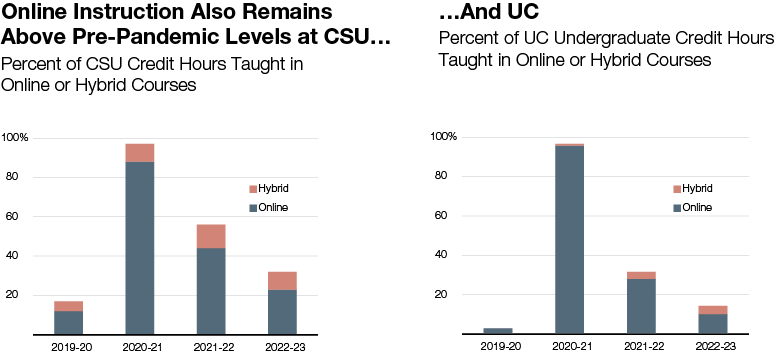
Online Enrollment
Graduate Enrollment
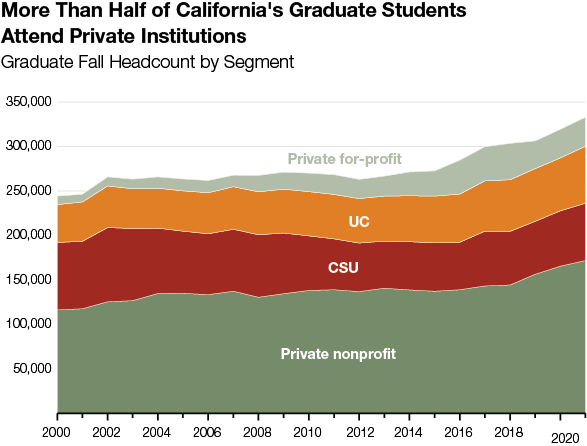
Over the past 20 years, the share of graduate students enrolled at CSU has fallen (from 31 percent to 19 percent), while the share enrolled at each of the other segments has increased.