
 Report in PDF
LAO Report
January 4, 2024State Assistance to Businesses
in Response to COVID‑19
- Introduction
- What Assistance Did the State and Federal Governments Provide?
- What Types of Industries Received More Assistance?
- What Types of Communities Received More Assistance?
- Findings
Introduction
This report provides an analysis of state assistance given to businesses in response to COVID‑19. The first section of this report includes background information on the state and federal programs that provided both broad and targeted relief to businesses. The second section describes the industries that received the most public assistance. The third section describes the types of communities, defined using zip codes, that received more state and federal assistance. The report concludes with some findings and comments for the Legislature. This report fulfills our statutory requirements under Section 16 of Chapter 55 of 2022 (AB 194, Committee on Budget) and Section 22 of Chapter 3 of 2022 (SB 113, Committee on Budget and Fiscal Review).
What Assistance Did the State and Federal Governments Provide?
Pandemic Had Significant Economic Impacts. In early 2020, in response to the onset of the COVID‑19 pandemic, state and local officials took steps to limit the spread of the disease. This included Governor Newsom’s statewide stay‑at‑home order and various other state and local directives that limited daily activities. These efforts, as well as health concerns, sharply depressed economic activity across the state, resulting in unprecedented job losses and major financial challenges for businesses of all sizes. In response, the federal and state governments enacted a variety of policies and programs to aid businesses, including grants, loans, and tax relief.
Federal Business Relief Provided Mainly Through the Paycheck Protection Program (PPP). The single largest business assistance program during the pandemic was PPP, a forgivable loan program created in March 2020. This program provided funding for eligible businesses to borrow money from private lenders. If the businesses met certain conditions, such as maintaining specified employment and compensation levels, they could apply to the federal Small Business Administration (SBA) to have those loans forgiven. The federal government fully covered the costs of these forgiven loans. In authorizing legislation, Congress expressed its intent that SBA should prioritize businesses in underserved and rural markets, including to veterans and businesses owned by economically disadvantaged individuals, women, and businesses in operation for less than two years. Later in 2020, the federal government provided a second round of PPP loans to businesses that had no more than 300 employees and a 25 percent reduction in gross receipts between 2019 and 2020. These second‑round loans were also eligible for forgiveness. In California, about 1 million businesses received about $100 billion in PPP loans from both rounds, including $96 billion in forgiven loans (see Figure 1).
Figure 1
Federal Assistance to Businesses in
California in Response to COVID‑19
(In Billions)
|
Paycheck Protection Program |
|
|
Total loans |
$101.7 |
|
Loans forgiven |
96.4 |
|
Restaurant Revitalization Fund |
5.7 |
|
Shuttered Venue Operators Grants |
2.4 |
|
Economic Injury Disaster Loan Advance Grants |
2.7 |
Federal Government Also Provided Additional Targeted Programs. In addition to PPP, the federal government provided additional, targeted aid to businesses in industries highly impacted by COVID‑19. These programs included:
- Restaurant Revitalization Fund (RRF). Created in March 2021, the RRF provided grants to eligible restaurants, caterers, and bars that experienced a decline in revenue during the pandemic. RRF grants provided restaurants with up to $10 million in lost revenues, but no more than $5 million per physical location. California restaurants received nearly $6 billion from the RRF program.
- Shuttered Venue Operators Grant (SVOG). Created in December 2020, SVOG provided grants to eligible theatres; performing arts organizations; and other cultural institutions, such as museums, zoos, and aquariums. Eligible applicants could qualify for grants that replaced up to 45 percent of their gross earned revenue with a maximum award of $10 million. California venues received about $2 billion in SVOG grants.
- Economic Injury Disaster Loan (EIDL) Advance Grants. Before the onset of the pandemic, through the preexisting EIDL program, the SBA made disaster loans to small businesses. In March 2020, Congress created a new program to advance $10,000 to qualified small business that applied for an EIDL related to the COVID‑19 pandemic. The advances did not need to be repaid, regardless of whether the businesses were eventually approved for a loan. California businesses received nearly $3 billion in pandemic‑related EIDL advance grants.
State Tax Relief Extended to the Various Federal Programs. Typically, federal and state tax laws would treat grants and forgiven loans as taxable business income. In response to the pandemic, however, Congress changed federal laws to exclude the above pandemic‑related business assistance programs from taxable income. The state partially conformed to this federal treatment. Specifically, Chapter 39 of 2020 (AB 1577, Burke) and Chapter 17 of 2021 (AB 80, Burke) partially conformed state tax laws to the federal treatment of forgiven PPP loans and EIDL advance grants. Taxpayers that were publicly traded companies or did not have at least a 25 percent reduction in gross receipts were excluded from this provision. Assembly Bill 194 extended the state’s tax treatment to loan amounts forgiven under the second round of PPP. Senate Bill 113 also excluded businesses’ grants from the RRF and SVOG programs from taxable income.
State Provided Grants to Small Businesses. In addition to the federal programs and state tax relief on that assistance, the state provided its own assistance to businesses in response to COVID‑19. The largest of the state programs was the California Small Business COVID‑19 Relief Grant (SBCRG) program, administered through the Governor’s Office of Business and Economic Development (Go‑Biz). Grant applications and disbursements were administered by Lendistry, a private company and small business lender. Through this program, the state provided grants between $5,000 and $25,000 to eligible small businesses and nonprofits impacted by COVID‑19, depending on their annual gross revenue. To be eligible, businesses needed to meet a variety of criteria, including having: a physical presence in the state, less than $5 million in annual gross revenue, and being in operation since at least June 2019. In total, the state provided about $3.7 billion in grants through to this program.
State Also Provided Additional Targeted Grants. In addition to SBCRG, the state also provided a variety of other, smaller, grant programs for businesses and nonprofits in response to COVID‑19. Similar to the federal programs, some of these were targeted toward specific industries and business types. They are described in the nearby box. (The box does not include state loan programs and/or other tax relief, such as the Main Street tax credit. These programs are not included in this analysis because we do not have business or zip code‑level data for them.)
Other State Grants
California Venues Grant Program. Under this program, the state provided a total of roughly $150 million in competitive grants to support eligible independent live events venues and $15 million to support independent theaters. The maximum award to each venue was the lesser of $250,000 or 20 percent of the venue’s gross earned revenue. Funds were distributed through Lendistry.
California Microbusiness COVID‑19 Relief Grant Program. Under this program, the state provided a total of $50 million in grants to eligible microbusinesses distributed to each county according to its population. The maximum award for each microbusiness was $2,500. Funds were distributed through county government agencies and a consortium of nonprofits.
California Nonprofit Performing Arts Grant Program. Through this program, the state provided roughly $40 million in grants to nonprofit performing arts organizations, including: theater companies and dinner theaters, dance companies, musical groups and artists, and other performing arts companies. To qualify, the performing arts organization needed to be a registered nonprofit and have no more than $2 million in annual gross revenue. Grant amounts to each organization ranged from $25,000 to $75,000 based on annual gross revenue. Funds were distributed through Lendistry.
California Dream Fund. Under this program, the state provided a total of roughly $30 million in grants to seed entrepreneurship and small business creation. New entrepreneurs and small‑business owners completed a training program through select participating centers of the Technical Assistance Expansion Program. Following successful completion of the program, new businesses were eligible to apply for the microgrant, up to $10,000. Funds were distributed through Lendistry.
We Did Not Have Direct Data on Tax Relief on Federal Programs. The remainder of this report analyzes the distribution of state tax relief associated with federal PPP loans and other grant programs, as well as the SBCRG program. We have business‑level data on SBCRG, but do not have direct sources of data on tax relief because businesses’ tax filings do not include information on excluded income. Instead, we have used SBA data on PPP as a proxy for the businesses that would be eligible for tax relief on federal grants and forgiven loans. In particular, businesses were eligible for state tax relief on forgiven loans if they had at least a 25 percent reduction in gross receipts—and that was the same requirement for eligibility for the second round of PPP. Therefore, as an indicator of which businesses received PPP‑related tax relief, we use data on California businesses that received loan forgiveness on exactly two rounds of PPP. As a result, throughout this report, for all federal programs, we report figures in terms of total loans and grants provided to businesses in California, not the specific amount of tax relief.
What Types of Industries Received More Assistance?
This section describes the types of industries that received more state tax relief associated with PPP loans and other federal grants and SBCRG.
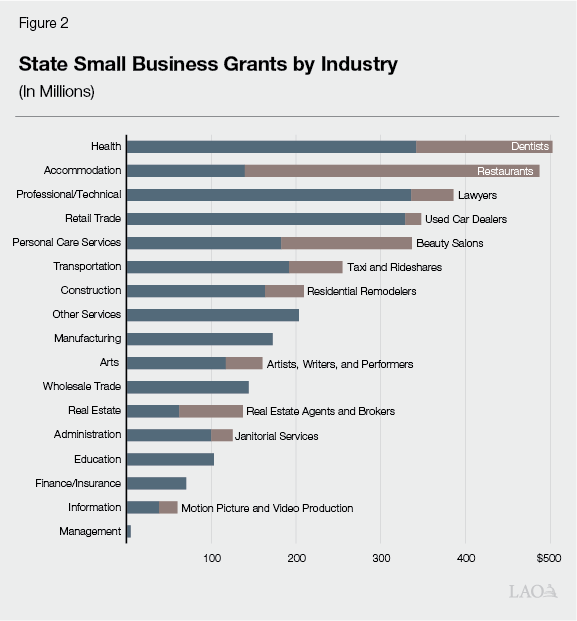
Most State Grants Went to Businesses in Health, Accommodation, and Professional/Technical Services. Figure 2 shows the distribution of SBCRG by industry. As the figure shows, most grants went to businesses in the following industries: health; accommodation (mostly restaurants); and professional/technical, which includes lawyers, accountants, and engineers.
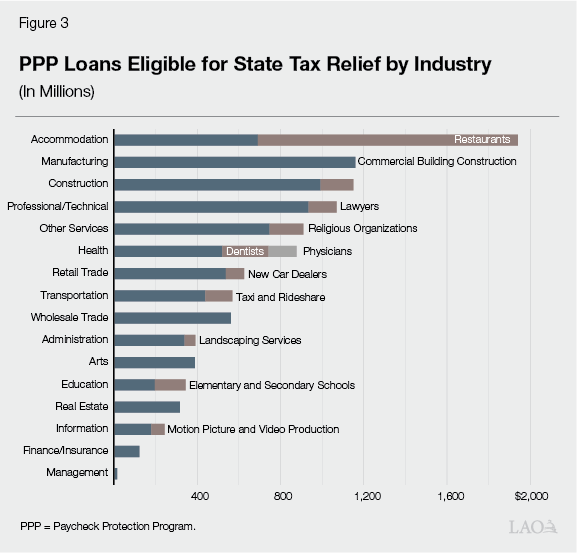
Most PPP‑Related Tax Relief Went to Businesses in Accommodation, Manufacturing, and Construction. Figure 3 shows the distribution of PPP loans eligible for state tax relief by industry. As the figure shows, most of these forgiven loans went to businesses in the following industries: accommodation (mostly restaurants), manufacturing, and construction.
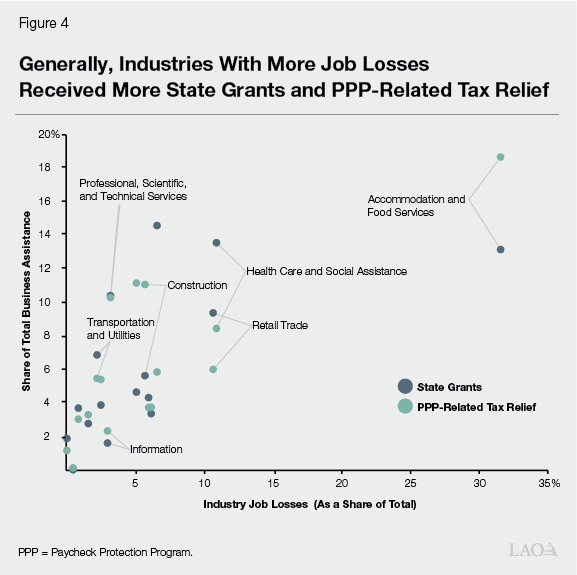
State Assistance Generally Targeted Industries With More Job Losses. We examined whether or not industries that received more state assistance were also more impacted by the pandemic—as measured by job losses. Figure 4 shows the share of each industry’s state grants and PPP loans eligible for tax relief compared to its share of total job losses (measured between February 2020 and April 2020). The figure shows a positive relationship, meaning more of both types of assistance went to industries with more job losses. (This relationship appears to be driven by more than industry size.) For example, the accommodation and food services industry, in particular, was the most highly impacted in job loss terms and also received proportionally more assistance. Also, for most industries, there appears to be a slightly stronger relationship between state grants and job losses compared to PPP forgiven loans and job losses, perhaps indicating the state grants—although much smaller—were slightly better targeted toward the more impacted industries.
What Types of Communities Received More Assistance?
This Analysis Focuses on Community‑Level, Not Business‑Level, Impacts. Ideally, our analysis would have considered both business‑ and community‑level impacts of state and federal assistance to California businesses during the pandemic. However, we do not have detailed data on the demographic and economic characteristics of business owners for either program, which means we must largely focus only on community‑level impacts. For this analysis, we use zip codes—the smallest unit of geography that we have available. In the remainder of this section, using zip code‑level data, we examine a few different characteristics of the communities that received more state and federal assistance, including: geography, income, and race and ethnicity.
Urban and Metropolitan Zip Codes
Urban Zip Codes Received More PPP‑Related Tax Relief and State Grants. Figure 5 shows that, on a per‑business basis, zip codes in metropolitan areas received more PPP loans eligible for state tax relief and SBCRG compared to other types of zip codes. (The nearby box provides some more information on the sources of data and definitions supporting this analysis.) In both cases, rural zip codes received the least assistance per businesses. This finding is consistent with some conversations we had with business groups who indicated that they used pre‑existing networks and relationships to disseminate information about state and federal programs. These groups expressed that they were less likely to have existing communication channels with rural businesses and found them to be generally more difficult to reach, in some cases due to how diffuse and distributed they are across large geographical areas. This, in particular, posed a challenge for increasing awareness of the state’s grant programs, which were much smaller and less well‑known than federal PPP loans.
Figure 5
Urban Areas Received More
Assistance Than Rural Areas
Amount of Loans or Grants Per Establishment
|
PPP Loans Forgiven |
State Grants |
|
|
Urban—Metropolitan |
$97,651 |
$3,690 |
|
Small Town |
96,594 |
2,668 |
|
Urban—Micropolitan |
74,984 |
2,842 |
|
Rural |
66,220 |
2,639 |
|
PPP = Paycheck Protection Program. |
||
Data Sources and Definitions
Geography. We used the U.S. Department of Agriculture’s rural‑urban commuting codes to categorize all zip codes in the state according to whether they are: metropolitan, micropolitan, small town, or rural. A metropolitan area is an area that has a city with at least 50,000 residents. A micropolitan area is one that has a city with 10,000 to 50,000 residents. A small town has more than 2,500 residents but fewer than 10,000 residents. All other areas are considered rural. We used the Census Bureau’s core‑based statistical areas to define zip codes according to major metro region.
Income. We used data from the 2021 American Community Survey (ACS) to measure median household income for each zip code. We then placed all California zip codes in one of four categories: low income (less than or equal to $61,000), medium‑low income ($61,001 to $81,000), medium‑high income ($81,001 to $110,000), and high income (greater than $110,000). Statewide, the median zip code had median household income of nearly $89,000 in 2021.
Race and Ethnicity. We used ACS data to determine the share of residents of each zip code who are white, Black, Asian, or Hispanic/Latino. We define a zip code as “higher representation” of a specific race or ethnicity if the zip code is above the 90th percentile among all other zip codes in terms of its percentage of that race or ethnicity. Importantly, this does not necessarily mean the zip codes have majorities of residents with this race or ethnicity. Using this measure, “high representation white” is defined as zip codes where at least 85 percent of residents are white, “high representation Hispanic/Latino” is 71 percent, “high representation Black” is 10 percent, and “high representation Asian” is 28 percent.
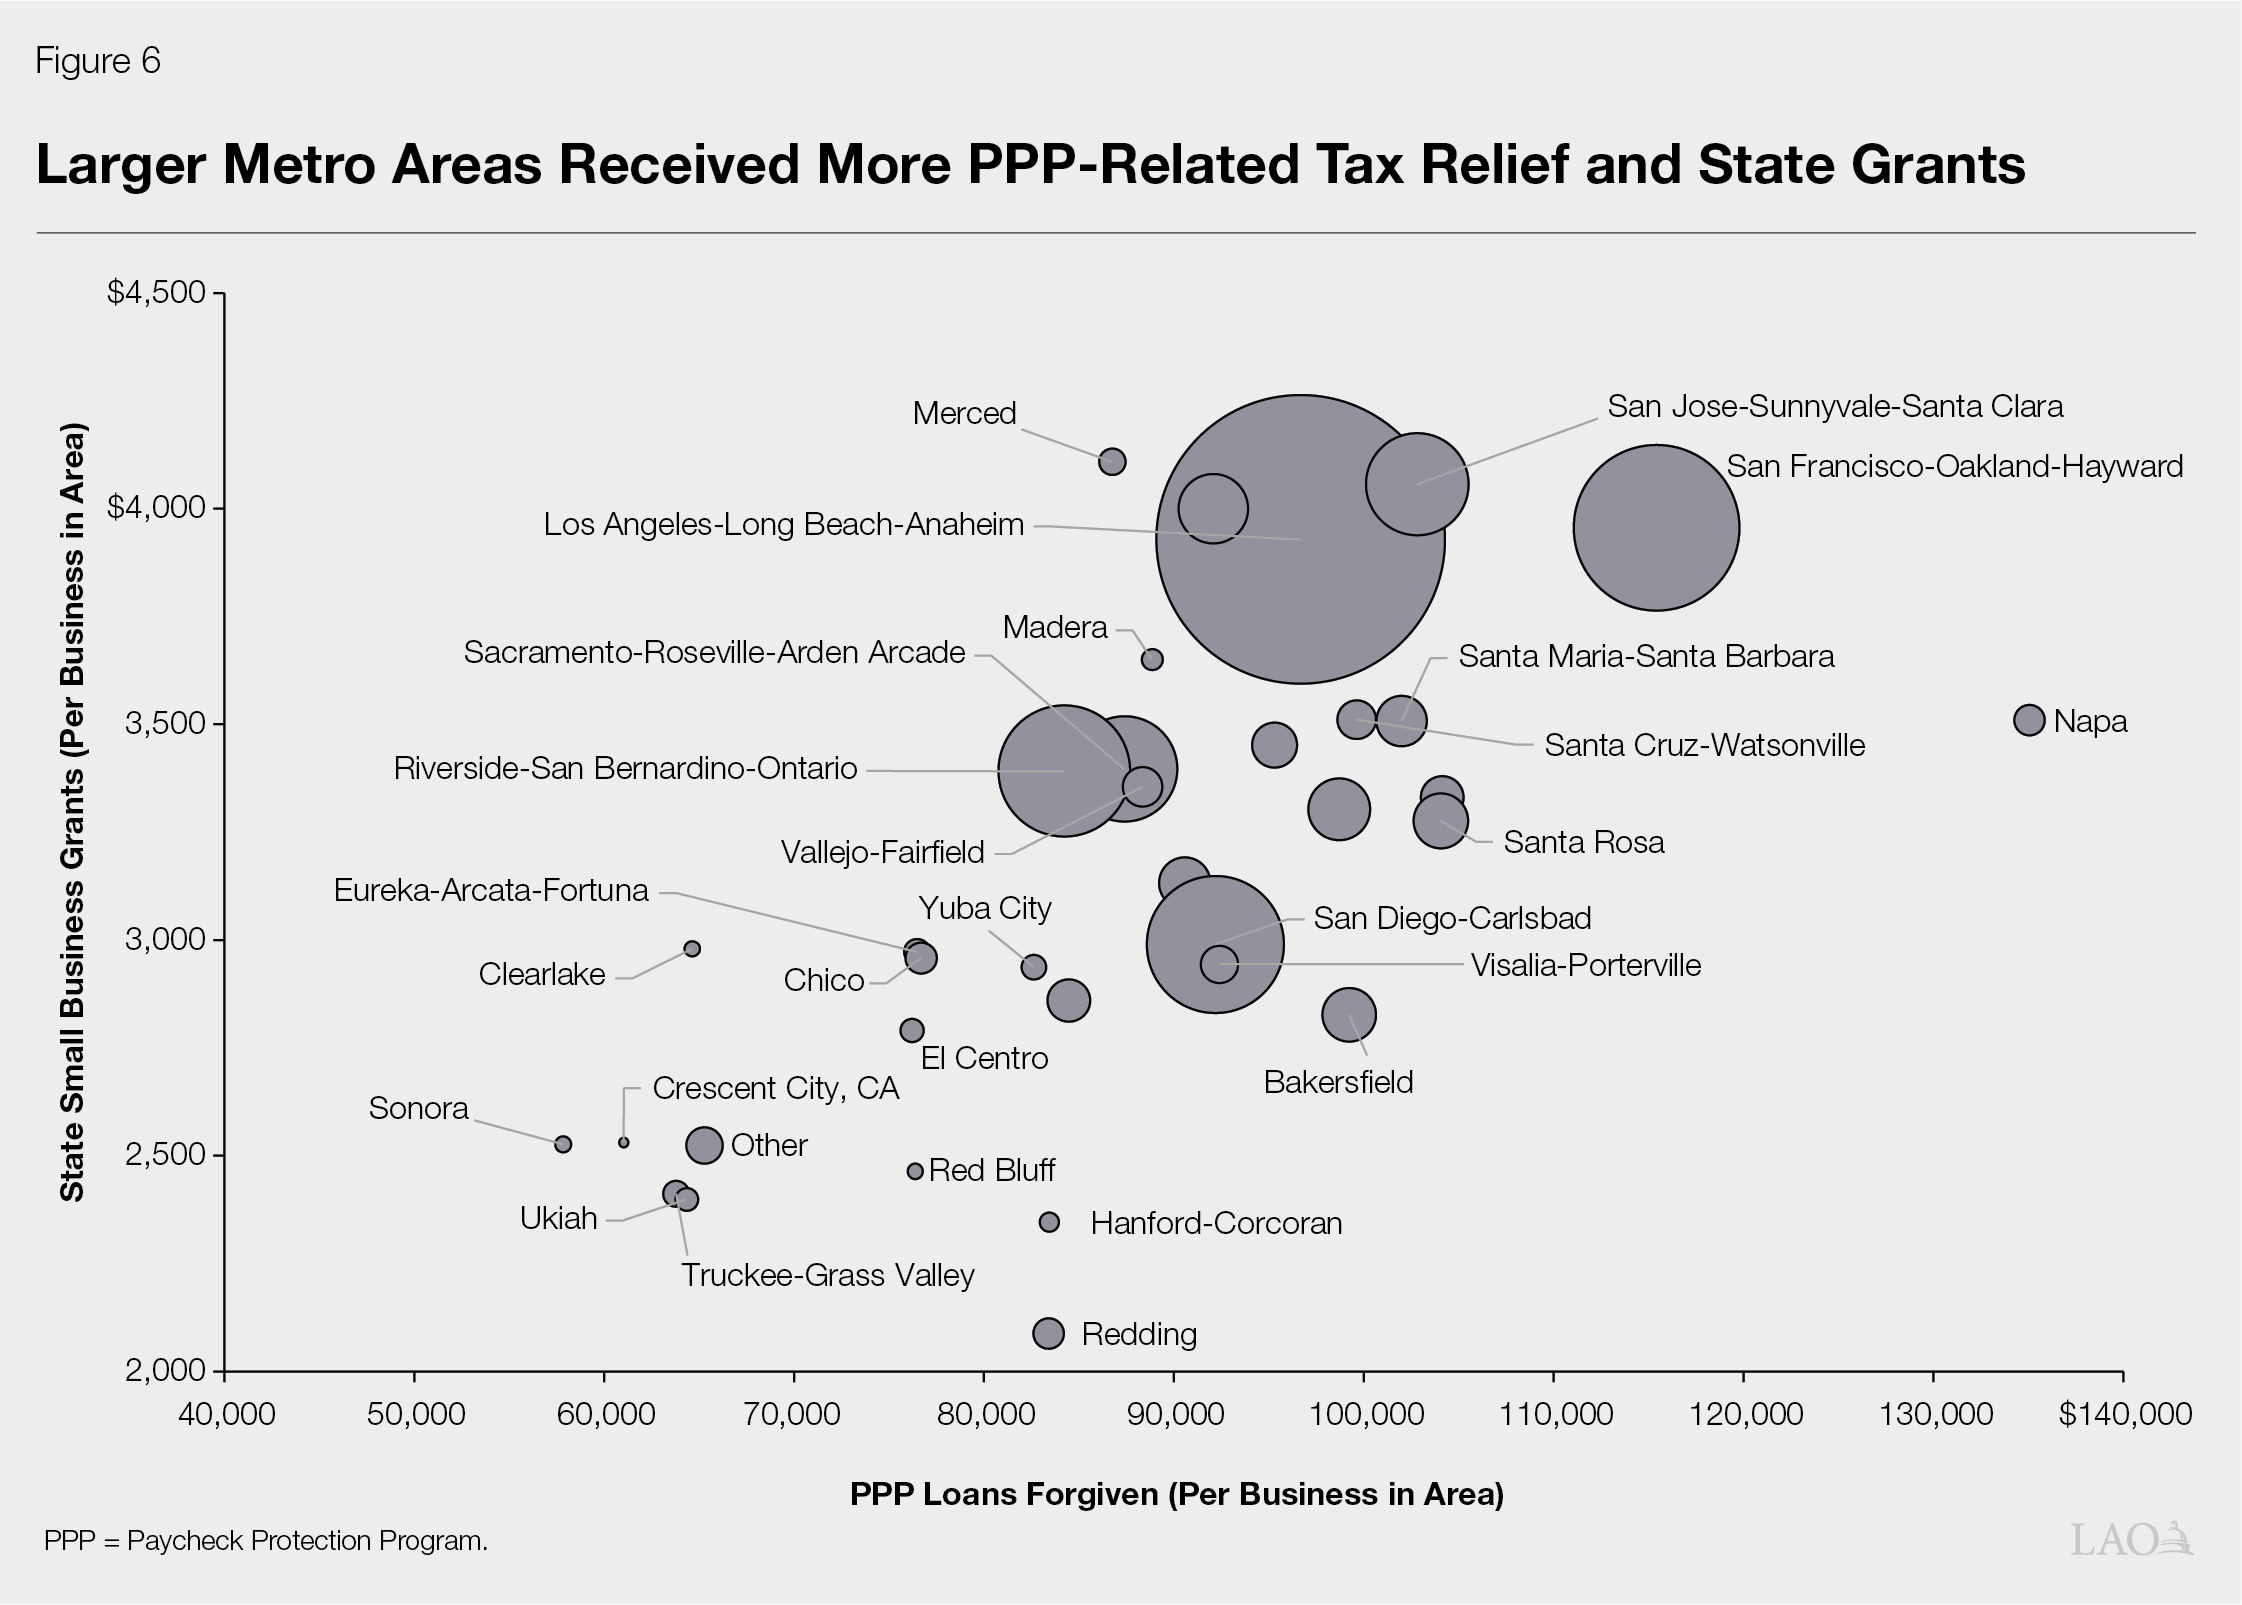
Larger Metro Regions Received More PPP‑Related Tax Relief and State Grants. We also examined how PPP eligible for state tax relief and SBCRG were distributed across metro area. As Figure 6 shows, per business in the area, larger metro regions tended to receive more in both types of assistance, most notably, Los Angeles, San Francisco, and San Jose. Smaller metro areas—like Ukiah, Crescent City, and Truckee—received much less in both types of assistance. One outlier in this trend is Napa, which received considerably more PPP‑related loan forgiveness per business than any other area of any size. This general finding is also consistent with our conversations with business groups. Groups located in larger metro areas expressed they had better established relationships and pre‑existing methods of communication with businesses in their areas. That said, a business group in one large metro areas did express some challenges unique to large metros, for example, the need for a broad range of translation services given the many of languages used in those metros.
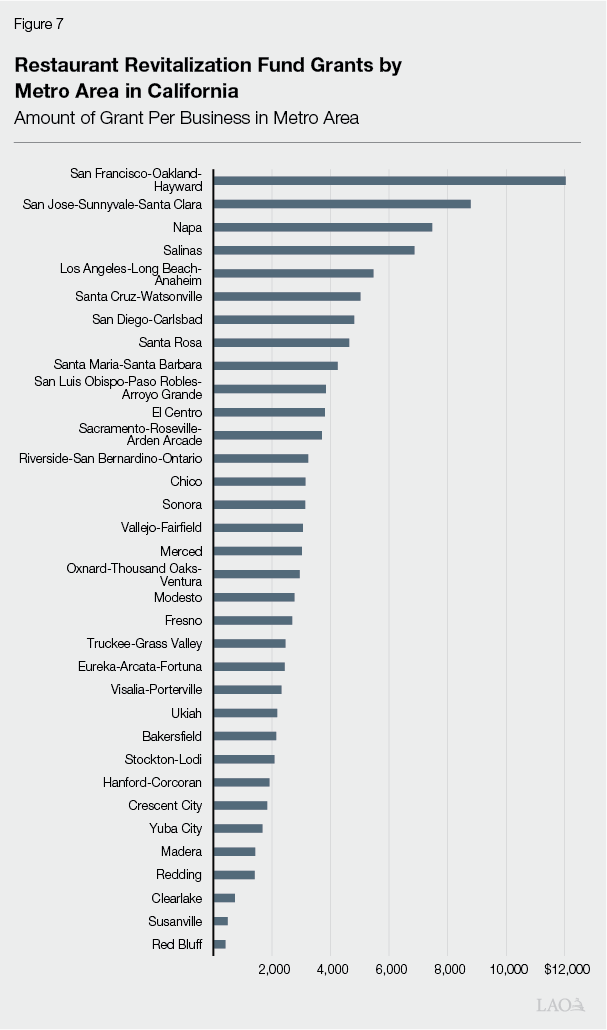
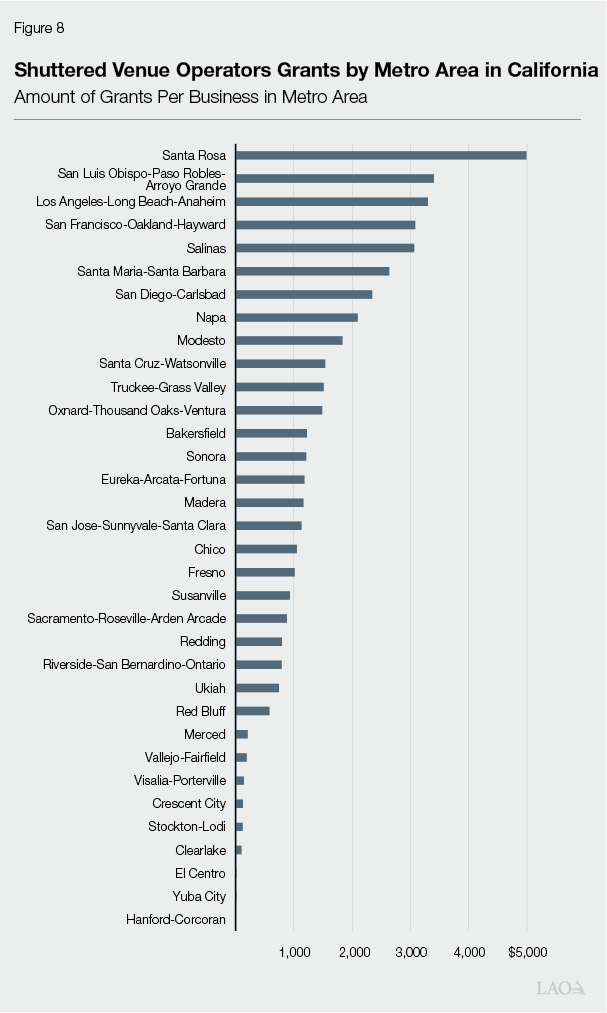
RRF and SVOG Did Not Display as Strong of a Correlation With Metro Size. We also examined whether state tax relief associated with the two other main federal programs—RRF and SVOG—displayed a correlation with the size of the metropolitan area in which businesses were located. For these programs, the relationship is less clear. Figures 7 and Figure 8 show the amount of restaurant grants and shuttered venue grants, respectively, by metro area (scaled using total businesses in that area). Some Northern California metros, including San Francisco, San Jose, Napa, and Salinas received disproportionally more restaurant grants while some Southern California metro areas, including San Luis Obispo and Los Angeles, received more shuttered venue grants.
Higher‑Income Zip Codes
Higher‑Income Zip Codes Received More Total Assistance. Figure 9 shows the total amount of state and federal assistance by zip code using four income categories. (See the previous box for a description of how these categories were defined.) As the left side of the figure shows, the highest‑income zip codes received the most total assistance from state grants and federal loan forgiveness. Meanwhile, the lowest‑income zip codes received the least assistance.
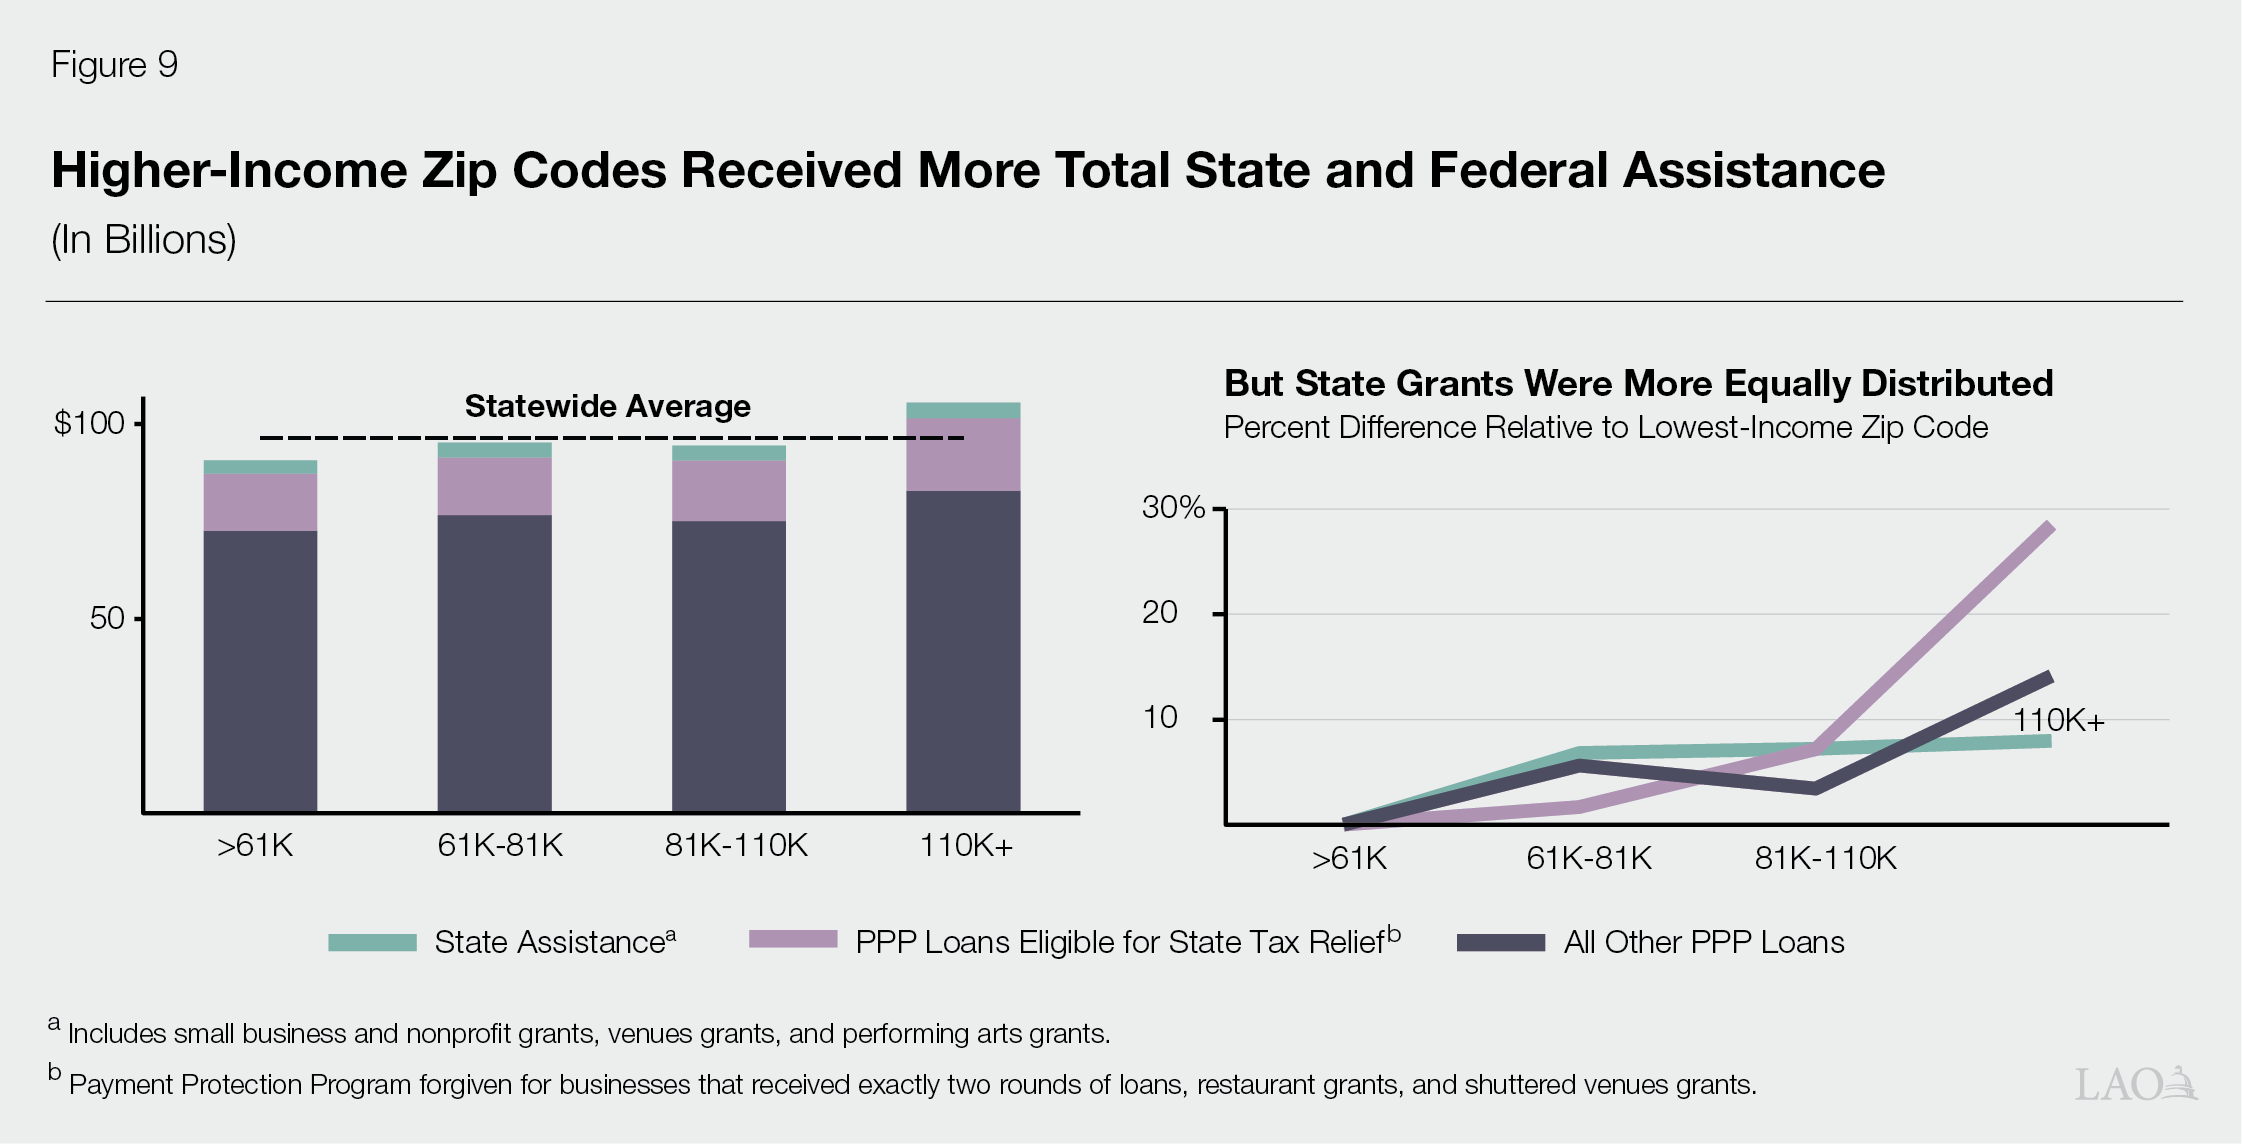
State Grants More Similar Across Zip Codes by Income. That said, state grants were more equally distributed across zip codes by income than federal PPP loans were, particularly those eligible for state tax relief. Figure 9 shows the how much grants in higher‑income zip codes exceeded the lowest‑income zip codes in percent terms. As the figure shows, while middle‑ and higher‑income zip codes received slightly more in state grants than lower‑income zip codes did, the difference is more pronounced for federal PPP loans. This suggest the state’s small business grant program was slightly better targeted toward low‑income communities compared to PPP and the associated state tax relief.
Zip Codes With More Non‑White Residents
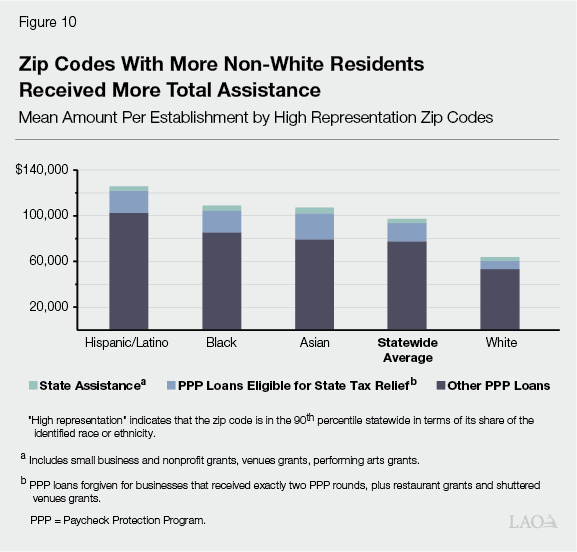
More Assistance Went to Zip Codes With Higher Representation of Hispanic/Latino, Black, and Asian Residents. Figure 10 shows how much state and federal assistance went to zip codes with a higher representation of different races and ethnicities. (The previous box describes how we categorize zip codes using race and ethnicity data.) As the figure shows, zip codes with higher representations of non‑white residents all received more assistance than the statewide average, while zip codes with a higher representation of white residents received less. Importantly, this does not speak to the race or ethnicity of the business owners who received the assistance. It should not be interpreted to mean that Hispanic/Latino‑, Asian‑, and Black‑owned businesses received more assistance than white‑owned businesses.
This Finding Is Somewhat Surprising. The finding that more assistance went to zip codes with higher representation of non‑white residents is somewhat surprising for a couple of reasons. First, zip codes with higher representations of Hispanic/Latino and Black residents are, on average, lower income, and we found that more assistance went to higher‑income zip codes. Second, as described below, there has been other research documenting racial disparities in PPP loans among business owners, particularly that Black business owners received fewer PPP loans compared to white businesses owners.
Several Plausible Explanations. We have some plausible explanations for this finding. First, zip codes with a higher representation of white residents also tend to be disproportionately rural and lower income. These zip codes have a median income of $79,000, somewhat lower than the statewide average of $89,000, and are nearly 40 percent rural compared to the statewide average of 8 percent. As we discussed earlier, rural and lower‑income zip codes tended to receive less assistance than their urban and higher‑income counterparts. Second, zip codes with higher representation of Black and Hispanic/Latino residents tend to have higher shares of service‑oriented industries. As we discussed earlier, those industries were the most highly impacted by the pandemic and also tended to receive more state and federal assistance. Statewide, about 27 percent of businesses are either in accommodation, retail, and personal care and other services. In zip codes that have a higher representation of Black residents, 32 percent of businesses are in these service‑oriented industries. The figure is 35 percent for zip codes that have a higher representation of Hispanic/Latino residents.
Statewide Lendistry Data on Business Owner Race and Ethnicity. Although we were not able to obtain data from Lendistry on the demographic characteristics of the businesses owners who received SBCRG at a business level, they have shared statewide demographic data. Lendistry reported that, statewide, about half of the small business COVID‑19 grants were distributed to white‑owned businesses, 32 percent of the grants went to Asian‑owned businesses, 18 percent went to Hispanic‑ or Latino‑owned businesses (regardless of race), and 11 percent went to African American‑owned businesses. Lendistry’s method for collecting and reporting race and ethnicity data does not appear to align with Census data on race and ethnicity in the state. Consequently, we cannot directly compare these statistics to statewide demographic data.
Other Research on Federal PPP Program Has Documented Racial Disparities Among Business Owners. Research nationally and in other states has found consistent evidence of racial disparities in the distribution of PPP loans, particularly for Black‑owned businesses. These findings include, for example, that Black‑owned firms were about 9 percent less likely to receive PPP loans than similar white‑owned firms and, among Black‑owned businesses that received loans, those loans were approximately 50 percent smaller than those loans made to similar white‑owned businesses. Due to data limitations, we were unable to examine state and federal aid in California at a business level in this report. We are not aware of any high‑quality studies on loan distribution in California that documented the presence—or lack thereof—of racial disparities at a community level.
Findings
Legislature Has Very Little Information About Recipients of State Grants. Ideally, this report would have included a business‑level analysis on the recipients of pandemic‑related assistance, particularly for the state’s grant programs. However, Go‑Biz was unable to provide us with business‑level demographic data on grant recipients. (We understand that Go‑Biz cannot request this data from Lendistry because it was not part of the original contract with the entity.) With better data, we would have been better positioned to analyze whether there were racial and ethnic, gender, or other disparities in the state’s programs. In the future, we would suggest the Legislature consider directing the administration to include reporting requirements on demographics in its contracts with private firms and standardizing questions about race and ethnicity to align with Census data. This could be particularly useful in cases where the Legislature is interested in targeting assistance, especially to address a potential disparity.
State Business Assistance Was Significant to the State Budget, but Dwarfed by Federal PPP Program. As we discussed in this report, state assistance to businesses represented a very small share of the overall assistance provided to businesses during the pandemic because federal aid was so significant. Nonetheless, the state grants—with program costs totaling roughly $4.5 billion across all programs—were not trivial from a state budget perspective. The relative size differences between the state and federal programs also likely contributed to a lack of broad awareness about the state’s grants. In our interviews with business groups, we observed that there seemed to be a very limited awareness of state programs, even among some regional Chambers of Commerce, which played a key role in disseminating information to businesses about government assistance. That said, this apparent lack of awareness did not prevent the state from disseminating nearly all of the assistance appropriated by the Legislature.
State Assistance Complemented Federal Assistance in Some Ways, Duplicated It in Others. Through this analysis, we have some evidence the state programs did, to some extent, complement, rather than duplicate, federal assistance. For example, we found that there was somewhat more dissemination of state assistance among industries that experienced more job losses compared to federal assistance. State assistance was also more equally distributed across zip codes by income compared to federal assistance. Geographically, however, both state and federal assistance appeared to have better dispersion in urban and large metropolitan areas and less in rural areas and small cities. In light of these disparities, the state programs could have been better targeted to rural Californians in order to partially mitigate a weakness of the federal program.