
 Report in PDF
LAO Report
January 31, 2020Narrowing California's K-12 Student Achievement Gaps
- Introduction
- Achievement Gaps
- Existing State Efforts to Narrow Gaps
- Assessment
- Legislative Options
- Conclusion
Executive Summary
Legislature Established an Achievement Gap Work Group and Required a Report. In response to concerns over K‑12 student achievement gaps, the Legislature tasked our office with convening a work group on the topic and submitting a report. The work group needed to have representatives from both houses of the Legislature, the administration (including the Department of Finance), and the California Department of Education (CDE). The group met five times during fall 2019. The required report needed to: (1) examine data on K‑12 student achievement gaps, (2) identify funding provided for disadvantaged and low‑performing students, (3) assess existing state efforts to serve these students, and (4) develop options for better supporting these students. This report responds to these requirements.
Student Achievement Gaps
Among Racial/Ethnic Groups, African American Students Have Worst Outcomes. On average, across all grade levels, African American students had the lowest scores on state standardized tests in spring 2018. African American students also had the lowest graduation rates and were the least likely to be prepared for college/career at graduation. On average, African American students missed much more school than other students, with a chronic absenteeism rate about double that of Latino and white students in 2017‑18. Similarly, they were suspended at nearly double the rate of Latino and white students. Racial/ethnic achievement gaps held even after taking family income into account. For example, low‑income African American students as a group performed worse across a range of outcome measures relative to other low‑income students.
Several Other Student Groups Also Have Relatively Low Performance. Low‑income students, English learners, students with disabilities, foster youth, and homeless youth also have worse outcomes on average than other students. All five of these student groups had relatively low test scores and low graduation rates in 2018. Foster youth had the lowest graduation rate, with only about half graduating within four years. The share of students deemed prepared for college/career and the college‑going rates for all these student groups also were lower than for the overall population of students. Foster youth missed the most school, with a chronic absenteeism rate more than double that of all other students and 6 percentage points higher than the rate for African American students. In 2017‑18, the suspension rate for foster youth was about five times higher than the rate for all students and nearly twice the rate for African American students.
State Efforts to Narrow Gaps
Significant Funding Is Allocated for Disadvantaged Students. School districts currently receive $15.2 billion in ongoing state funding and $4.9 billion in ongoing federal funding for supporting disadvantaged, low‑income, low‑performing, and special needs students. A large share of this funding is for direct student services, but some of it is for helping school districts develop and implement improvement plans. In addition to ongoing funding, the state has provided $2.1 billion in one‑time funding over the past five years for special initiatives aimed at better supporting disadvantaged and low‑performing students.
State Has New System for Supporting School Districts With Low‑Performing Students. When the state created a new school funding system in 2013‑14, it also adopted a new accountability system. A core part of the new accountability system is having each district develop a strategic plan known as a Local Control and Accountability Plan (LCAP). In their LCAPs, districts must identify their achievement gaps, set performance goals, and track progress toward meeting those goals. Under the new system, the state uses multiple measures to assess whether a district is low performing. A district identified as low performing is to receive targeted support from its county office of education (COE). For a district with persistent performance issues, CDE is currently developing a more intensive level of intervention. This level of intervention is likely to begin with CDE, the California Collaborative for Educational Excellence (CCEE), and other regional partners coming together to conduct a systemic review of the district’s instructional practices.
A Package of Four Promising Legislative Options
Make Achievement Gap Information More Readily Available. The work group expressed concern that information about student achievement gaps can be difficult to access. One legislative option is to require CDE to post the progress of the state and each district in narrowing student achievement gaps over time. In addition, the Legislature could direct CDE to profile districts making particularly good progress, including information about their improvement strategies. Knowing which districts are performing well and what they are doing to attain better outcomes could help other districts improve.
Monitor Efforts to Improve School Leadership. Work group members agreed that leadership was key to guiding and sustaining improvement efforts. Districts that have narrowed achievement gaps tend to benefit from stable, experienced school leaders who know how to use data to inform their improvement efforts. A second legislative option is to specify how the state’s recently created California School Leadership Academy is to be evaluated. Then, if signs emerge that the academy might have shortcomings, the Legislature could seek to rectify them through subsequent legislation. For example, if recent academy graduates report that they still lack proficiency in using data to assess achievement gaps, the academy could be directed to enhance training in this area.
Create Standards for Reviewing Districts’ Academic Plans. Currently, the state tasks COEs with reviewing whether districts fill out the LCAP template correctly, but it does not require COEs to do a qualitative review of these plans. Importantly, COEs are not tasked with assessing if districts have ascertained their most pressing performance issues, identified promising strategies for improving their performance, and made budget decisions that are well aligned with their improvement plans. A third legislative option is to convene certain experts to develop a set of LCAP review standards. Based upon a holistic review of districts using the new review standards, COEs could identify poorly performing districts and increase support for them.
Establish Academic Assistance Program for the Lowest‑Performing Districts. The work group expressed frustration that some districts persist in having long track records of poor performance despite the many improvement strategies the state has tried in the past. A fourth legislative option is to establish an academic assistance program for districts with the most significant achievement gaps that have not narrowed over time. CCEE, in partnership with other agencies, could provide these types of districts with intensive intervention over a multiyear period. The assistance could include a comprehensive improvement redesign and realignment of core spending within the district such that ongoing funding is used more effectively.
Introduction
Student Achievement Gaps in California Are Large and Persistent. Year after year, Latino and African American students consistently have lower average state standardized test scores than white and Asian students. Latino and African American students also tend to have worse outcomes on other academic performance measures, such as attendance and suspension rates. Similar achievement gaps can be observed between students with and without disabilities and students who do and do not come from low‑income families.
Legislature Established Achievement Gap Work Group and Required Report. In response to concerns over these student achievement gaps, the Legislature tasked our office with convening a work group on the topic and submitting a report by February 1, 2020. As required by the Supplemental Report of the 2019‑20 Budget Act, the group needed to have representatives from both houses of the Legislature, the administration (including the Department of Finance), and the California Department of Education (CDE). The group met five times over the course of fall 2019. The required report needed to: (1) examine data on K‑12 student achievement gaps, (2) identify funding provided for disadvantaged and low‑performing students, (3) assess existing state efforts to serve these students, and (4) develop options for better supporting these students. The rest of this report contains four sections corresponding to these four requirements.
Work Group Did Not Examine Governor’s 2020‑21 Budget Proposals. The Governor’s budget plan for 2020‑21 contains two large one‑time initiatives focused on narrowing student achievement gaps. Specifically, he proposes $300 million for “opportunity grants” designed to provide integrated and intensive interventions to the state’s lowest performing schools and districts to help them close their achievement gaps. In addition, he proposes $300 million for community school grants to help districts coordinate student wraparound services, expand learning time, deepen community engagement, and promote collaborative school leadership. Because the work group held its final meeting in October 2019 (a few months prior to release of the Governor’s budget), it did not have the opportunity to evaluate these proposals. In the nearby box, we provide some of our office’s preliminary thoughts on those proposals. In our forthcoming “The 2020‑21 Budget: Proposition 98 Education Analysis,” we will provide a more detailed analysis.
Governor’s Achievement Gap Proposals Might Not Require Districts to Make Essential Changes. We are in the midst of analyzing the Governor’s two achievement gap proposals. While we believe both of the Governor’s achievement gap proposals have laudable intent, we cannot determine from the information currently available whether they would require districts to undergo the types of ongoing changes needed to address their root issues. In particular, it is not clear whether either proposal would require districts to change their spending habits and priorities. Without reexamining how they deploy their core ongoing funds and assisting them in redeploying those funds more strategically, districts likely would not be able to sustain efforts to narrow their achievement gaps. In addition, given the lack of detail currently in the Governor’s proposals, it is difficult to determine how they would interact with the state’s existing system of support.
Achievement Gaps
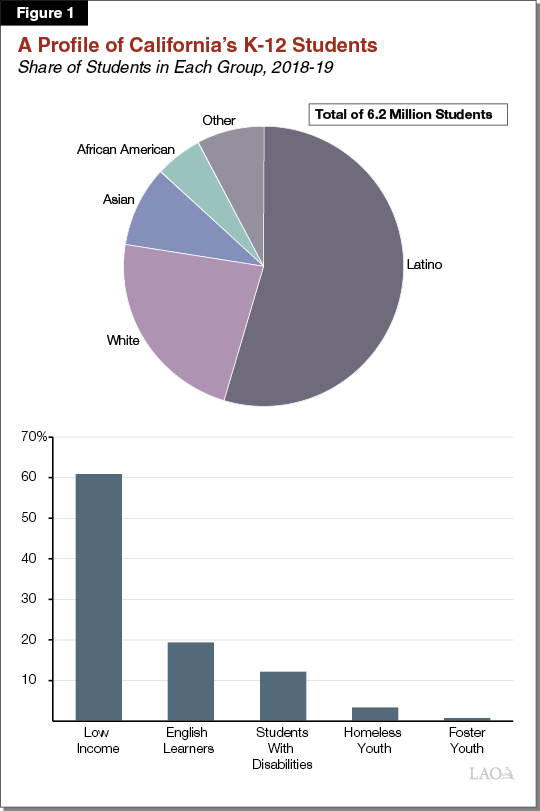
Gaps Between Several Student Groups Examined. The work group examined K‑12 achievement gaps by student race/ethnicity. It also examined gaps between the general population of students and low‑income students, English learners, students with disabilities, foster youth, and homeless youth. Figure 1 shows each of these student groups as a share of all public school students. More than 60 percent of students, for example, are low income.
African American and Latino Students Comprise a Disproportionate Share of Certain Student Groups. Although African American students comprise 5.4 percent of all public school students in California, they make up a greater share of certain student subgroups. For example, 19 percent of foster youth and 8.3 percent of homeless youth are African American. In a similar vein, Latino youth make up 55 percent of all students, but 81 percent of English learners and 71 percent of low‑income students.
Several Achievement Gap Measures Examined. For each student group, the work group looked at standardized test scores—the most common tool used to identify and measure achievement gaps. The group also looked at an assortment of other outcome measures, including high school graduation rates and chronic absenteeism rates. Figure 2 lists all the measures that the work group examined.
Figure 2
List of All Outcome Measures the Work Group Examined
|
Outcome Measure |
Definition |
|
Standardized test scores |
The average score of a student group on state standardized assessments administered at the end of each year in grades 3 through 8 and grade 11. |
|
Cohort graduation rate |
The share of students from a given group graduating high school within four years. |
|
College/career indicator |
An index containing various measures intended to assess readiness to pursue college or a career. |
|
College preparatory courses |
The share of high school graduates having completed all coursework required for admission to the University of California or the California State University with at least a “C” grade. |
|
College‑going rate |
The share of students who enrolled in a postsecondary institution within 12 months of completing high school. |
|
Chronic absenteeism rate |
The share of students from a given group absent for 10 percent or more of the school year. |
|
Suspension rate |
The share of students from a given group suspended at least once during the school year. |
Achievement Gaps by Race/Ethnicity
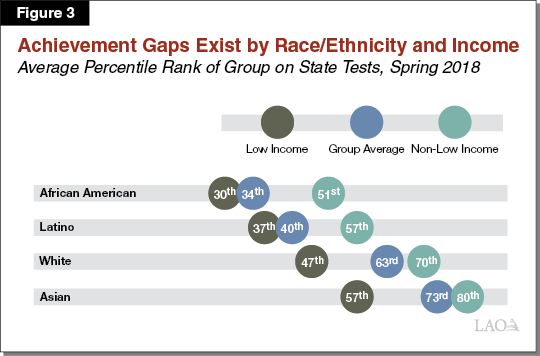
Among Racial/Ethnic Groups, African American Students Have Lowest Standardized Test Scores. California administers standardized tests on an annual basis to all students in grades 3 through 8 and grade 11. The standardized tests cover proficiency in English Language Arts and mathematics. On average, across all grade levels, African American students had the lowest scores on the standardized tests administered in spring 2018. Latino students performed somewhat better, followed by white students, with Asian students having the highest average scores. As Figure 3 shows, racial and ethnic achievement gaps held even taking family income into account. For example, low‑income Latino students had lower average test scores than low‑income white students.
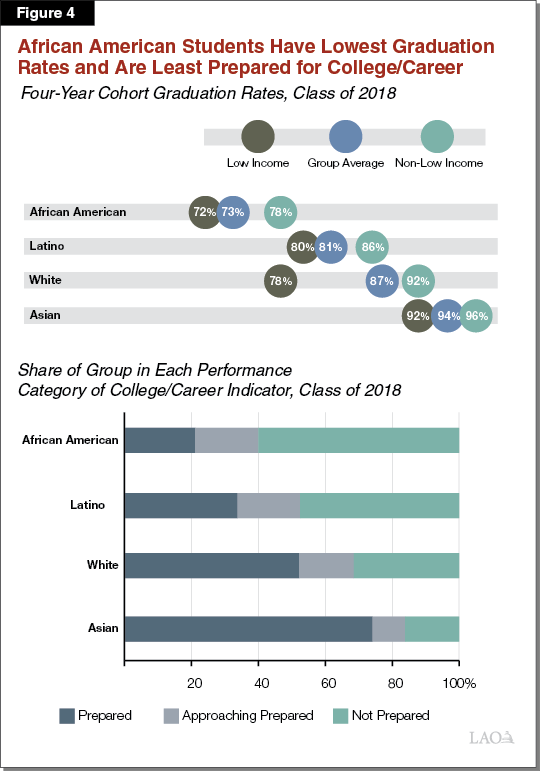
African American Students Also Have Lower Graduation and College/Career Readiness Rates. As the top part of Figure 4 shows, average high school graduation rates among student racial/ethnic groups range from 73 percent for African American students to 94 percent for Asian students. As with test scores, differences exist even when taking family income into account. For example, among non‑low‑income students, graduation rates still are highest for Asian students and lowest for African American students. Non‑low‑income African American students on average have the same graduation rate as low‑income white students. As the bottom part of Figure 4 shows, 21 percent of African American students who graduated in 2018 were considered prepared for college or career, compared to 52 percent of white students and 74 percent of Asian students. Latino students on average have lower rates of graduation and college/career preparedness than white students, although the gap between Latino and white students is narrower than the gap between African American and white students. Asian students have the best outcomes in these performance areas.
African American Students Have Higher Rates of Chronic Absenteeism and Suspension. African American students, on average, miss much more school than other students. Twenty percent of African American students are chronically absent—meaning absent for 10 percent or more of the school year. This rate is about double that of Latino and white students. Asian students, on average, are the least likely to be chronically absent. African American students also are suspended at nearly twice the rate of Latino and white students and more than four times the rate of Asian students, on average. Gaps on these measures exist even after taking family income into account. For example, low‑income African American students have a notably higher chronic absenteeism rate than other low‑income students.
Other Achievement Gaps
Several Other Student Groups Also Have Relatively Low Test Scores. In spring 2018, average standardized test scores of low‑income students were at the 39th percentile of all test takers. As a group, students with disabilities were at the 18th percentile. Data were not available for foster youth and homeless youth, but given those populations are overwhelmingly low income, they likely also had below‑average test scores. Because of reclassification issues, we did not average the scores of English learners across all grade levels. At any given grade, however, English learners have lower test scores. For example, in third grade, English learners’ average test scores were at the 27th percentile in English Language Arts and at the 30th percentile in mathematics.
These Groups Also Tend to Have Lower Graduation and College/Career Readiness Rates. As Figure 5 shows, the graduation rate for all these student groups is lower than the average for all students. Foster youth have the lowest graduation rate, with only about half graduating within four years. The share of students deemed prepared for college/career also is lower for all these student groups. For example, only 9 percent of students with disabilities and 10 percent of foster youth are deemed prepared for college/career, compared to 42 percent of all students. Moreover, all these student groups have lower college‑going rates than the overall population of students. (The college/career indicator is a relatively stringent measure of readiness compared to the actual college‑going rate.) Some of these student groups on some of these measures have notably worse outcomes than African American students.
Figure 5
Several Other Student Groups Have Relatively Low Performance
Class of 2018
|
Four‑Year Cohort |
Share Deemed |
College‑Going |
|
|
All students |
83% |
42% |
64% |
|
Low income |
80 |
34 |
57 |
|
Homeless youth |
69 |
24 |
50 |
|
Foster youth |
53 |
10 |
48 |
|
English learners |
68 |
15 |
42 |
|
Students with disabilities |
66 |
9 |
45 |
Foster Youth Have Highest Chronic Absenteeism and Suspension Rates. More than one‑quarter of foster youth were chronically absent in 2017‑18—more than double the rate for all students. The chronic absenteeism rate for foster youth also was higher than the rate for African American students (26 percent compared to 20 percent, respectively). The suspension rate for foster youth is about five times higher than the rate for all students, while also being higher than the rate for African American students. Low‑income students, students with disabilities, and homeless youth also are somewhat more likely to be suspended than the general population of students.
Existing State Efforts to Narrow Gaps
Work Group Focused on School Factors. Achievement gaps are influenced by many factors outside and inside the education system. For example, experts have suggested that family characteristics, residential segregation, health disparities, public safety issues, and school quality all can influence achievement gaps. The work group, however, focused only on the school factors that contribute to achievement gaps. Among state agencies, only CDE was directed to be a part of the work group. Moreover, focusing only on school factors made for a more manageable scope of work for the group. Thus, in this section, we focus specifically on the role of the state and federal governments in supporting schools, with a particular emphasis on support for disadvantaged and low‑performing students.
Significant Ongoing Funding Allocated for Disadvantaged Students. As Figure 6 shows, California currently spends $15.2 billion annually to support disadvantaged or low‑performing students. The single biggest component of this spending is the $10 billion the state allocates through the Local Control Funding Formula (LCFF) supplemental and concentration grants. The LCFF supplemental grant is intended to benefit students who are low income, English learners, or foster youth. Districts with a large share of these students also receive additional funding through the LCFF concentration grant. As the figure shows, the state funds many other programs intended to support students with disabilities, low‑income students, and low‑performing students. It also funds several programs that comprise the state’s current system of support for low‑performing districts. This system consists of a network of experts at the county and state levels designed to assist districts in their improvement efforts. (We describe the system in more detail later in this report.)
Figure 6
Ongoing State Education Programs for Disadvantaged Students
2019‑20, Ongoing Funding (In Millions)
|
Program |
Description |
Amount |
|
Local Control Funding Formula (LCFF) |
||
|
Supplemental grants |
For every English learner or low‑income (EL/LI) student, homeless youth, and foster youth, provides supplemental funding equal to 20 percent of the base per‑student LCFF grant. |
$6,400 |
|
Concentration grants |
Provides additional funding for districts with more than 55 percent EL/LI enrollment. Each EL/LI student above the threshold generates an additional 50 percent of the base LCFF grant. |
3,584 |
|
Subtotal |
($9,984) |
|
|
Other Student Servicesa |
||
|
Special education/AB 602 |
Funds Special Education Local Plan Areas (SELPAs) on a per‑student basis. |
$3,421 |
|
State Preschool |
Funds part‑day or full‑day preschool for children from low‑income families. |
963 |
|
After School Education and Safety |
Funds before and after school programs, primarily for low‑income children. |
650 |
|
Foster Youth Services |
Provides range of wraparound services for foster youth to improve their educational performance. |
27 |
|
Learning Communities for School Success Program |
Funds grants aimed at reducing truancy and supporting students who are at risk of dropping out of school or are victims of a crime. |
19 |
|
California Student Opportunity and Access Program |
Provides outreach to areas with low college‑going rates. Program focuses on improving the availability of information about college and financial aid. |
8 |
|
Early Academic Outreach Program |
Funds a support program aimed at increasing college access for disadvantaged middle school and high school students. |
7 |
|
Mathematics, Engineering, and Science Achievement |
Funds a support program focused on increasing the number of disadvantaged students completing science, technology, engineering, or mathematics degrees. |
4b |
|
Puente Project |
Funds a support program for Latino and other underrepresented students, with a focus on improving writing skills and increasing college participation. |
1b |
|
Subtotal |
($5,101) |
|
|
State System of Support |
||
|
Support from county offices of education (COEs) |
Funds COEs to support low‑performing districts. Funding is based on the number and size of the low‑performing districts within a county. |
$75 |
|
Preschool Quality Rating and Improvement System |
Funds evaluations and resources for State Preschool providers to help improve or maintain their program quality. |
50 |
|
California Collaborative for Educational Excellence (CCEE) |
Provides support to geographic and SELPA leads to improve student outcomes. CCEE also can provide support directly to low‑performing districts. |
12 |
|
SELPA leads |
Funds seven SELPAs to provide statewide assistance on improving special education outcomes.c |
10 |
|
Geographic leads |
Funds nine COEs to provide assistance to other nearby COEs to train and assist them in better supporting low‑performing districts in their areas.d |
4 |
|
Subtotal |
($151) |
|
|
Total |
$15,236 |
|
|
aExcludes some outreach programs administered by postsecondary institutions because funding information is not readily available. bIncludes funding for high school and community college students. cEl Dorado, Riverside, West San Gabriel, Marin, Placer, South, and Imperial. dShasta, Sonoma, Placer, Sacramento, Alameda, Tulare, Kern, Riverside, and San Diego. |
||
All Districts Must Develop Plans for Helping Low‑Performing Students Improve. In conjunction with establishing LCFF in 2013‑14, the state adopted a new system of accountability for school districts. A core part of the new accountability system is a requirement that each district develop a strategic plan known as a Local Control and Accountability Plan (LCAP). Districts must adopt an LCAP every three years and update the plan annually. State law specifies the various groups (such as teachers and parents) that districts must include in their planning process. In their LCAPs, districts must identify their achievement gaps, set performance goals, and track progress toward meeting those goals.
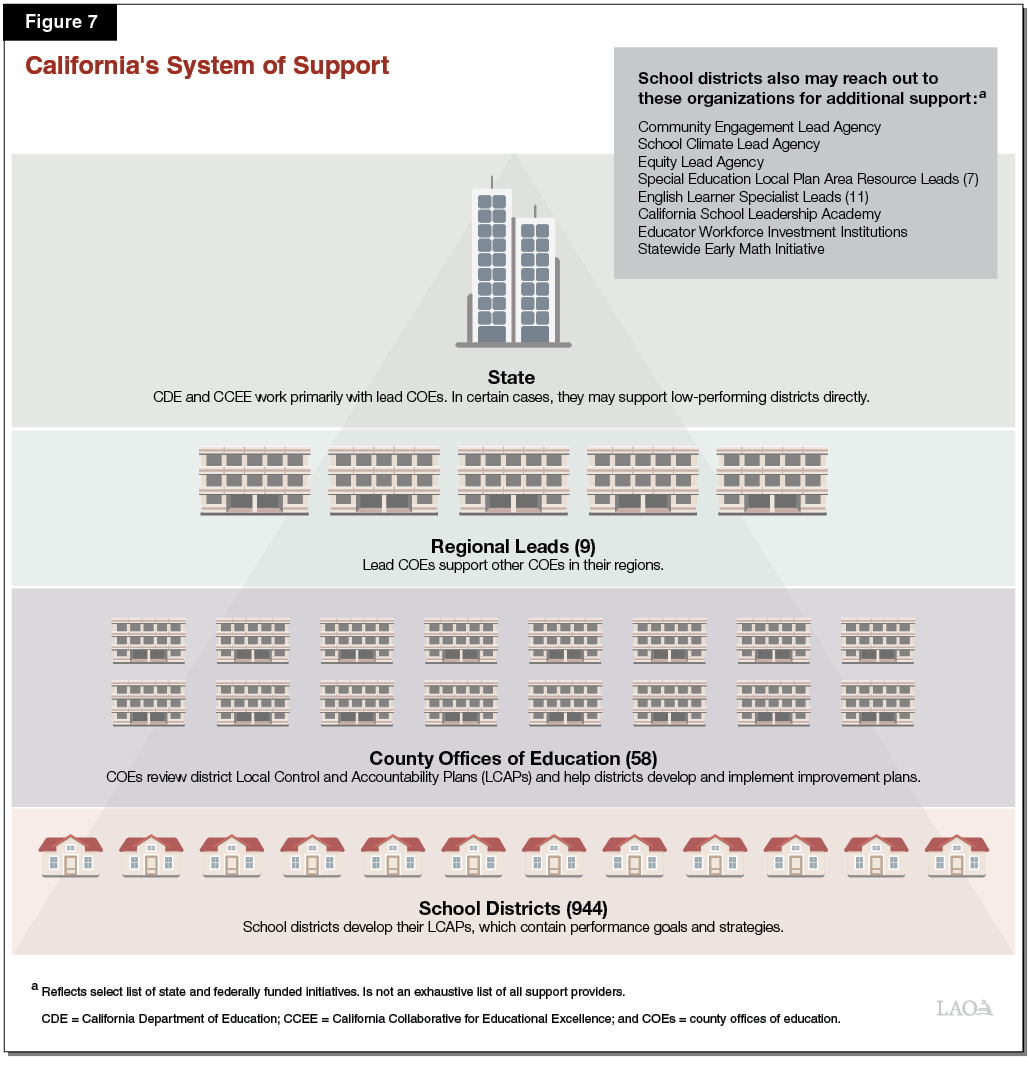
State Has New System for Supporting School Districts With Low‑Performing Students. In developing its new accountability system, the state moved to evaluating school district performance based upon multiple measures, including not only test scores and graduation rates but also chronic absenteeism and suspension rates, among others. A district that is identified as low performing in any of these areas is to receive targeted support—also known as Level 2 support, or differentiated assistance—from its county office of education (COE), sometimes in consultation with other regional and state partners. For a district that has persistent performance issues, CDE is currently developing another tier of assistance—called Level 3 support, or intensive intervention. This level of intervention is likely to begin with CDE, the California Collaborative for Educational Excellence (CCEE), and other regional partners coming together to conduct a systemic review of the district’s instructional practices. Figure 7 provides a simplified illustration of the structure of the new system of support, outlining the basic roles of the organizations involved at each level.
State Has Funded Many One‑Time Initiatives Focused on Improving Outcomes. Over the past five years, the state allocated a total of $2.1 billion for numerous initiatives intended to benefit disadvantaged students (Figure 8). Among these initiatives, seven focused on improving services for students. These particular initiatives included efforts to increase college‑readiness at certain high schools, provide additional support for refugee students, and better coordinate services for foster youth. Another seven programs focused on professional development, with a focus on improving the effectiveness of teachers, administrators, and counselors, including those involved in preschool. The remaining seven programs included a variety of special initiatives, including those designed to improve school climate, community engagement, and intersegmental partnerships. One of these initiatives created a new state‑funded Center to Close Achievement Gaps.
Figure 8
One‑Time State Education Initiatives for Disadvantaged Students
2015‑16 Through 2019‑20 (In Millions)
|
Initiative |
Description |
Years Fundeda |
Total Fundingb |
|
Student Services |
|||
|
Preschool‑aged children with disabilities |
Funds special education services for children ages three and four. |
2019‑20 |
$493 |
|
Low‑Performing Students Block Grant |
Funded LEAs serving students identified as low performing but not eligible for LCFF supplemental funds or special education services. |
2018‑19 |
300 |
|
College Readiness Block Grant |
Provided high school students, especially EL/LI students, with additional support to increase college going. |
2016‑17 |
200 |
|
Early Education Expansion Grant |
Aimed to increase access to early learning and care for children with disabilities. |
2018‑19 |
167 |
|
College outreach |
Funds outreach to high schools having at least 75 percent of their students classified as EL/LI. Outreach focuses on promoting college going among low‑income and underrepresented students. |
2016‑17, 2019‑20 |
26 |
|
Expanded refugee student services |
Allocated grants to districts serving a notable number of refugee students to provide additional support services. |
2017‑18 |
10 |
|
First Star foster youth |
Funds support services for one cohort of high school foster youth living in the CSU Sacramento area over a four‑year period. |
2019‑20 |
1 |
|
Subtotal |
($1,196) |
||
|
Staff Development |
|||
|
Educator Effectiveness Block Grant |
Supported broad range of training activities (including implementing state standards) for beginning teachers, veteran teachers, administrators, and counselors. |
2015‑16 |
$490 |
|
Child care/preschool workforce |
Funds grants to increase the number and educational attainment of child care/preschool staff ($150 million in state funds, $45 million in federal funds). |
2019‑20 |
195 |
|
Educator Workforce Investment Grant |
Funds professional development for teachers and instructional aides (includes $10 million for EL training and $5 million for special education training). |
2019‑20 |
37 |
|
Multi‑Tiered System of Support |
Provided statewide resources and training focused on improving students’ academic and behavioral supports. |
2015‑16, 2016‑17 |
30 |
|
CCEE training |
Funded training for school staff, parents, and community members on school performance data and how to assess LEA strengths and weaknesses. |
2016‑17 |
$20 |
|
Technology training |
Funded training, technical assistance, and resources to help districts address their technology needs. |
2015‑16 |
10 |
|
Dyslexia training |
Funds two initiatives focused on improving diagnosis and support for students with dyselxia. |
2019‑20 |
10 |
|
Subtotal |
($792) |
||
|
Other |
|||
|
School Climate Initiative |
Supported information gathering and efforts to improve school climate. |
2018‑19 |
$15 |
|
Intersegmental College Success Partnerships |
Funded grants to help community colleges establish or expand partnerships with school districts and public universities, with the goal of improving college preparation, participation, and success. |
2016‑17 |
15 |
|
Community Engagement Initiative |
Funded efforts to facilitate and improve school district and COE community engagement. |
2018‑19 |
13 |
|
Education Innovation Grants |
Provides grants to establish high school/college partnerships to improve alignment between programs, raise college‑going rates, and increase college completion in the San Joaquin and Inland Empire regions. |
2019‑20 |
10 |
|
CCEE pilot program |
Funded pilot intended to identify effective ways to support low‑performing districts in their improvement efforts. |
2016‑17 |
10 |
|
Center to Close Achievement Gaps |
Funds a center charged with identifying and disseminating best practices regarding narrowing student achievement gaps. |
2019‑20 |
3 |
|
Equity Performance and Improvement |
Aimed at helping LEAs narrow their student achievement gaps. |
2017‑18 |
3 |
|
Subtotal |
($69) |
||
|
Total |
$2,075 |
||
|
aReflects year in which relevant budget package was adopted. In some cases, funds were scored to a previous fiscal year. bConsists of all state funding provided over life of initiative. |
|||
|
LEAs = local education agencies; LCFF = Local Control Funding Formula; EL/LI = English learner or low income; CCEE = California Collaborative for Educational Excellence; and COE = county office of education. |
|||
State Piloted a Block Grant for Low‑Performing Students. Among the largest of the one‑time initiatives that the state funded over this period was the Low‑Performing Students Block Grant. The state provided $300 million for this initiative in 2018‑19, with districts allowed to use the funding through 2020‑21. Districts qualified for grant funding if they had students who were both low performing and not generating LCFF supplemental funding or special education funding. Districts are required to report how they spent their grant funding, but the report is not due to the Legislature until November 2021. In our conversations with districts, districts have indicated they are spending their grants for summer school, tutoring, and wraparound support.
Federal Funding Supports Many of the Same Purposes as State Funding. In addition to state funding, the federal government funds many education programs on an ongoing basis that are focused on addressing poor student performance and poverty (Figure 9). Most notably, the federal government supports supplemental educational services for low‑income students through the federal Every Student Succeeds Act (ESSA) and supports students with disabilities through the federal Individuals With Disabilities Education Act (IDEA). Within ESSA and IDEA, the federal government funds several programs specifically designed to help low‑performing districts improve their academic practices. The federal government also funds Head Start, which is designed to ensure many children from low‑income families receive additional support in their preschool years. Though ESSA, IDEA, and Head Start are relatively large federal grant programs, together they amount to only about one‑third of what the state provides for disadvantaged students.
Figure 9
Ongoing Federal Education Programs for Disadvantaged Students
2019‑20 (In Millions)
|
Program |
Description |
Amount |
|
Every Student Succeeds Act |
||
|
Local grants to address poverty |
Funds LEAs to provide supplemental services to low‑income students. Funds must supplement initiatives supported with state funds, as reflected in the LEA’s LCAP. |
$1,826 |
|
Supporting Effective Instruction Local Grants |
Supports efforts of LEAs to provide low‑income and disadvantaged students with greater access to experienced, effective educators. |
212 |
|
Language acquisition local grants |
Funds LEAs to support English learners. |
142 |
|
School support and improvement |
Provides funds to develop and implement school improvement plans. Plans must be aligned with the LEA’s LCAP. |
127 |
|
Migrant education local grants |
Funds education programs for migrant children to help them meet academic achievement standards. |
108 |
|
21st Century California School Leadership Academy |
Funds professional development for principals and other school leaders. Priority may be given to low‑performing districts. |
14 |
|
Statewide System of School Support |
Funds COEs to support schools identified as low performing. |
10 |
|
McKinney‑Vento Homeless Children Education |
Funds LEAs to provide homeless youth with a range of academic and support services. |
10 |
|
Migrant education state‑level activities |
Provides training to teachers in working with migrant students as well as tutorial services to migrant students. |
9 |
|
Rural and Low‑Income Schools Grant |
Provides rural districts with financial assistance for initiatives aimed at improving student achievement. |
4 |
|
Regional English learner support |
Funds 11 COEs to support LEAs in serving English learners. These COEs are to provide support to English learners in a manner consistent with the statewide system of support. |
2 |
|
Neglected and Delinquent Children |
Funds LEAs to improve educational services, prevent dropout, and promote successful transitions for delinquent, neglected, or at‑risk youth. |
1 |
|
Subtotal |
($2,465) |
|
|
Individuals With Disabilities Education Act |
||
|
Special education local grants |
Funds LEAs to cover the additional costs of educating students with disabilities. |
$1,163 |
|
State‑level activities |
Funds a variety of activities designed to improve the performance of students with disabilities. |
81 |
|
Preschool grants |
Funds special education services for children with disabilities ages three through five. |
39 |
|
Family Empowerment Centers |
Provides information, training, and peer support to the families of children and young adults with disabilities. |
3 |
|
State Improvement Grant |
Funds projects to assist the state in improving educational and other services for children with disabilities. |
2 |
|
Subtotal |
($1,288) |
|
|
Head Start for School Readiness Act |
||
|
Head Start |
Funds preschool, home visits, and other support for children of low‑income families. (Amount shown is for 2018‑19.) |
$1,185 |
|
Total |
$4,938 |
|
|
LEAs = local education agencies; LCAP = Local Control and Accountability Plan; and COEs = county offices of education. |
||
Assessment
Assessment Hones in on a Handful of Key Concerns. This section highlights key concerns emerging from the work group discussions. This section is not intended as a comprehensive account of everything discussed in the work group, nor is it intended to be an exhaustive list of all the potential shortcomings of California’s system of supporting schools and narrowing achievement gaps. Instead, this section reflects our view of the five most significant concerns raised during the work group sessions.
Linking Funding Directly to Low‑Performing Students Has Several Drawbacks. Many in the work group expressed a set of concerns with the Low‑Performing Students Block Grant. One concern was with its basic design, which allocated funding based upon students who were low performing but did not take into account longstanding student achievement gaps. Notably, as a result of this design, approximately one‑third of the block grant funds went to non‑low‑income white students. Some in the work group also expressed concern that linking funding to poor student performance might be perceived as an inappropriate reward. Furthermore, the effectiveness of the grant may have been undermined by its one‑time nature, especially given the persistence of the longstanding achievement gaps it desired to address. As we discuss in the “Legislative Options” section of this report, we believe the state has more promising ways of supporting districts with poor student performance.
Achievement Gap Information Could Be Made Easier to Access. Members of the work group also expressed concern that data on student achievement gaps can be difficult to access. Although the California School Dashboard contains information on performance by student group, progress in narrowing gaps is not prominently displayed. Moreover, members of the work group thought that some districts might benefit from having easier access to a list of districts that had made significant progress in narrowing their achievement gaps, along with information on the key improvement strategies those districts were using. Some work group members also were concerned that information on achievement gaps could be hard to find within districts’ LCAPs. They expressed interest in making these plans more user‑friendly.
School Leadership Is Key, but Leadership Training Might Be Lacking. Districts that have narrowed achievement gaps typically have benefited from several consecutive years of sustained, concerted efforts. Studies find that stable, experienced school district leadership is key to providing such continuity. In contrast, many of the districts that struggle with persistent achievement gaps experience high turnover at the top, such that they lack administrators with local expertise and demonstrated commitment to the long‑term plans that preceded them. These districts also often lack school leaders who know how to use student performance data to inform their improvement efforts. Building upon many earlier efforts to improve school leadership, the state created the California School Leadership Academy in 2019‑20, providing $13.8 million in ongoing federal funding for it. Similar to prior efforts, the core objective of the new academy is to train principals, school administrators, teacher leaders, and mentors such that they can lead successful school improvement efforts. It is still too early to know if the new academy improves upon the state’s past efforts in this area.
Review of LCAPs Focuses on Compliance Rather Than Improving Services. State law tasks COEs with reviewing whether districts fill out the LCAP template correctly, but it does not require COEs to do a qualitative review of district LCAPs. That is, COEs are not tasked with assessing if districts have ascertained their most pressing performance issues, identified promising strategies for improving their performance, and made budget decisions that are well aligned with their improvement plans. Instead, state law tasks COEs primarily with a compliance role—ensuring that the required tasks are undertaken even if undertaken poorly.
While New Systems Are Put in Place, Poor Performance Persists. Many members of the work group expressed frustration that the state had tried so many accountability and improvement strategies, but some districts persisted in having long track records of poor performance. They were concerned with the quality of education that children in those districts were receiving year after year. The group wondered if the state might have more effective options for dealing with these kinds of districts.
Legislative Options
Four Options Appear Most Promising for the State Moving Forward. After identifying shortcomings with the state’s current efforts to narrow student achievement gaps, the work group turned to considering possible options for addressing them. We believe four of the options discussed are particularly promising. Figure 10 lists these options, which we discuss in more detail below. We generally ordered the options from the one requiring the least to greatest amount of time and cost to implement. We encourage the Legislature to consider adopting all four options as a package, but the options could be pursued individually. The options are intended as a starting point for legislative deliberations. If the Legislature were interested in pursuing one or more of the options, more work would be needed to reconvene the affected agencies and craft detailed legislative proposals. Careful scrutiny and time would be needed to ensure the proposals consider all key facets of the issues involved and avoid negative unintended consequences.
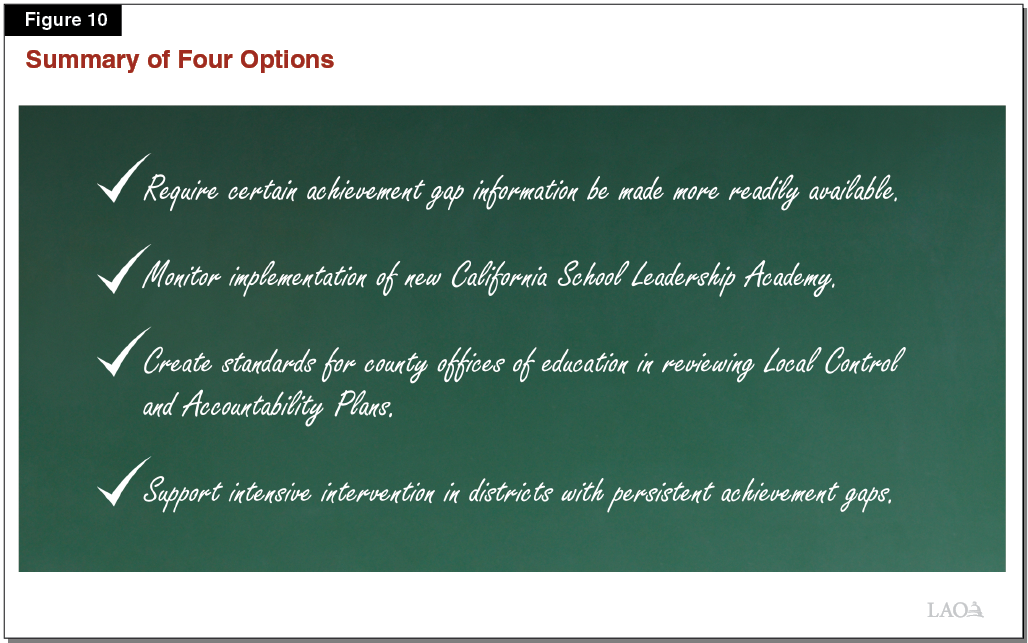
Require Certain Achievement Gap Information Be Made More Readily Available. At a minimum, state law could require that CDE display certain achievement gap data in a more prominent way. For example, state law could require CDE to post the progress of the state and each district in narrowing student achievement gaps over the past five years. In addition to this data, the site might profile districts with particularly good outcomes—those that have made significant progress in narrowing their achievement gaps—along with contact information for the districts’ improvement leads. Knowing which districts are performing well could help other districts identify where to go for help. The site also could include ready access to information about the improvement strategies adopted by districts making good progress so that other districts could learn more easily about what might work for them. Beyond making this information available on CDE’s website, the state might revisit whether any improvements should be made to LCAPs. Though several state efforts have been undertaken to make LCAPs more user‑friendly, and the latest round of refinements was approved just earlier this year, some work group members wondered if further improvements still might be in order.
Monitor Implementation of New California School Leadership Academy. Given the importance of school leadership to school improvement efforts, the Legislature could closely monitor the results from the new California School Leadership Academy. State law directs the CCEE to evaluate the effectiveness of the academy but contains no detail about what CCEE is to track or when the evaluation is due. The Legislature could specify these details. If signs then emerge that the academy might have shortcomings in certain areas, the Legislature could seek to rectify them through subsequent legislation. For example, if recent graduates from the academy report that they still lack proficiency in using data to assess achievement gaps, the academy could be directed to place a greater emphasis on training in this area.
Create Standards for COE Review of LCAPs. Under this option, the Legislature would direct CDE, CCEE, and the COE geographic leads to develop a set of LCAP review standards. For example, COEs could be tasked with examining the link between a district’s identified achievement gaps and its strategies for addressing them. Based upon a holistic review of the district using the new review standards, a COE could assign a qualitative rating to the LCAP—for example, positive, qualified, or negative (borrowing terms COEs already use to review district budgets). A poor LCAP rating would trigger more COE support for the district. Such an approach would make COEs’ role in instructional oversight somewhat more analogous to their role in fiscal oversight. Though we think this is a promising option for the Legislature to consider, we note that COEs vary in their capacity and expertise to review plans. Nonetheless, especially given new support from geographic COE leads, we think LCAP review standards could make the review process more meaningful. Another perceived disadvantage of this option is that COEs have difficulty balancing their oversight and support functions, but this is a common issue among all entities tasked with management‑type functions. Many entities find constructive ways to fulfill both functions.
Support Intensive Intervention in Districts With Persistent Achievement Gaps. Though the state has a crisis assistance program for districts that are fiscally distressed, it has no comparable program for districts with poor academic performance. Under the fourth work group option, the Legislature would establish such a program for districts with significant achievement gaps that have not narrowed over time (despite multiple improvement efforts undertaken over the years). The CCEE would provide these types of districts with intensive intervention and include the applicable COE in the improvement redesign process. The CCEE estimates it could cost as much as $1.5 million per year for three years to work with one of these districts. With that funding, the involved groups (CCEE, COE, and the district) would undertake a comprehensive improvement redesign and realign core spending decisions within the district such that the district uses its ongoing funding more effectively.
Establish Key Elements of Academic Crisis Assistance Program. If the Legislature were to pursue this fourth option, we suggest making the program voluntary, as past state efforts to impose change on unwilling districts appear to have had little positive effect. To this end, the state could accept qualifying districts into the program on a first‑come, first‑served basis. We suggest the program focus on a small set of districts (for example, no more than ten). Keeping the number of districts small could help all the involved groups devote the attention needed to undertaking intensive intervention without spreading their efforts too thin. We also suggest thinking very carefully about accountability under the program. The Legislature would need to consider which of the involved groups to hold accountable if improvement does not occur after three to five years. It also would need to consider how to enforce whatever accountability provisions are established.
Conclusion
Encourage Legislature to Consider New Policies Carefully. If the Legislature is interested in pursuing any of the options laid out in this report or proposed by the Governor, we encourage it to take the time needed to work carefully through all major policy and implementation issues, with the potential goal of having corresponding legislation adopted within the next couple of years. We encourage the Legislature to pay particular attention to how it uses both ongoing and one‑time funding in this context. For example, some one‑time initiatives could have very large payoff whereas others could have no lasting effect. For example, using one‑time funding to provide crisis assistance to a small number of the lowest performing districts who have signaled a willingness both to work with supportive partners and change their spending habits could be the intervention strategy that finally helps them narrow their achievement gaps. In contrast, using one‑time funding so districts can provide summer school for only a year or two might have no sustained effect. Whatever one‑time initiative or set of initiatives the Legislature ultimately pursues, we think it is critically important that districts be required to fundamentally rethink how they use their existing funds on an ongoing basis.