LAO Contact

April 16, 2018
The 2018-19 Budget
Update on K-12 Student Attendance
In early March, we received data from the California Department of Education (CDE) on student attendance for the first half of the 2017‑18 school year (through December). The data suggest that attendance is likely to be slightly lower than the administration assumed in January. Changes in attendance also affect the calculation of the Proposition 98 minimum guarantee. Below, we provide background on school attendance, share the recent attendance data, and discuss the implications for school funding.
Background
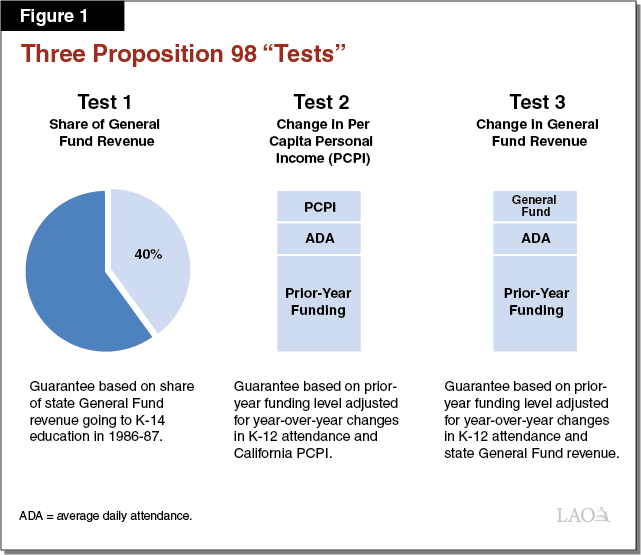
K-12 Student Attendance Affects the Calculation of the Proposition 98 Minimum Guarantee. State budgeting for schools and community colleges is governed largely by Proposition 98, a constitutional amendment approved by California voters in 1988. The measure establishes a minimum annual funding requirement, commonly known as the minimum guarantee. Each year, the minimum guarantee is determined by one of three formulas (or “tests”) set forth in the State Constitution (see Figure 1 below). In most years, Test 2 or Test 3 is the applicable test. In these years, the minimum guarantee equals the amount of funding provided the previous year, adjusted for changes in average daily attendance (ADA) and a growth factor tied to per capita personal income (Test 2) or per capita General Fund revenue (Test 3). For purposes of Proposition 98, ADA consists of the average number of students attending each day of the school year across all school districts, charter schools, and county offices of education in the state. For example, if an average of 1,000 students attend a given school district each day of the school year, that district would contribute 1,000 ADA to the statewide total.
Two-Year “Hold Harmless” Provision Applies When Attendance Begins to Decline. Although the state generally adjusts the minimum guarantee for changes in attendance whenever Test 2 or Test 3 applies, the State Constitution provides an exception when attendance begins to decline. Specifically, the Constitution specifies that the minimum guarantee is not adjusted downward for declines in ADA unless attendance declined the two previous years. This provision insulates school funding from short-term declines in attendance. Since 1988, this provision has affected the calculation of the guarantee six times, zeroing out attendance declines in 2005‑06, 2006‑07, 2009‑10, 2012‑13, 2014‑15, and 2015‑16. (This constitutional provision is separate from the statutory provision allowing individual school districts to have their Local Control Funding Formula allotments based on the higher of their current- or prior-year attendance.)
School Districts Report Attendance Data Three Times Per Year. State law requires schools to report their ADA to the state three times per year. The first report (known as “P-1”) covers attendance data from the beginning of the school year through December. The CDE certifies this report in late February. The second report (known as “P-2”) runs from the beginning of the school year through April 15. The CDE certifies this report in late June. The third report (known as “Annual”) covers the entire school year and is certified in February of the following year. For purposes of calculating the minimum guarantee, the state considers school district and charter school attendance to be final as of the P-2 report and county office of education attendance to be final as of the annual report. The P-1 report typically overestimates final ADA because it does not account for students who leave during the middle of the school year (for example, students who move out of the state or drop out of school). As Figure 2 below shows, however, this overestimation is small and relatively stable over time. Over the past three years, final attendance has been 0.63 percent lower on average than the level reflected in the P-1 report.
Figure 2
Comparing P‑1 and Final Attendance Reports
|
P‑1 Attendance |
Final Attendancea |
Change |
||
|
Amount |
Percent |
|||
|
2014‑15 |
6,018,231 |
5,981,713 |
‑36,518 |
‑0.61% |
|
2015‑16 |
6,010,673 |
5,971,790 |
‑38,883 |
‑0.65 |
|
2016‑17 |
5,999,168 |
5,960,770 |
‑38,398 |
‑0.64 |
|
Three‑Year Average Change |
‑37,933 |
‑0.63% |
||
|
aFinal attendance consists of school district and charter school attendance as of the P‑2 report and county office of education attendance as of the annual report. |
||||
Administration’s Attendance Assumptions
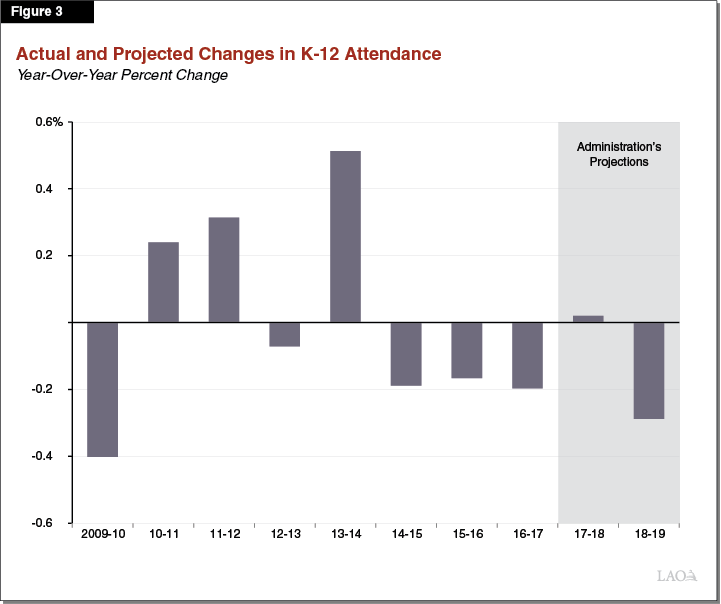
Governor’s Budget Assumes Attendance Will Increase in 2017‑18 but Decline in 2018‑19. Figure 3 below shows the actual percent change in statewide attendance from 2009‑10 through 2016‑17 and the projections included in the Governor’s budget for 2017‑18 and 2018‑19. Actual data through 2016‑17 show attendance has increased in some years and decreased in other years. Due to the hold harmless provision, the state did not adjust the guarantee for declining attendance except in 2016‑17 (which marked the third consecutive year of a decline). The Governor’s budget assumes attendance will grow slightly in 2017‑18 (by 0.02 percent, equivalent to about 1,200 students). It also assumes attendance will then decrease by 0.29 percent (about 17,000 students) in 2018‑19. Given its assumption of attendance growth in 2017‑18, the administration applied the hold harmless provision and calculated the 2018‑19 guarantee with no downward adjustment. (For calculating the minimum guarantee, the Governor’s budget projects that Test 2 will apply in 2017‑18 and Test 3 will apply in 2018‑19.)
Updated Attendance Data
P-1 Data Suggest K-12 Attendance Is Likely to Decline in 2017‑18. Data provided by CDE show that statewide ADA for 2017‑18 totaled 5,997,029 as of the P-1 report. Assuming that final ADA is 0.63 percent lower than this level (the average over the past three years), final ADA would be 5,959,248. This lower level would represent a year-over-year decrease of 0.03 percent, compared with the 0.02 percent increase assumed in the Governor’s budget. Even making a more conservative assumption that P-1 to final data drops the smallest percentage experienced over past three years (0.61 percent), attendance still would decline slightly in 2017‑18. Though attendance would decline in 2017‑18 under either assumption, the difference between declining and growing attendance is very small. The state, therefore, cannot be certain a decline will occur in 2017‑18 until final data become available next year.
Lower 2017‑18 Attendance Would Lead to Lower Guarantees in 2017‑18 and 2018‑19 Relative to Governor’s January Estimates. Assuming final attendance in 2017‑18 is 5,959,248, the 2017‑18 guarantee would decrease by $22 million relative to the level in the Governor’s budget. In addition, a year-over-year decline in 2017‑18 attendance means the hold harmless provision would no longer apply to the calculation of the 2018‑19 guarantee. Holding all other factors constant, this change would reduce the 2018‑19 guarantee by $250 million relative to the level in the Governor’s budget. Another way to think about this drop is that it negates a large portion of the increase in the Proposition 98 guarantee that could occur if state revenue were to increase beyond the level assumed in the Governor’s budget. (As discussed in our February Analysis of the Governor’s budget, additional revenue could increase the 2017‑18 and 2018‑19 minimum guarantees by as much as a few hundred million dollars, holding other factors constant.)
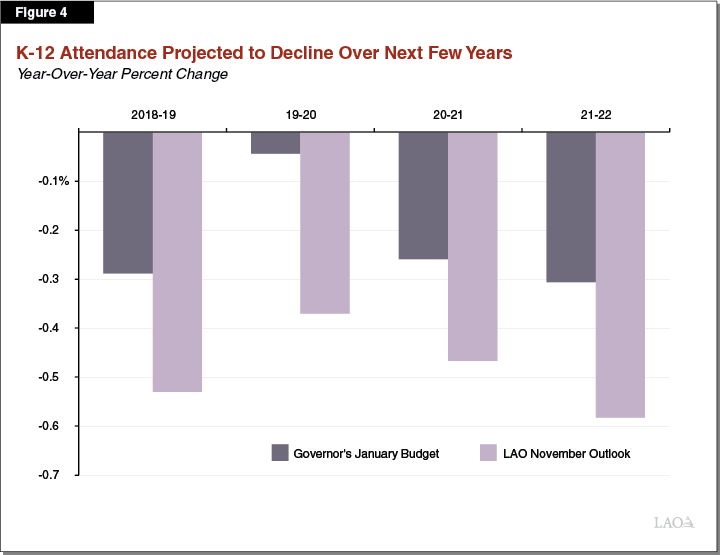
Attendance Expected to Continue Declining Over the Next Few Years. Both our office and the administration update our out-year attendance projections periodically. Figure 4 below shows projected attendance changes through 2021‑22 as reflected in the Governor’s budget and our November fiscal outlook (our office’s latest out-year estimates). Both of our offices project declining attendance over the next few years, with the decline somewhat steeper under our outlook. The projected statewide decline in attendance is likely to put downward pressure on the minimum guarantee and result in somewhat slower growth in school funding compared to previous years. (In May, our office and the administration will release updated out-year attendance projections, though attendance updates released in May typically are minor.)