In the coming years, more and more aging homeowners likely will look to sell their homes. This surge in sales should boost local government property tax collections. These potential property tax gains are likely to be offset by an increase in the transfer of homes from parents to children which, unlike most home sales, does not trigger higher tax payments.
LAO Contact

June 20, 2017
How Will Aging Baby Boomers Affect
Future Property Tax Revenues?
Summary
California’s homeowners are getting older. In recent years, this has contributed to declining property sales and depressed property tax growth. As California’s homeowners continue to age, however, these patterns are likely to reverse. Home sales likely will pick up. This, in turn, should lead to faster property tax growth, especially in communities with more older homeowners and where past home price appreciation was highest. These potential future property tax gains could be lessened by an increase in transfers of homes from parents to children, which often are exempt from revaluations that trigger higher property tax payments. These parent-to-child exclusions have been a notable and consistent share of home transfers in recent years, currently reducing annual property tax revenues by around $1.5 billion statewide. This amount is likely to grow in the future as homeowners continue to age and look to transition their properties to their children.
Turnover Key to Property Tax Growth
Under Proposition 13, Property Turnover Drives Property Tax Growth. Proposition 13 was a landmark decision by California’s voters in 1978 to limit property taxes. One key provision of Proposition 13 was a switch from taxing property based on its market value (what it could be sold for) to taxing it based on its purchase price. In the year a property is purchased, it is taxed at its purchase price. Each year thereafter, its taxable value is increased by inflation or 2 percent, whichever is lower. Upon resale, it is again taxed at its purchase price. Under this system, most homes are taxed at a value well below what they could be sold for. Property sales therefore typically trigger an increase in a property’s taxable value. This, in turn, leads to higher property tax collections for local governments.
Turnover of Certain Homes Generates More Property Taxes. The bump in property taxes from home sales is highest for homes with long-tenured owners and homes with significant past appreciation in their market values. This is because the difference between a property’s taxable value and market value tends to grow with increases in the (1) length of time the home has been owned and (2) pace of appreciation in the home’s market value.
Slow Turnover Has Depressed Past Revenue Growth
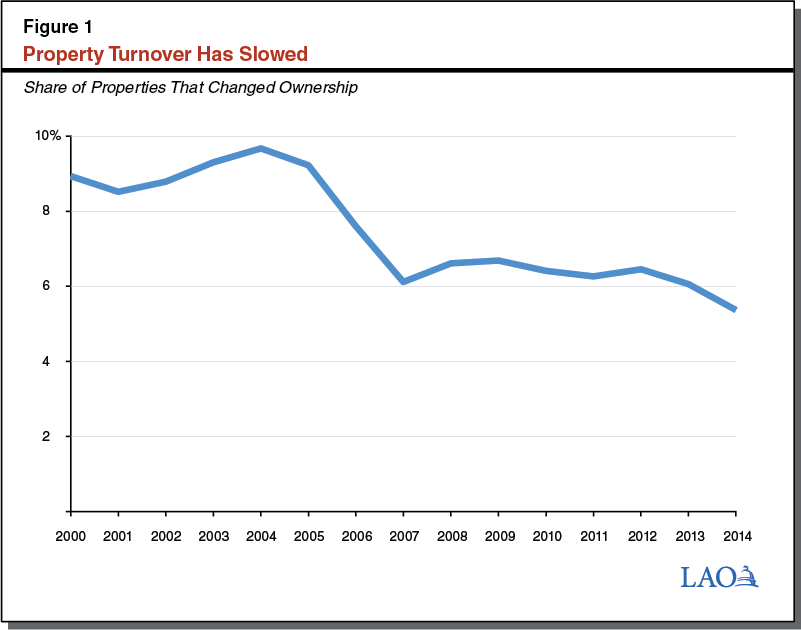
Past Declines in Property Turnover Have Depressed Property Tax Growth. Property turnover has been on a downward trajectory for many years—as can be seen in Figure 1. Because of the importance of turnover to property tax growth, this slowdown has depressed property tax growth. We previously discussed how this depression of property tax growth has been evidenced by the fact that recent gains in home prices have translated into less new property taxes than in the past.
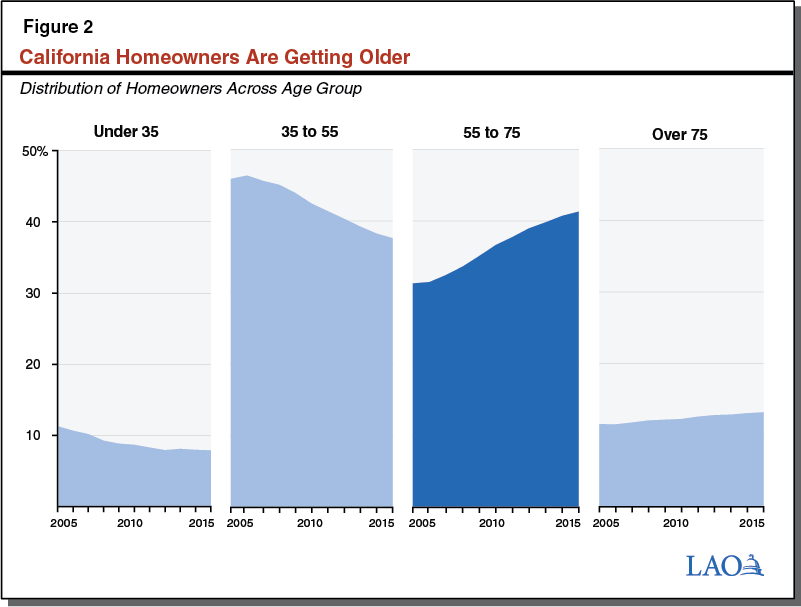
Aging Population Contributes to Falling Turnover. Several factors contribute to declining property turnover, including Proposition 13. Another major contributor is that the state’s homeowners are getting older. Figure 2 shows how the age composition of homeowners has changed in recent years. The share of homes owned by 55 to 75 year olds has been growing for several years, increasing from 31 percent in 2005 to 41 percent in 2015. At the same time, this share dropped from 46 percent to 38 percent for ages 35 to 55 and from 11 percent to 8 percent for those under 35.
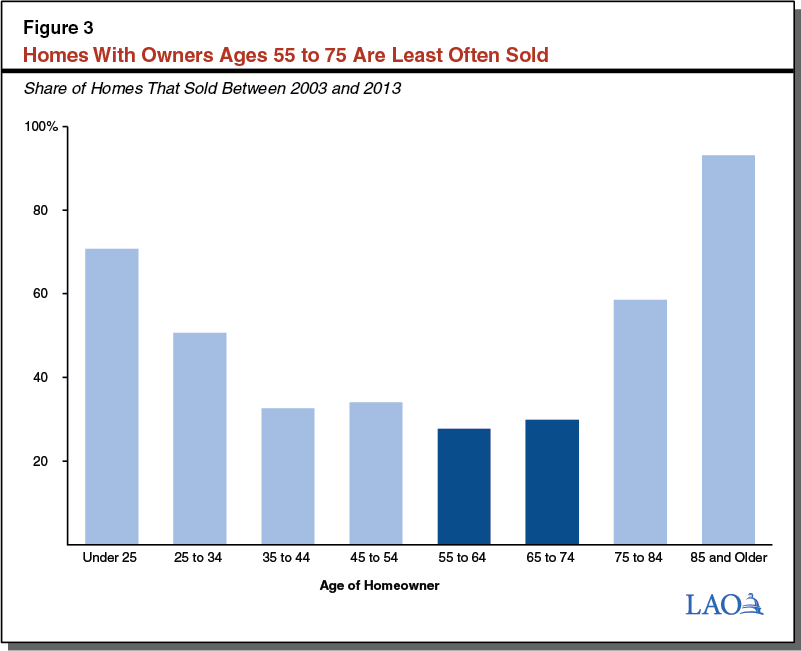
As Figure 3 shows, homeowners between ages 55 and 75 tend to be less likely to sell their homes than other homeowners, both younger and older. Because of this, as more and more homeowners fall into this age group, home sales have slowed.
Higher Turnover and Property Tax Growth Likely in Future
Home Sales Likely to Pick Up as Homeowners Get Older. Although the aging of California’s homeowners has depressed home sales in past years, this pattern is likely to reverse in the future. As California’s homeowners continue to age—transitioning from the 55 to 75 age group to the over 75 age group—more and more will begin to downsize, move into assisted living or with family, or die. When this occurs, home sales are likely to rise. Between 2003 and 2013, over two-thirds of homes in California with owners 75 or older were sold to a new owner, compared to less than one-third of homes with owners ages 55 to 75.
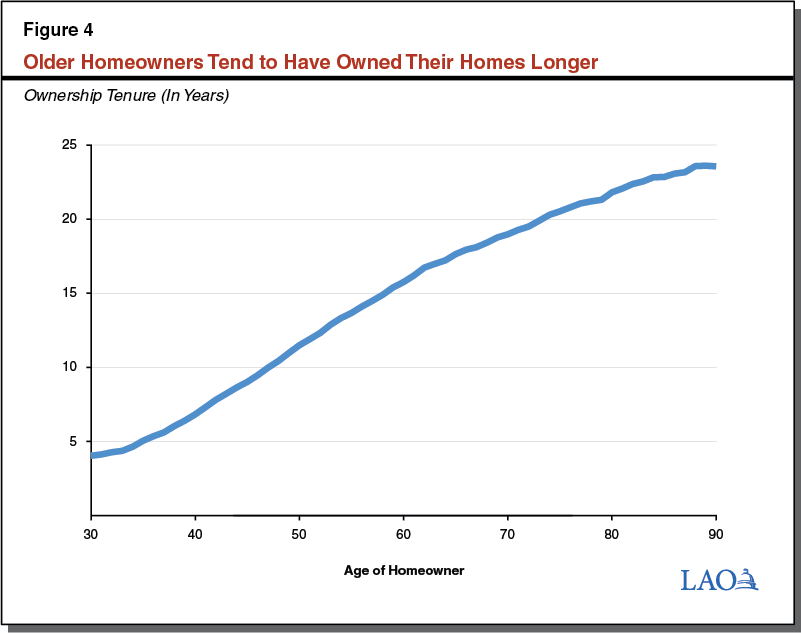
Older Homeowners Tend to Have Owned Their Homes Longer. Homeownership tenure tends to increase with age. Figure 4 demonstrates this relationship. The typical 25 to 35 year old homeowner has been in their home for about four and a half years. In contrast, the typical homeowner over 65 has been in their home for over 20 years. A consequence of this is that the aging of California’s homeowners will not just increase turnover, it will increase turnover of homes that have not changed hands in many years.
Uptick in Sales by Long-Tenured Owners Would Accelerate Property Tax Growth. As discussed above, turnover of properties that have been owned for many years generates the greatest boost in property tax revenues. An increase in home sales by older homeowners therefore could mean a significant uptick in property tax revenues for local governments in coming years.
Potential for Future Property Tax Gains Vary Across Communities. Potential property tax gains from rising turnover among older homeowners will vary across communities. This variation will be based on two key factors (1) concentration of older homeowners and (2) past home price appreciation. Communities with higher concentrations of older homeowners generally will see a bump in property tax revenue. The extent of this effect, however, will depend on past home price appreciation in the community. The largest boost in revenues will come in communities where home prices have risen the most in past years. Where prices have not risen as sharply, revenue gains will be smaller.
Examining Different Types of Communities. Figure 5 demonstrates how these factors drive future property tax growth potential and its variation across communities. The vertical axis plots the share of homeowners in each community who are over 65 years old, increasing from bottom to top. The horizontal axis shows the average disparity ratio for homes in each community, increasing from left to right. A disparity ratio is a property’s market value divided by its taxable value. Disparity ratios provide a good measure of the extent to which past home price appreciation has driven a wedge between homes’ taxable values and market values. The higher the value, the greater the wedge. The center of the graph (where the axes cross) represents the average of all the communities—30 percent of homeowners over 65 and a disparity ratio of 1.5.
Figure 5 (Interactive)
Potential Property Tax Gains From Sales By Older Homeowners Vary Across Cities
California Cities With Populations 60,000 or More, 2015
(Mouse Over Elements for More Information)
Each quadrant of the graph above demonstrates one of four general types of communities:
Top Right: Older Homeowners, Higher Home Price Growth. Cities in this group—such as Palo Alto, Santa Barbara, and Walnut Creek—have both a high concentration of older homeowners and high past home price growth. These cities have the greatest potential for future revenues gains due to sales from older homeowners.
Top Left: Older Homeowners, Lower Home Price Growth. Cities in this group—such as Hemet, Redding, and Richmond—have a significant amount of older homeowners but have experienced less home price growth in prior years. Potential revenues gains are more moderate for these cities.
Bottom Right: Younger Homeowners, Higher Home Price Growth. Cities in this group—such as Lakewood, Mountain View, and Santa Clara—have experienced high home price growth but have fewer older homeowners. Potential revenues gain also are moderate for these cities.
Bottom Left: Younger Homeowners, Lower Home Price Growth. Cities in this group—such as Fontana, Palmdale, and Perris—have fewer older homeowners and have experienced less home price growth. These cities have the least potential for revenue gains.
Use of Inheritance Exclusions Could Rise, Dampening Property Tax Growth
Different Rules Apply to Homes Passed From Parents to Children. In general, when a home is transferred to a new owner, its taxable value is reset to its purchase price. California voters, however, passed Proposition 58 in 1986, which amended the California Constitution to exempt transfers between parents and children (and later grandparents and grandchildren under certain circumstances under Proposition 193 [1996]) from revaluation. This allows a child to inherit their parent’s lower taxable property value.
Parent-to-Child Exclusions Have Had a Notable Impact on Revenues. Over the past decade, around 10 percent of property transfers have taken advantage of the parent-to-child exclusion to prevent an increase in property tax payments. Figure 6 shows how many of these exclusions have been used each year during the past decade.
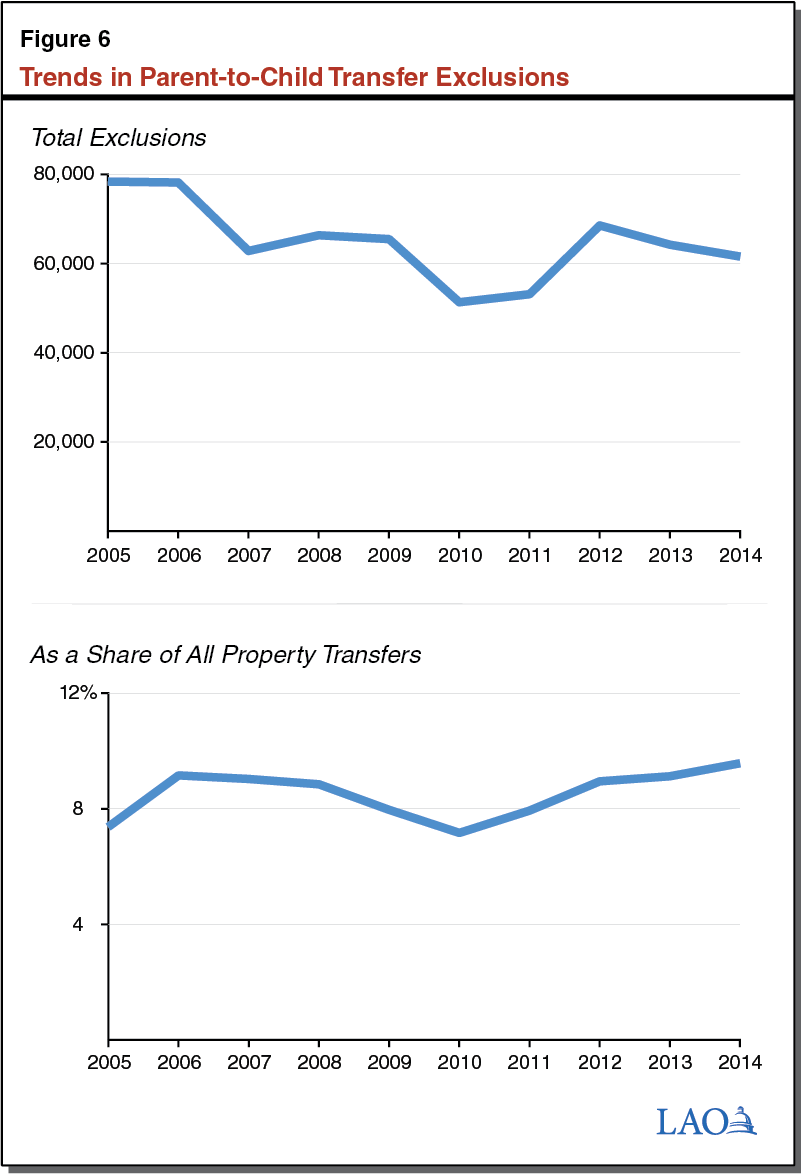
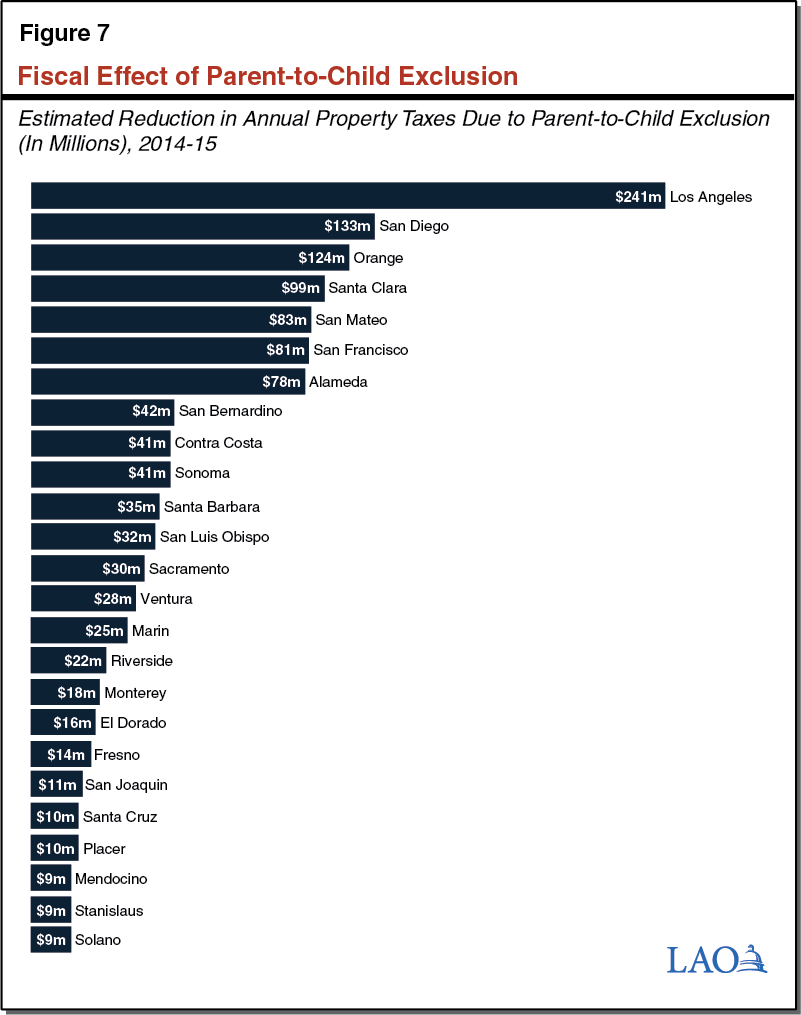
The widespread use of this exclusion has had a notable effect on local government property tax revenues. We estimate that in 2014-15 parent-to-child exclusions reduced statewide property tax revenues by around $1.5 billion from what they would be in the absence of the exclusion. This is about 2.5 percent of total statewide property tax revenue. This share is higher in some counties, such as San Luis Obispo (7 percent), El Dorado (6 percent), Sonoma (6 percent), and Santa Babara (5 percent). Figure 7 reports our estimates of these fiscal effects for the 25 counties where these effects are the largest.
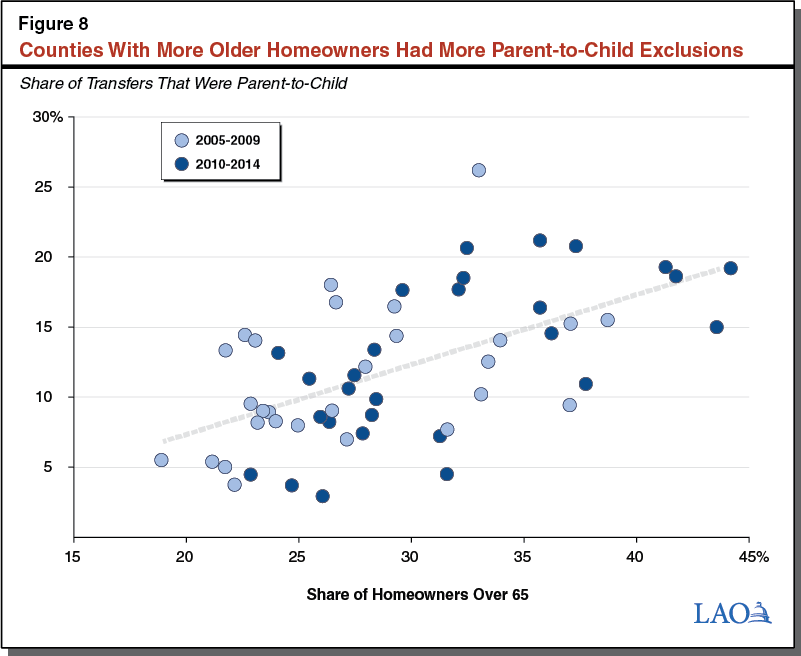
Increase in Parent-to-Child Exclusions Could Offset Future Property Tax Gains. It is likely the fiscal effect of this exclusion will grow in future years as California’s homewoners continue to age and look to transition their homes to their children. Recent experience supports this expectation. As Figure 8 shows, during the past decade counties that had more older homeowners also had more parent-to-child exclusions. This suggests a relationship between aging homeowners and parent-to-child exclusions. Should an uptick in exclusions occur, this could erode some of the potential future property tax gains expected from the continued aging of California’s homeowners.