
 Report in PDF
LAO Report
January 4, 2017Income Mobility in California Across Generations
- Introduction
- Defining and Measuring Income Mobility
- Broad Income Mobility in California
- Place–Specific Income Mobility in California
- Conclusion
- Technical Appendix
Executive Summary
Intergenerational Income Mobility. Intergenerational income mobility is the extent to which children move up (or down) in the income distribution relative to their parents. Many factors can affect children’s income mobility. These include geographic factors—like the safety of their neighborhoods or the quality of their schools—their parents’ decisions, and their own characteristics. In this report, we examine intergenerational income mobility in California using estimates published by researchers Raj Chetty, Nathaniel Hendren, and their coauthors.
Californians’ Income Mobility Somewhat Higher Than National Average. Rates of intergenerational income mobility in California are somewhat above the national average. This means that, on average, children born to low–income parents in California earn slightly higher incomes as adults than their peers in other states.
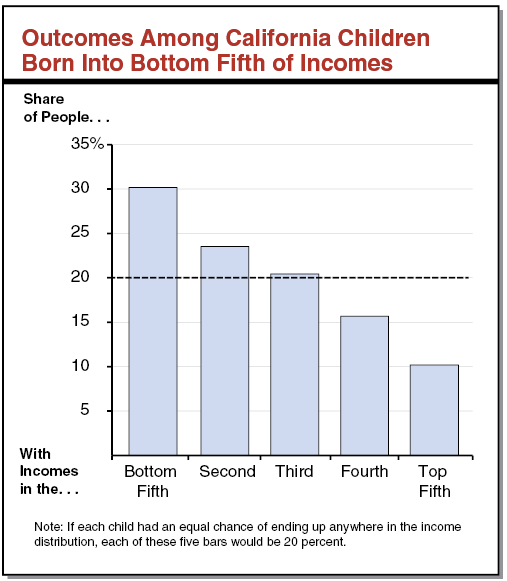
Outcomes Among Children Born Into Bottom Fifth of Incomes. The figure below displays outcomes for Californian children born into households in the bottom 20 percent of national incomes. Over half of these children remain in the bottom two–fifths as adults, while about one–fourth end up in the top two–fifths as adults. Compared to their peers nationwide, this group of Californians has greater upward mobility. Nationally, 21 percent of those born in the bottom fifth end up in the top two–fifths.
Californians’ Higher Mobility Not Due to Living in California. The evidence in this report suggests that Californian children have higher rates of income mobility because of their parents’ and their own characteristics, not because growing up in California results in more mobility. On average, growing up in California results in somewhat lower adult earnings for children compared to living elsewhere in the United States. “Growing up in California” includes all geographic factors that affect a child’s income mobility, including school quality, neighborhood safety, and community interactions. According to the Chetty and Hendren estimates, had these children grown up somewhere else, they would have experienced slightly greater upward income mobility.
Effects Vary Within California. While growing up in California results in lower future earnings for low–income children on average, there is a great deal of variation in these outcomes at a local level. Within California, growing up in a particular county can increase or decrease a child’s future annual income by a couple of thousand dollars.
Traits of Places That Produce More Income Mobility. The fact that different places produce more or less intergenerational income mobility leads to a natural question: What causes these differences? As a first step in answering this difficult question, we highlight some of the characteristics of places that produce more income mobility. These include: lower rates of violent crime, better performance on some school metrics, stronger social networks, higher shares of middle–income households, and larger shares of two–parent households. However, these do not necessarily reflect cause–and–effect relationships.
Introduction
Equality of opportunity—the idea that all children should have a chance to succeed as adults—is a key motivation for many state policies. However, this abstract idea is difficult to quantify, so researchers investigate it indirectly by examining other related concepts. One such related concept is “intergenerational income mobility”—the extent to which children attain higher (or lower) incomes than their parents. In this report, we use estimates from academic studies to assess intergenerational income mobility in California. In general, we expect to observe more mobility if opportunities are more equal. Consequently, these estimates may signal how effectively California is promoting equality of opportunity for its residents.
Defining and Measuring Income Mobility
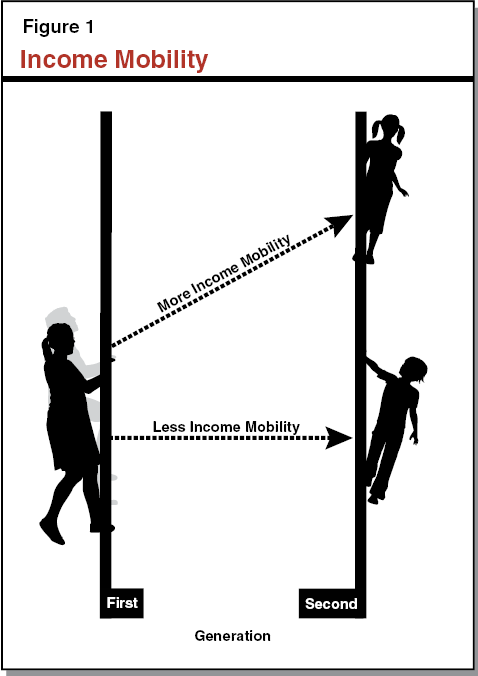
Definition of Intergenerational Income Mobility. Intergenerational income mobility is the extent to which individuals move up (or down) in the income distribution relative to their parents. As shown in Figure 1, the child who moves further in the income distribution, relative to her parents, has greater income mobility. For simplicity, throughout this report, we often refer to this concept as “income mobility” or just “mobility.” (While greater mobility leads to movement both up and down the income distribution, this report focuses primarily on upward mobility for low–income children.)
Income Mobility Varies Across Places. In some cities, counties, and neighborhoods, low–income children tend to earn much higher incomes relative to their parents. In other places, low–income children tend to attain outcomes similar to—or sometimes worse than—their parents’ outcomes.
Places Influence Children’s Mobility . . . The places (neighborhoods, cities, counties, states, or countries) where children grow up can influence their earnings later in life. For example, some neighborhoods have relatively low crime rates, and some school districts have relatively high–performing public schools. These or other factors could mean that growing up in certain places results in better economic outcomes for children later in life.
. . . But Other Factors Also Influence Children’s Mobility. Many other features of childhood and upbringing also influence income mobility. Children’s own characteristics, as well as their parents’ characteristics, resources, and childrearing decisions influence children’s later–life outcomes regardless of where they grow up. For example, parents influence their children’s economic outcomes by teaching them reading skills or helping them build grit or willpower. Parents and children’s own characteristics may be even more important to children’s mobility than the effect of places.
Two Measures of Income Mobility. In this report, we consider two ways to measure income mobility. The first is broad and the second is place–specific. Specifically:
- The broad measure of mobility reflects all of the factors that affect children’s outcomes—including geographic factors, parenting decisions, and a child’s own characteristics.
- The place–specific measure of mobility attempts to isolate just one set of factors that affect mobility—the effect of growing up in a particular place, holding other, non–geographic factors constant. These geographic factors may include, for example, the safety of the neighborhood where a child grows up. In other words, this measure shows the effect on mobility of growing up in a particular place.
About the Estimates. The estimates in this report come from research published by Raj Chetty, professor of economics at Stanford University, Nathaniel Hendren, assistant professor of economics at Harvard University, and their team of researchers. (Throughout, we refer to this group as “Chetty and Hendren” or “the researchers.”) Chetty and Hendren used two decades of tax return data from 5 million families to assemble a uniquely rich data set. They measure income using pre–tax income from labor market earnings and capital (for example, from the sale of stocks or bonds), as well as unemployment, social security, and disability benefits. Together, these form the most important sources of income for a large majority of Californians. The researchers have published their estimates of income mobility at the county level for nearly all counties in the United States. For more methodological information on these estimates, see the technical appendix.
Back to the TopBroad Income Mobility in California
In this section, we present two broad measures of intergenerational income mobility for children who grew up in California in the 1980s and 1990s. First, we describe broad income mobility focusing only on children born to low–income families. Then, we examine broad income mobility throughout the income distribution, including for children born to middle– and high–income families.
Mobility for low–income Children
Measuring Broad Income Mobility for low–income Children. The broad measure of mobility presented in this section primarily relies on estimates by researchers Chetty and Hendren. In constructing this measure, the researchers follow children who were born between 1980 and 1991 and whose families had incomes at the 25th percentile of the national income distribution. (In our analysis, we focus on the researchers’ results for those children who grew up in California.) The researchers measure these children’s household earnings when they are in their early thirties and rank them in the national income distribution. As a result, the estimates presented here capture mobility for children growing up in California in the 1980s and 1990s.
Hypothetical Example. Consider the example of a girl who was born in 1982 and grew up in San Jose. When she was young, her family’s income was in the 25th percentile of the income distribution. As an adult, she moved up to the 46th percentile of the national income distribution. In the 2012 income distribution (to illustrate these figures in dollar terms), her family’s annual income would have been $26,000, and her adult annual income would be $48,000.
Income Mobility Nationwide. In the United States, income mobility for children born to parents in the 25th percentile varies greatly in dollar terms. As displayed in Figure 2, on average, U.S. children born to parents in the 25th percentile move up to the 43rd percentile as adults. This is the equivalent of moving from an annual income of $26,000 to $44,000 in 2012 dollar terms. On a state level, the average adult income rank for these children ranges from the 37th percentile (in North Carolina) to the 53rd percentile (in North Dakota). The corresponding range of annual household incomes is $37,000 to $56,000.
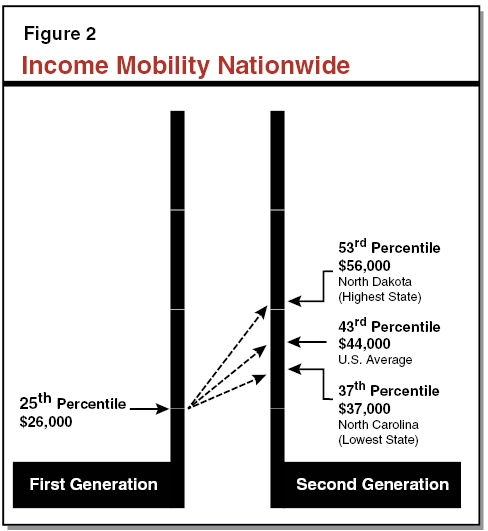
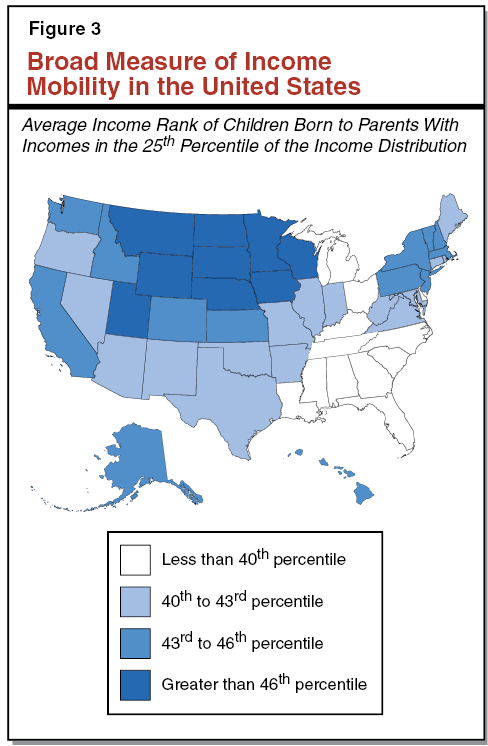
Income Mobility in California. low–income Californians experience rates of income mobility that are somewhat greater than the rest of the United States. In California, the average child born to parents in the 25th percentile moves up to the 44th percentile (with an annual household income of $45,000) as an adult. Figure 3 shows how, on this measure of mobility, California compares to other U.S. states. While mobility is higher in some parts of the Mountain West and Midwest, income mobility in California is high compared to Southern states, and comparable to some other Western states, the Mid–Atlantic, and much of New England.
Mobility in California From the Top, Middle, and Bottom
In this section, we provide a more complete picture of income mobility in California. Specifically, we describe how mobility varies throughout the income distribution, including for children born in the bottom, middle, and top. (While this section focuses on outcomes in California, the figures below refer to quintiles in the national income distribution.)
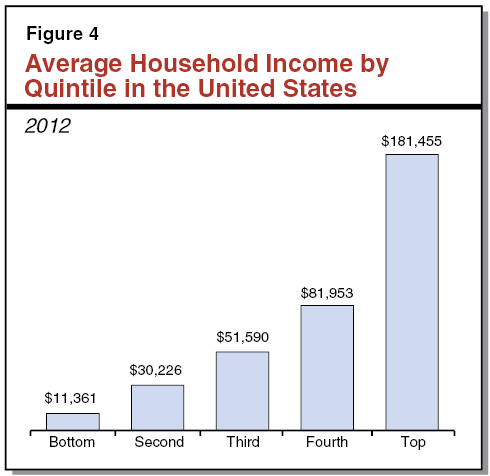
Outcomes Among Children Born Into Bottom Fifth of Incomes. Figure 4 displays average household earnings by quintile in 2012. Households in the bottom fifth earned an annual average income of $11,361 in 2012. Figure 5 displays adult income outcomes for children born to households in the bottom quintile. Over half of California children born to parents in the bottom fifth remain in the bottom two–fifths as adults. About one quarter of these children end up in the top two–fifths as adults.
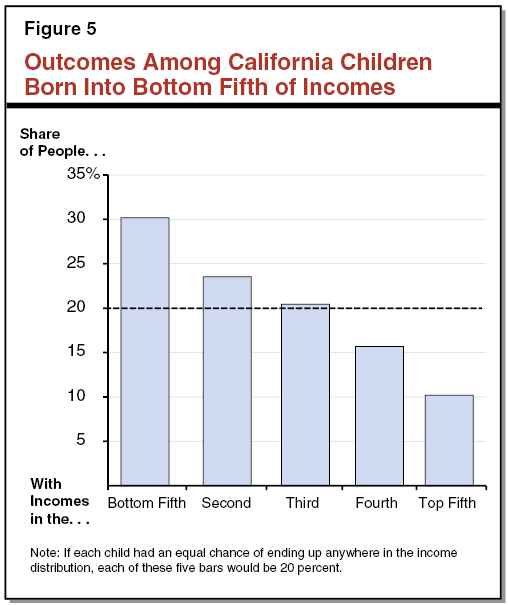
Mobility among this group in California is greater than in the United States. Nationally, about 60 percent of those born in the bottom fifth remain in the bottom two–fifths. Just over 20 percent of these children end up in the top two–fifths as adults.
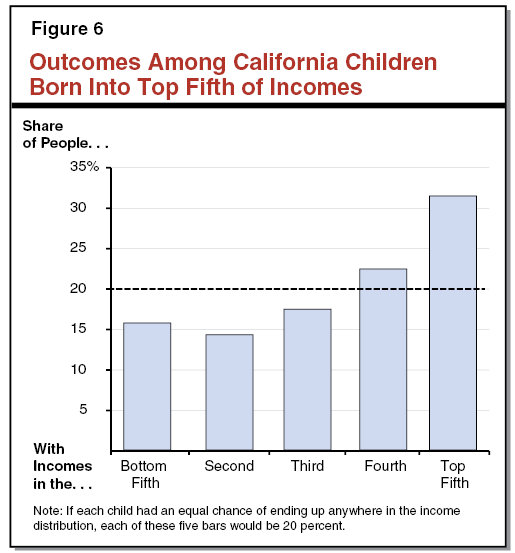
Outcomes Among Children Born Into Top Fifth of Incomes. Figure 6 shows that 53 percent of Californian children born in the top fifth remain in the top two–fifths as adults. Meanwhile, 30 percent end up in the bottom two–fifths as adults. Compared to the country as a whole, Californians born in the top fifth of the income distribution are less likely to remain in the top two–fifths (53 percent rather than 58 percent) and more likely to end up in the bottom two–fifths (30 percent rather than 24 percent).
Those Born at the Top and Bottom Are Less Mobile. Figure 7 displays the share of Californians born into each fifth of the income distribution who remain in the same part of the distribution as adults. For reference, if children’s outcomes were completely unrelated to their parents’ incomes (and measured precisely), 20 percent of those born in each quintile would remain in the same quintile. As the figure indicates, those born in the middle experience substantial mobility. Just over 20 percent of those born in each of the three middle fifths of the income distribution remain in those respective fifths as adults. By contrast, there is less mobility at the top and bottom of the income distribution. More than 30 percent of those born in the bottom fifth or top fifth remain there as adults.
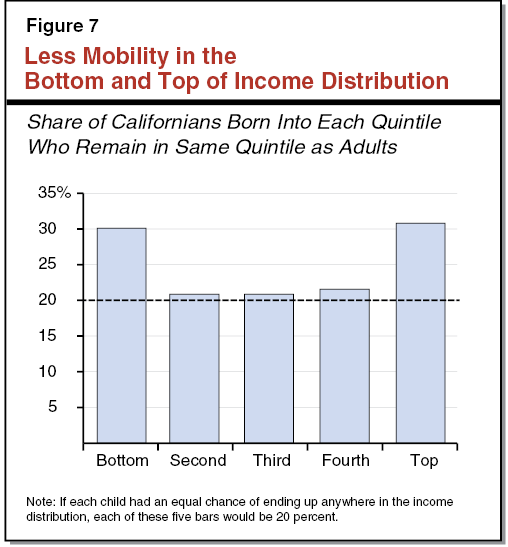
Similar Pattern Nationwide. The mobility pattern described in Figure 7 for California is similar to the pattern nationally. The Chetty and Hendren data suggest that, nationally, 33 percent of those born in the bottom stay there while 35 percent of those born at the top stay there. Some researchers have referred to this phenomenon as “stickiness” at the ends of the income distribution.
United States Has More Stickiness Than Other Developed Counties. Another report compares mobility statistics in the United States to a handful of other industrialized nations. Using different data (and different methods to make the data comparable across countries), these researchers found that children born in the bottom fifth in Denmark, Finland, Sweden, Norway, and the United Kingdom are much more mobile than children born in the bottom fifth in the United States.
Back to the TopPlace–Specific Income Mobility in California
In this section, we present the place–specific measure of income mobility in California. The place–specific measure attempts to isolate just the effect of growing up in a particular place on mobility. That is, the measure aims to capture the extent to which different places produce more (or less) mobility for the children who grow up in them, setting aside non–geographic factors such as parental characteristics and children’s abilities. The evidence presented by Chetty and Hendren suggests that the place a child grows up affects his or her later–life income mobility. The longer a child spends in a place, the larger the effect.
How Place Can Influence Mobility. Many geographic factors can affect mobility. Some of these factors are relatively recognizable. For example, the quality of children’s education, the strength of social networks around them, and the extent to which they are exposed to violent crime all could affect their future earnings. However, growing up in a particular place may affect future earnings for a wide variety of other reasons. For example, a child who grows up in San Francisco—which has a strong job market—may be more likely to stay in San Francisco as an adult. Growing up in San Francisco, therefore, may benefit the child through her adult labor market opportunities.
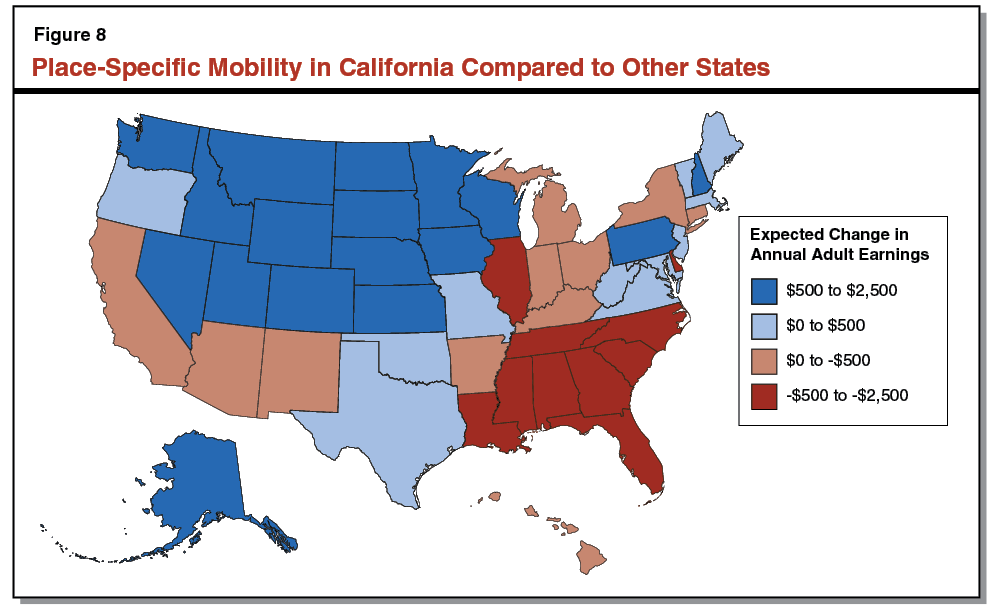
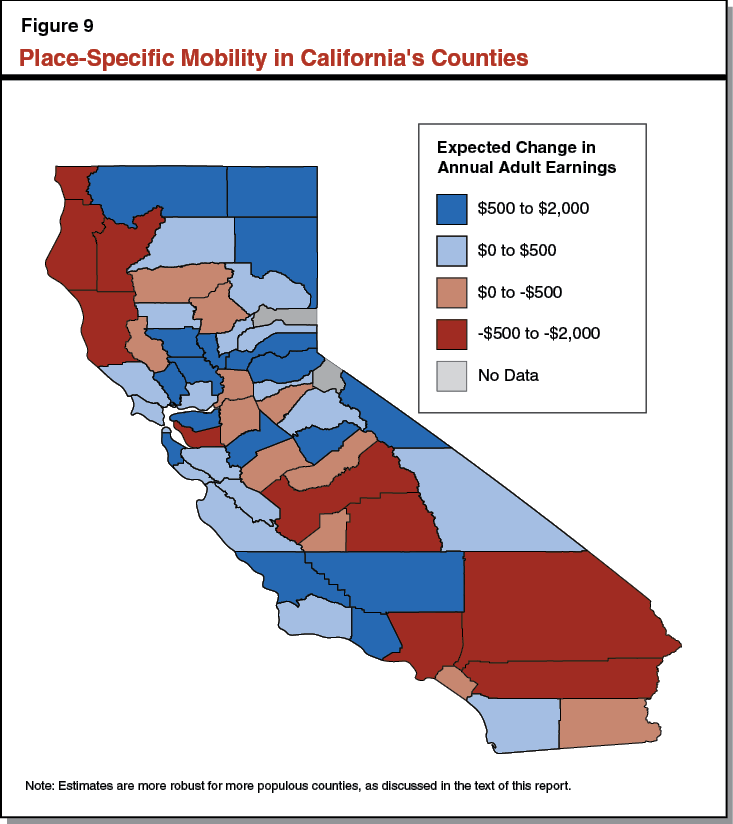
Measuring Place–Specific Income Mobility for low–income Children. Like the broad measure discussed above, the place–specific measure of income mobility uses the average adult income of children born to parents in the 25th percentile of the national income distribution. In dollars, it estimates how much more (or less) a child could expect to earn as an adult annually if her parents chose to move to a particular state early in her life. Throughout this section (including in Figures 8 and 9), we report this effect assuming children have spent at least ten years of childhood in a particular place. We also refer to this place–specific measure of income mobility as the “effect of growing up” in a particular place. (For a more complete explanation of how the researchers estimated these place–specific measures of income mobility, see the technical appendix.)
An Interpretation: Parents’ Location Choices. Here is one way to interpret this measure. Where could low–income parents move in order to maximize their children’s future earnings? (We note that parents move for many other reasons as well.) To answer this question, the parents would need to know which place provides the best opportunities for their children to succeed—not necessarily which place’s residents happen to have the highest rate of mobility.
Hypothetical Example. To explain the place–specific measure of mobility, we refer back to the hypothetical child who grew up in San Jose discussed earlier. Her parents’ annual income was $26,000 and, as an adult, her annual household income is $48,000. How much of this gain can we attribute to the fact that she grew up in San Jose (rather than other advantages like her own skills or her parents’ efforts)? The effect of growing up in San Jose answers this question. Suppose that she spent ten years of her childhood in San Jose and that the effect of growing up in San Jose (instead of a nationally average place) is an annual earnings gain of about $30 for each year the child spends there. In that case, her annual earnings as an adult are $300 higher because she grew up in San Jose—while the remainder of the difference is the result of other factors.
Place–Specific Mobility Lower in California Than Rest of Nation. Earlier, we noted that compared to the nation, Californians’ broad measure of income mobility (which considers both geographic and non–geographic factors) is relatively high. By contrast, as shown in Figure 8, California’s place–specific measure of mobility is low. low–income parents who move to California can expect to reduce their child’s future annual earnings by $407, relative to moving to an average place nationally. As above, this estimate assumes children spend at least ten years of their childhood in California. This number represents the best statistical “bottom line” for the state, but it obscures a great deal of variation across different parts of California.
Place–Specific Mobility Varies Widely Across California’s Counties. California’s place–specific mobility is a statewide average of the effect of growing up in each of California’s counties. This –$407 average reflects several counties with effects below –$1,000, many counties with small positive or negative effects, and several counties with effects above $1,000. Figure 9 displays the effect of growing up in each county for children born to low–income parents. For example, assuming a child spends at least ten years of childhood there, the map shows low–income parents would increase their child’s expected annual adult earnings by about $700 by moving to San Mateo County (relative to moving to the average county nationwide). This map represents a change in annual earnings that ranges from –$1,761 to $1,963 per year. Nationwide (among counties that are at least as large as those for which we have data in California) the effects range from –$4,840 to $4,805.
Effects Very Likely Vary Within Counties. There is likely a great deal of variation in place–specific mobility within a county, city, or even a neighborhood. For example, two children in San Francisco can grow up a mile apart but experience dramatically different childhood environments. Ideally, we would like to observe place–specific mobility at a smaller geographic level than the county. However, counties are the smallest level provided by the researchers’ estimates. In fact, for California, these are the most geographically detailed estimates available from any source.
Measurement Problems in Rural Counties. The place–specific measure of mobility relies on people moving from one county to another. During the study period, tens of thousands of people moved between California’s populous counties, like Los Angeles, Fresno, and Santa Clara. As a result, there are relatively robust estimates available for these counties. Fewer people, however, moved to or between California’s less populated, rural counties like Modoc and Mariposa. As a result, the estimates for these counties are less reliable.
What Kinds of Places Produce More Mobility?
Traits of Places That Produce More Mobility. The fact that different places produce more or less income mobility leads to a natural question: What are the features of places that cause these differences? This is a very difficult question to answer. As a first step in the process of answering it, the researchers examine a list of factors that may be associated with higher rates of place–specific mobility. From this list, they identify several common characteristics of places that produce greater mobility. (They study these traits at a national level, so some of these findings may apply to California and others may not.) These characteristics include:
- Lower Rates of Violent Crime. Places that produce greater mobility tend to have fewer murders, rapes, robberies, and aggravated assaults.
- Better Performance on Some School Metrics. Places that produce greater mobility tend to have schools with higher student test scores, lower student dropout rates, smaller class sizes, and more expenditures per student.
- Stronger Social Networks. Places that produce greater mobility tend to have greater social cohesiveness or stronger social connections. Although social networks cannot be observed directly, researchers have developed other indicators to measure these attributes indirectly (for example, by measuring membership in community, religious, and other organizations).
- Higher Share of Middle–Income Households. Places that produce greater mobility tend to have larger shares of middle–income households, and they have smaller income differences between the highest–income and lowest–income households.
- Larger Shares of Two–Parent Households. Places that produce greater mobility tend to have smaller shares of single–parent households, smaller fractions of divorced adults, and higher fractions of adults that are married.
Together these factors are a good starting point for further investigation, but they do not necessarily reflect direct cause–and–effect relationships. For example, the fact that places that produce more mobility tend to have lower crime rates does not necessarily mean that reducing crime would lead to greater mobility.
Back to the TopConclusion
Broad Mobility Somewhat Above Average. The broad measure of mobility in California reflects all of the characteristics of California and its residents—including geographic factors, parenting decisions, and Californians’ own characteristics. California performs somewhat above the national average on the broad measure of mobility.
Place–Specific Mobility Addresses Some Additional Questions. Following the broad measure of mobility, a natural next question to ask is: To what extent does California’s above–average mobility reflect the effect of growing up in California versus the characteristics of people who happen to live in California? The measure of place–specific mobility addresses this question.
Place–Specific Mobility Generally Lower in California Than National Average. The place–specific measure of mobility aims to capture the extent to which the state produces more (or less) income mobility than other places, setting aside non–geographic factors such as parental influence and children’s abilities. As discussed earlier, California’s place–specific income mobility for low–income children is below average. Although this is not necessarily an outcome of public policy, it does suggest improvement is possible.
Some California Counties Have Higher Place–Specific Mobility Than the National Average. The place–specific measure of mobility for the entire state is an average of this measure for each county. Some counties in California have higher—in some cases much higher—place–specific mobility than the national average. Others have lower place–specific mobility. As noted earlier, place–specific mobility also certainly varies within counties, but within–county data are not available.
Californians’ Higher Mobility Not Due to Living in California. California has above average broad mobility, but below average place–specific mobility. This finding suggests that Californian children have higher rates of income mobility because of their parents’ and their own characteristics, not because growing up in California results in more mobility. This means that, had these Californian children grown up somewhere else, they likely would have done even better as adults, according to the Chetty and Hendren estimates.
Policy Relevance of Place–Specific Mobility. By its construction, place–specific mobility measures—albeit imperfectly and indirectly—the extent to which some places create opportunities or remove barriers for low–income children to attain higher incomes. This means place–specific mobility is a better measure of how effectively the state is producing income mobility—either through public policy or otherwise. As such, it may be of keener interest to policymakers.
Available Evidence Leaves Some Key Questions Unanswered
Relative Measures Alone Do Not Demonstrate Success or Failure. Note that the measure of place–specific mobility presented here does not compare California to any absolute, or ideal, standard. Rather, it compares California to the national average. As a result, it can lead to a variety of conclusions, depending on one’s own views regarding opportunities and barriers nationwide. Clearly, those who are dissatisfied with opportunities at the national level should also find California’s below–average performance unsatisfactory. For those with a more positive view of nationwide opportunities, assessing California is more difficult. For those with this view, California’s below–average performance may be unsatisfactory, or may be close enough to the average that it is still acceptable.
Analysis Examines Relative, Not Absolute, Income Mobility. Relative mobility is the extent to which children move up (or down) in the income distribution relative to their parents. Absolute mobility, meanwhile, considers underlying economic growth that affects standards of living. For example, parents and their children may all be at the 50th percentile, but the children may be better off if incomes have increased. The analysis presented in this report focuses on relative, not absolute, income mobility. Estimates of absolute mobility are not available at a comparable level of geographic detail.
Estimates Limited to Specific Part of Income Distribution. The place–specific measure of mobility only considers one narrow slice of the income distribution: those born to parents with incomes in the 25th percentile. Estimates for other parts of the income distribution—which clearly are also of interest to policymakers—would yield different results. For example, the place–specific measure of mobility could be substantially lower or higher for those born, say, at the 10th percentile or 30th percentile. Such findings could significantly alter assessments of economic opportunity in California.
Income Is Just One of Many Outcomes to Consider. The estimates in this report focus on one long–term outcome for low–income children: their incomes as adults. However, both policymakers and parents typically are interested not only in children’s future incomes, but also in other aspects of well–being, such as health, leisure time, and job satisfaction. Parents may move to a different place to enjoy better weather, to be able to afford a larger house, or to be close to activities and recreational opportunities that improve their family’s quality of life. Places that perform well along these other dimensions—for example, places that produce longer life expectancies for low–income children—may not be the same as the places that produce more income mobility. Consequently, places that produce greater mobility are not necessarily more desirable places to live.
Back to the TopTechnical Appendix
This report presents estimates of a variety of measures of intergenerational income mobility, as estimated by researchers Raj Chetty and Nathaniel Hendren. This appendix provides more details about how these researchers produced the estimates of the place–specific measures of mobility, as well as some strengths and weaknesses of their approach.
Estimation of the Place–Specific Measure of Income Mobility in California
Estimates of the place–specific measure of mobility attempt to isolate the effect of growing up in California on a child’s future earnings. In principle, the best way to estimate this effect would be to examine outcomes in two hypothetical worlds: one where a set of individuals grew up in California and another where those same individuals grew up somewhere else. However, in the real world, researchers must estimate these effects using observed data on people in California and elsewhere.
Method of Estimation. At the most basic level, Chetty and Hendren estimate the place–specific measure by comparing outcomes among parents who move to a particular place when their children are different ages. In our view, this comparison generates a more credible estimate of causal relationships than the broad measure alone. The researchers assume that parents who move to California are similar, regardless of the age of their children when they move. This assumption is reasonable even if different places attract different types of people—as long as those differences remain constant over the time period studied. Using this assumption, the researchers can measure the effect of spending a year in a particular place as the difference between outcomes of demographically similar movers who move when their children are a year apart.
To reduce noise in the estimates, the researchers blend the place–specific measure of mobility with the broad measure of mobility. In particular, they weight the broad measure more heavily when less reliable data are available for the place–specific measure. This means that, for counties with small populations, the estimates to a large degree reflect the broad, rather than the place–specific, measure of mobility. This blended approach creates an arguably more credible estimate than either approach alone.
The researchers also use a variety of other techniques to validate these individual estimates. For example, they compare the outcomes of siblings to one another. They also study community–level moves triggered by external events, such as a natural disaster or the closure of a large plant.
Simplified Estimation Example. Suppose the researchers want to measure the difference between the effect of growing up in San Francisco and the effect of growing up in Oakland. The researchers compare the outcomes of many children who move to San Francisco from Oakland at various ages. For example, they compare the adult earnings of children who move at age 6 and demographically similar children who move at age 5. Suppose they find that children who move at age 5 can expect to make about $400 per year more than children who move at age 6. The researchers conclude that this $400 difference is the result of spending an additional year in San Francisco rather than Oakland. (Note that a place that produces greater mobility is not necessarily more desirable overall.)
These Measures Are Not Adjusted for Cost of Living. Throughout this series, we use estimates of income mobility that have not been adjusted for the cost of living. With a few exceptions, such an adjustment does not substantially affect these estimates. In general, adjusting for prices in a high–priced area like San Francisco reduces both the child’s income rank and the parents’ income rank. As a result, a child’s rank in the income spectrum does not change much relative to the parents’ rank. This result holds if the child remains in the same city as an adult or moves to a similarly high–priced area. As a result, income mobility—that is, the difference between the child’s and the parent’s rank—is largely unaffected.
Strengths and Weakness of This Approach
Estimation Issues. The place–specific estimates of mobility may be misleading if: (1) few people move to a given place, limited data are available, making the estimates less reliable; (2) people who move to a certain place are different from people who already live there; or (3) parents who move with young children are different from parents who move with older children. If parents are different, then these estimates would not reflect a true cause–and–effect relationship. This is because these estimates are generated by comparing parents who move with children at different ages. If these parents are dissimilar, then they do not serve as appropriate comparisons. If parents who move are fundamentally different from those who do not, the findings of this study may not be generalizable to those who do not move, because the estimates do not incorporate their outcomes directly.
Focus on Specific Birth Cohorts. Both the broad and place–specific measures of income mobility reflect data on the adult earnings of children born between 1980 and 1991. As a result, these estimates capture the effect of growing up in California in the 1980s and 1990s. However, conditions in California have changed and will continue to change over time. The data do not tell us how income mobility has evolved over time or what the effect of growing up in California is today.
Aggregate Measures Do Not Apply to All Individual Cases. The aggregate measure of place–specific mobility presented in this report does not apply to all individual cases. Many people who move to California will experience outcomes that are different than these averages.
Overall Patterns Are Informative. On the whole, Chetty and Hendren’s research lends credibility to the idea that the places children grow up affects their adult earnings later in life. They also indicate that conditions at a local level—and therefore local and state–level policies—may be important determinants of income mobility. As a result, the estimates presented in this report are a potentially useful starting point for considering a wide range of policy issues. However, the caveats above should make the reader cautious. In particular, the reader should not place too much confidence in any single estimate of the place–specific measure of mobility, particularly for small and rural counties.