With a state as big, as populous, and as complex as California, it would be impossible to quickly summarize how its economy or state budget works. The purpose of Cal Facts is more modest. By providing various "snapshot" pieces of information, we hope to provide the reader with a broad overview of public finance and program trends in the state.
Cal Facts consists of a series of charts and tables which address questions frequently asked of our office. We hope the reader will find it to be a handy and helpful document.
—Mac Taylor, Legislative Analyst

 Report in PDF
Cal Facts
December 5, 2016
CAL FACTS Criminal Justice
California Crime Rate Near Historic Low
Crimes Per 100,000 Population
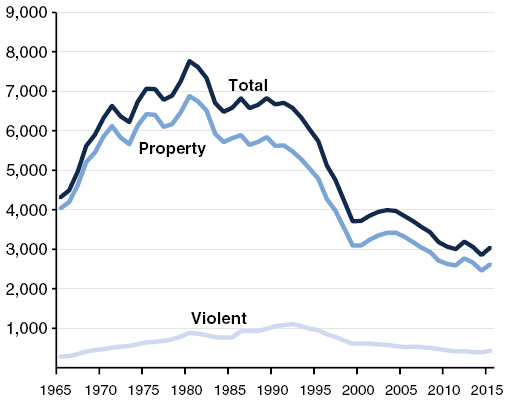
- California has experienced a decline in the property crime rate since 1980 and in the violent crime rate since 1992. Between 1980 and 2015, the state’s overall crime rate declined by about 60 percent. This decline is similar to trends in crime patterns in the rest of the United States.
- In 2015, about 3,000 crimes were committed in California per 100,000 residents—a total of about 1.2 million incidents. Of these crimes, 86 percent were property and 14 percent were violent crimes.
- California’s property crime rate is 5 percent higher than the nationwide rate and its violent crime rate is 14 percent higher than the nationwide rate.
State and County Correctional Populations Have Declined
Number of Offenders
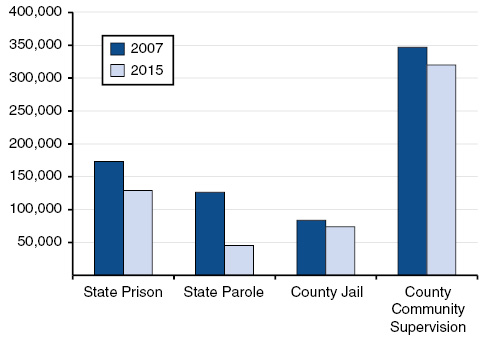
- California’s total correctional population has declined by 22 percent, from a high of over 730,000 offenders in 2007 to 568,000 offenders in 2015. This is primarily due to a decline in state prison and parole populations.
- While the county jail and community supervision populations have declined somewhat, the share of total offenders under county jurisdiction has increased from 59 percent to 69 percent over the same time period.
- The changes in the size and makeup of the correctional population are largely related to various changes in sentencing law. For example, the 2011 realignment shifted responsibility for housing and supervising some felons from the state to the counties. In contrast, Proposition 47 (2014) changed some crimes from felonies to misdemeanors, reducing both state and county correctional populations.
Most Inmate Costs Related to Security and Health Care
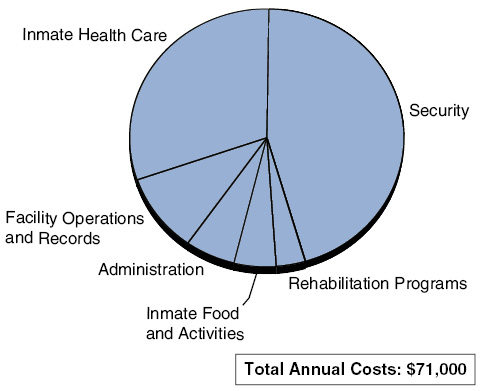
- In 2016-17, the average annual cost to incarcerate an inmate in prison is estimated to be about $71,000. The primary cost drivers are security (such as correctional officer pay)—which accounts for 45 percent of the total—and health care—which accounts for 30 percent.
- Since 2006-07, the average annual cost to incarcerate an inmate has increased by $29,000, or about 70 percent. This increase has been driven by various factors, including (1) employee compensation, (2) increased inmate health care costs, and (3) operational costs related to additional prison capacity to reduce prison overcrowding.