In This Report
LAO Contact: Justin Garosi

April 7, 2016
Options for Modifying the State Child Care Tax Credit
Executive Summary
Background. The federal government established a nonrefundable child care tax credit in 1976. Since 1977, California has sporadically offered a similar credit. From 2000 to 2010 the state credit was refundable, allowing those tax filers with no state tax liability to receive some benefit from the credit. Today, the state credit is not refundable and therefore only benefits those filers with child care expenses and state tax liability. As part of the Supplemental Report of the 2015–16 Budget Package, the Legislature stated its intent to provide a refundable state child care tax credit to low– and middle–income families. As such, the Legislature directed our office to provide options for consideration. This report is in response to that requirement.
Four Options Presented. The options presented in this report make the credit refundable again, but otherwise retain most of the structural features of the state credit as it exists today. For instance, all options conform to the federal credit with regard to the eligible dependent limit (two) and eligible expenses (up to $3,000 per dependent). Maintaining this basic structure provides the most straightforward comparison to today’s law. Generally, the options presented differ in terms of the resulting revenue loss, the extent to which different income ranges benefit, and the maximum value of the credit. Revenue losses under the options range from $98 million to $157 million per year and the maximum benefit ranges from $903 to $1,680 per year, per family. (All options are based on the current minimum wage of $10 per hour. Recent changes to the minimum wage will affect the estimates presented in these options in future years.)
Many Trade–Offs to Consider. If the state child care tax credit were made refundable again it would provide a noticeable income boost to California working families and also encourage participation in the formal labor market to some extent. As noted above, this report retains many of the features of the credit as it exists today; however, other options could achieve other policy goals. For example, increasing or eliminating the two–dependent limit would make the program modestly more expensive but could benefit households with more than two dependents. Providing different credit amounts based on the age of the child or the quality of the provider may have policy merits as well. The Legislature will want to consider these other policy goals against the added complexity of the credit as it determines how it might modify the child care tax credit.
Introduction
The Child and Dependent Care Expenses Credit (“child care tax credit” or “credit”) is a provision of the state income tax code that allows filers with income below $100,000 to reduce their tax liability by a percentage of their eligible child care expenses. The 2015–16 Budget Act required our office to prepare a report providing options to extend the credit to low– and middle–income families not currently receiving child care subsidies. This report provides an analysis of the costs, benefits, and trade–offs associated with these options.
Background
Federal tax law allows filers to reduce their tax liability by a percentage of their eligible child care expenses. The state credit “piggybacks” off the federal credit, meaning that a filer’s state credit equals a percentage of the federal credit. Below, we describe the federal and state credits in more detail and provide additional context about child care. In the nearby box, we describe the difference between tax credits—such as the child care tax credit—and tax deductions.
Tax Credits Versus Tax Deductions
A taxpayer’s liability is determined by applying the relevant tax rates to their taxable income. A tax credit can be used to reduce a taxpayer’s final liability after tax rates are applied. For example, the California income tax allows all single filers a personal exemption credit of $109. A taxpayer with a tax liability of $1,000 before applying the credit would have a final liability of $891 after applying the credit. In contrast, a deduction is used to reduce taxable income before tax rates are applied. For example, the state income tax allows all single filers a standard deduction of $4,044. A taxpayer with a gross income of $40,000 would have a taxable income of $35,956 after subtracting out the standard deduction. A key policy difference between credits and deductions is that credits have the same value for all taxpayers, while deductions are more valuable to taxpayers who are in higher tax brackets. To illustrate, the standard deduction reduces tax liability by $162 for a filer in the 4 percent bracket ($4,044 multiplied by 4 percent), but $376 for a filer in the 9.3 percent bracket ($4,044 multiplied by 9.3 percent).
Child Care Services
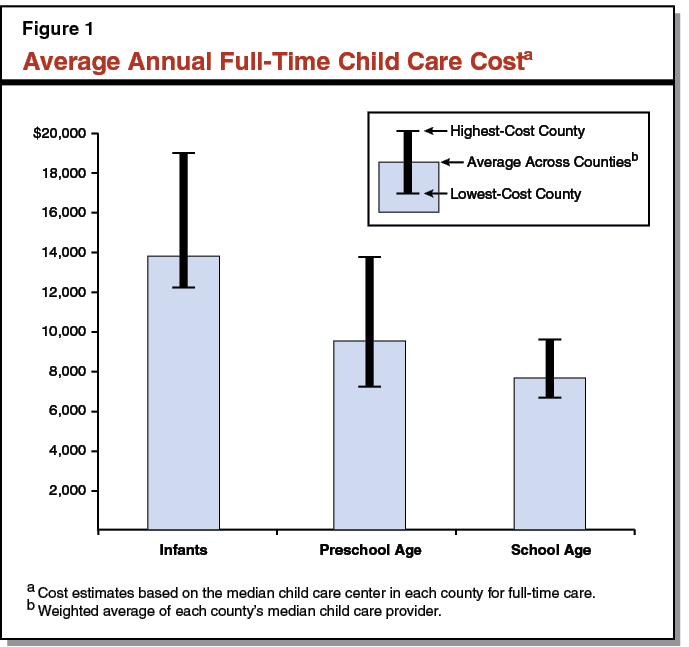
Range of Providers. Parents receive child care services formally from two types of providers. Child care centers, which on average care for 50 children, typically are more expensive, as they have higher staffing ratios. By comparison, family child care homes typically serve fewer than ten children. These are less expensive because the provider operates in his or her home and has only one or two employees. Some families choose informal care settings, like their own extended family, friends, or neighbors. Because these caretakers are not licensed with the state, we do not have data on how much families typically pay these types of providers.
Families’ Child Care Costs Significant. As seen in Figure 1, child care costs in California vary significantly by county and age of the child. For example, as shown in the figure, median child care costs for an infant in full–time care range from around $12,000 per year in the lowest–cost county to around $19,000 per year in the highest–cost county, with a weighted average statewide of almost $14,000. The average cost of full–time care is considerably less for a preschooler (about $10,000) or a school age child (around $8,000). Still, these costs take up a considerable share of family income—particularly for lower– and middle–income families.
Federal Credit
Credit Amount. The federal credit partially reimburses filers for child care expenses up to $3,000 per year for one dependent under the age of 13 or up to $6,000 per year for two or more dependents. (In general, filers may also claim expenses for a spouse or dependent who is living with the filer for most of the year and is unable to care for themselves.) The credit’s limits on expenses are far below most families’ child care costs. Figure 2 shows the federal credit percentages by income range. The credit is 35 percent of eligible expenses for filers making less than $15,000 per year. As filers’ incomes increase the value of the credit decreases, reaching 20 percent of expenses for filers making $43,000 or more per year.
Figure 2
Federal Credit Percentages by Income Range
|
Income Range |
Percentage of Expenses |
|
$0 to $15,000 |
35% |
|
$15,000 to $17,000 |
34 |
|
$17,000 to $19,000 |
33 |
|
$19,000 to $21,000 |
32 |
|
$21,000 to $23,000 |
31 |
|
$23,000 to $25,000 |
30 |
|
$25,000 to $27,000 |
29 |
|
$27,000 to $29,000 |
28 |
|
$29,000 to $31,000 |
27 |
|
$31,000 to $33,000 |
26 |
|
$33,000 to $35,000 |
25 |
|
$35,000 to $37,000 |
24 |
|
$37,000 to $39,000 |
23 |
|
$39,000 to $41,000 |
22 |
|
$41,000 to $43,000 |
21 |
|
Over $43,000 |
20 |
Example: Couple With Two Children in Child Care. Assume a couple filing a joint return had two dependents in child care in 2014, with child care costs totaling $16,000. One spouse made $50,000 and the other made $7,000, for a total combined income of $57,000. As shown in Figure 2, this couple is eligible for a credit equal to 20 percent of their expenses. Because their child care costs exceed the federal limit of $6,000 for two or more dependents, the couple’s eligible expenses would equal $6,000. The couple is therefore eligible for a federal credit equal to 20 percent of $6,000, or $1,200.
Federal Credit Is Nonrefundable. The credit is nonrefundable. This means that it cannot reduce the filer’s final tax liability below zero. For example, the couple from the example above was eligible for a credit of $1,200 based on their income and expenses. If their total income tax liability before subtracting the credit amount was just $200, however, their credit would be limited to $200 (the amount that would reduce their final tax liability to zero).
Credit Potentially Limited by Second Earner’s Income. According to the Internal Revenue Service, child care expenses must be incurred so that the filer (and their spouse in the case of joint returns) can work or look for work. Accordingly, on joint returns the amount of eligible expenses cannot exceed the second earner’s income. (Certain filers are exempted from this requirement, including full–time students.) Assume the second spouse in the example above made only $2,000 in 2014 rather than $7,000. Combined with the first spouse’s income of $50,000, their $52,000 in total income would make them eligible for a federal credit equal to 20 percent of their eligible expenses. Like the example above, assume the couple had total child care expenses of $16,000 for their two children. Because the second earner’s income is only $2,000, however, the filers cannot claim more than $2,000 in eligible expenses. The couple in this case would be eligible for a credit equal to 20 percent of $2,000, or $400. (As the credit is nonrefundable, they would not be able to claim the full $400 on their return if their federal tax liability were less than $400.)
Eligible Providers. In certain cases, the federal government restricts the type of child care provider that can be used. Specifically, a provider cannot be the filer’s spouse, the filer’s dependent—such as in the case of an older child providing child care for a younger sibling—or a parent of the qualifying child. Costs under other arrangements, however, are eligible whether the provider has a license or not.
Credit Not Indexed for Inflation. Both the income bracket thresholds and the maximum allowable expenses stay fixed in dollar terms unless the Congress passes a bill to change them. This is in contrast to most federal income tax provisions (most notably the income brackets for tax rates, the personal exemptions, and standard deduction), which are automatically indexed for inflation every year.
State Credit
Similar to Federal Credit. The state credit is structured like the federal credit in most respects: it is nonrefundable, not adjusted for inflation, eligible expenses are limited to $3,000 for each of up to two dependents, and the credit amount declines as the filer’s income increases. Unlike the federal credit, the state credit has an income limit: filers making over $100,000 a year (as measured by federal adjusted gross income) cannot claim the state credit. As Figure 3 shows, the state credit equals a portion of the federal credit. Specifically, the state credit equals 50 percent of the federal credit for filers with incomes between $0 and $40,000, 43 percent for incomes between $40,000 and $70,000, and 34 percent for incomes between $70,000 and $100,000. As the figure shows, this works out to 17.5 percent of eligible expenses for incomes between $0 and $15,000, decreasing to 6.8 percent of expenses for incomes between $70,000 and $100,000. As we describe later, however, lower income filers generally do not benefit from the nonrefundable state credit because they do not have a positive state tax liability.
Figure 3
Federal and State Credit Percentages by Income Range
|
Income Range |
Federal Credit (Percentage of Expenses) |
State Credit (Percentage of Federal Credit) |
State Credit (Percentage of Expenses) |
|
$0 to $15,000 |
35% |
50% |
17.5% |
|
$15,000 to $17,000 |
34 |
50 |
17.0 |
|
$17,000 to $19,000 |
33 |
50 |
16.5 |
|
$19,000 to $21,000 |
32 |
50 |
16.0 |
|
$21,000 to $23,000 |
31 |
50 |
15.5 |
|
$23,000 to $25,000 |
30 |
50 |
15.0 |
|
$25,000 to $27,000 |
29 |
50 |
14.5 |
|
$27,000 to $29,000 |
28 |
50 |
14.0 |
|
$29,000 to $31,000 |
27 |
50 |
13.5 |
|
$31,000 to $33,000 |
26 |
50 |
13.0 |
|
$33,000 to $35,000 |
25 |
50 |
12.5 |
|
$35,000 to $37,000 |
24 |
50 |
12.0 |
|
$37,000 to $39,000 |
23 |
50 |
11.5 |
|
$39,000 to $40,000 |
22 |
50 |
11.0 |
|
$40,000 to $41,000 |
22 |
43 |
9.5 |
|
$41,000 to $43,000 |
21 |
43 |
9.0 |
|
$43,000 to $70,000 |
20 |
43 |
8.6 |
|
$70,000 to $100,000 |
20 |
34 |
6.8 |
|
Over $100,000 |
20 |
— |
— |
Example: Couple With Two Dependents in Child Care. Earlier, we described how the federal credit works for a couple with two dependents in child care. A couple with income of $57,000 and eligible expenses of $6,000 is eligible for a federal credit of 20 percent of their expenses, or $1,200. In addition, the couple would be eligible for a state credit equal to 8.6 percent of their $6,000 in eligible expenses, or $516. In total, the couple would receive child care credits of $1,716. (As the credits are nonrefundable, the couple would not be able to claim amounts greater than their tax liability at the federal or state level.)
Fewer Taxpayers Benefit From State Credit Than From Federal Credit. Figure 4 shows usage of the federal and state credits by California taxpayers in 2013. The number of filers who took the state credit (about 180,000) is far lower than the number of filers who took the federal credit (about 669,000). This is mainly due to two factors. First, certain features of the state personal income tax, including dependent credits and low marginal tax rates at lower income levels, result in no state tax liabilities for many filers who have some federal tax liability. As such, many filers who receive the federal credit cannot receive the state credit because they have no state income tax liability. Second, the state credit has an upper income limit of $100,000. As shown in the figure, many filers making over $100,000 benefit from the federal credit but not the state credit. About $29 million of the total $33 million cost of the credit in tax year 2013, or 90 percent, benefits filers making between $50,000 and $100,000 per year.
Figure 4
Usage of Federal and State Credits by California Taxpayers
Tax Year 2013
|
Income Range |
Federal Credit |
State Credit |
|||
|
Returns |
Amount (Millions) |
Returns |
Amount (Millions) |
||
|
$0 to $10,000 |
20 |
— |
— |
— |
|
|
$10,000 to $25,000 |
29,860 |
$10.3 |
— |
— |
|
|
$25,000 to $50,000 |
153,550 |
89.9 |
27,169 |
$3.1 |
|
|
$50,000 to $75,000 |
110,620 |
64.3 |
77,299 |
14.7 |
|
|
$75,000 to $100,000 |
90,450 |
53.7 |
73,659 |
14.6 |
|
|
$100,000 to $200,000a |
194,680 |
114.1 |
1,394 |
0.2 |
|
|
$200,000 to $500,000a |
78,060 |
41.9 |
68 |
— |
|
|
$500,000 to $1,000,000 |
9,110 |
5.0 |
— |
— |
|
|
Over $1,000,000 |
2,660 |
1.6 |
— |
— |
|
|
Totals |
669,010 |
$381.0 |
179,589 |
$32.7 |
|
|
a The credit’s income limits are based on federal adjusted gross income. The figure shown above groups filers by their California adjusted gross income. Because of differences in how these are calculated, some filers with California income over $100,000 will have federal income below $100,000 and thus are able to take the credit. |
|||||
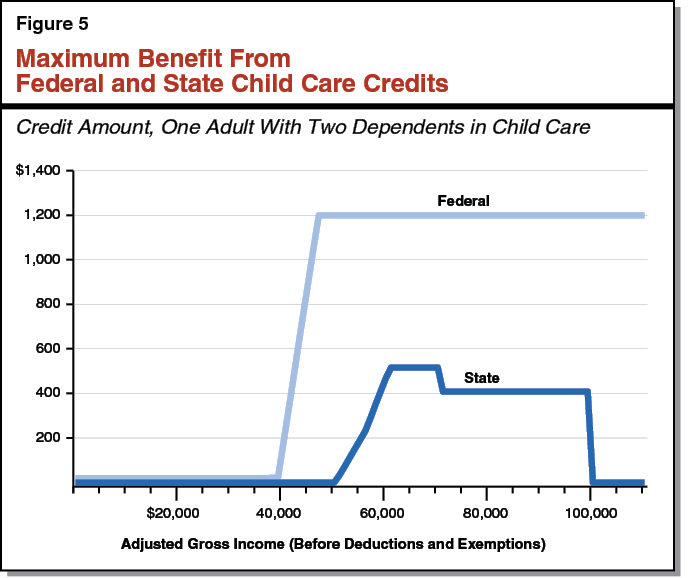
Illustration: Federal and State Credits by Income. Figure 5 shows how the maximum federal and state credit value varies by income level for one filer with two dependents in child care. (In creating this figure, we made various simplifying assumptions regarding this family’s tax situation.) We offer this illustration to help in understanding the options that we provide later in this report, as changing the state credit would change the credit value across different income ranges. As the figure shows, the federal credit has no benefits for families making less than $40,000, as they have no tax liability. The benefit of the federal credit ramps up quickly, reaching the maximum federal credit of $1,200 for families with income above about $45,000 per year. The state credit, by comparison, provides no benefit under $50,000. (As we described earlier, the federal credit benefits filers at a lower income threshold than the state credit because lower–income filers are more likely to have a federal tax liability than a state tax liability.) Filers earning between $50,000 and $60,000 per year begin to have a positive state tax liability and thus benefit from the state credit. Filers earning between $60,000 and $70,000 receive the maximum state credit of $516, or $258 per child. Between $70,000 and $100,000, the state credit is reduced to 34 percent of the federal credit, reducing the maximum state credit value to $400, or $200 per child. Filers earning $100,000 or more per year cannot claim the state credit.
State Credit Was Refundable Between 2000 and 2011. Figure 6 shows key historical changes in the federal and state credits. As described in the figure, the state credit was refundable from 2000 to 2010. As one of many actions to address the state’s large budget shortfalls following the 2008 financial crisis, the state made the credit nonrefundable in 2011. The cost of the credit declined from $135 million in 2010 to $39 million in 2011, producing an annual budget savings of roughly $100 million.
Figure 6
Key Historical Changes in Federal and State Credits
|
Federal Credit |
|
|
|
|
|
State Credit |
|
|
|
|
|
|
|
|
|
State Child Care Programs
Aside From Credit, State Spends Almost $3 Billion to Subsidize Child Care and Development Programs. The credit costs the state around $35 million per year. This amount is a very small portion of total state funding for child care. Outside of the credit, the state offers a variety of child care and development programs for low–income families, most of whom are working. With total funding of $2.7 billion in 2015–16 ($1.8 billion from the state and $906 million from the federal government), these programs subsidize over 350,000 children.
Eligibility and Fees. Families with income below 70 percent of the estimated state median income in 2007 are eligible for subsidized child care and development programs. For families with three people, the threshold is just over $42,000. The threshold is higher for larger families and smaller for a family of two. Families receiving child care and development subsidies may face some out–of–pocket costs. These costs can be less than $100 to a few hundred dollars per month.
Child Care and Development Programs Do Not Serve All Eligible Families. State funding is insufficient to provide a subsidy to all eligible families. Where programs fall short of demand, priority is given to children who come from the lowest–income families or who are at risk of abuse or neglect. Based on participation data, a large proportion of eligible children do not receive a subsidy. In contrast, the credit is generally available to anyone who has a positive tax liability and pays for some child care expenses.
Child Care Subsidies Worth Far More Than Maximum Child Care Credit. Child care subsidies and the child care tax credit benefit families of different incomes. As mentioned above, families of three with incomes below $42,000 are eligible for child care and development subsidies; however, families typically do not benefit from the state tax credit until their incomes exceed roughly $50,000. The benefits these two groups of families receive also are quite different. For example, the 2016–17 Governor’s Budget assumes a child care voucher is worth roughly $8,500 per child per year. By contrast, the maximum state credit is $258 per dependent for up to two dependents. Thus, a child care voucher is worth around 33 times as much as the maximum credit for one dependent.
Generally, No Overlap Between Credit and Voucher Program. Most households with income below the voucher eligibility threshold have no income tax liability. Therefore, the majority of families eligible for vouchers cannot benefit from the nonrefundable credit. As a result, there is little to no overlap between voucher recipients and credit recipients. In fact, many households with income under $50,000 do not benefit from either program because they have no tax liability and do not receive a child care subsidy (either due to income eligibility restrictions or lack of state funding).
Back to the TopPotential Modifications to the State Child Tax Credit
Possible Policy Goals
The goals of modifying the child care credit would presumably be similar to other programs that are targeted at working families: to encourage work and to relieve the burden of child care costs on lower– and middle–income families.
Encourage Work. Evidence suggests that child care subsidies encourage parents to work in the formal labor market. Families must weigh the potential gains from working in the labor market against the substantial costs of paying for child care that they would otherwise provide at home. Because subsidies reduce the costs of child care, labor market opportunities become more attractive. There is an argument that encouraging work is a legitimate policy goal in its own right. Work experience enables people to develop the skills, habits, and connections that can help them eventually move into higher–paying jobs, and this is especially valuable for the typically young parents of children under 13.
Relieve High Child Care Costs. As discussed earlier, child care is a significant cost for many families. Expanding the tax credit would relieve some of the cost of raising children.
Decision Points
The Supplemental Report of the 2015–16 Budget Package stated the Legislature’s intent to provide a refundable child care tax credit to low– and middle–income families. Thus, all of the options presented here make the credit refundable. In addition to making the credit refundable, the Legislature would face many other choices in modifying the credit. Below, we discuss these key choices, or decision points, and identify issues for legislative consideration.
Relationship to Federal Credit. As mentioned above, the state credit is simply a percentage of the federal credit. For example, as illustrated earlier by Figure 2, a filer with taxable income of $50,000 would be eligible for a federal credit of 20 percent of their eligible child care costs. This same filer would be eligible for a state credit equal to 43 percent of the federal credit, or 8.6 percent of their eligible child care costs. This straightforward relationship to the federal credit results in greater taxpayer compliance and ease of state administration of the credit. On the other hand, conforming to the federal structure foregoes the possibility of designing a state credit more specifically tailored to the Legislature’s own policy goals. In considering options for modifying the state credit, the Legislature will want to weigh the merits of federal conformity—primarily taxpayer compliance and administrative simplicity—against the merits of more tailored approaches.
Varying Benefits by Age or Provider Quality. The Legislature could deviate from the federal credit structure if it wants to target the benefits in a particular way. For example, the Legislature could consider the following options:
- Vary Credit by Cost of Care to Different Age Groups. Infants and preschool age children have higher annual costs of care than older children who are in school for much of the day. To better reflect this cost disparity, the size of the credit could decrease as the age of the child increases.
- Vary Credit by Quality of Services. Some studies suggest that children fare better when placed in programs that meet recognized developmental standards. The credit could be limited to programs that meet developmental standards. Alternatively, the Legislature could offer a larger credit to families participating in these programs.
While these approaches may have some merit, verifying benefits by age or provider quality would be administratively complex and costly relative to the simpler options provided later in this report, possibly increasing administrative costs by up to around 20 percent. We discuss some of these potential administrative challenges in the nearby box.
Administrative Challenges
Relatively Complex Approaches Increase Administrative Costs. Making the credit more complex—for example varying the credit based on the dependents’ ages and/or the providers’ compliance with developmental standards—would require the Franchise Tax Board (FTB) to set up entirely new administrative processes. For example, some options might require FTB to establish data sharing agreements with state and local agencies or child care providers. The FTB estimates its additional annual administrative costs under such approaches could be up to 20 percent higher than under the simpler options provided in this report.
Improper Claims a Potential Problem. Evidence suggests that refundable credits can create additional administrative issues, including improper claims by tax filers. To limit these issues, the credit could be limited to dependents with valid Social Security numbers or Individual Taxpayer Identification Numbers, and the state could develop a program to educate tax preparers about compliance with the revamped credit. The Legislature also could consider limiting the second earner’s income to wage income. (We highlight the second earner’s income because it is where filers claiming the child care credit may have the greatest incentive to falsify income.)
Overlap Between a Refundable Credit and Subsidized Child Care and Development Programs. Making the tax credit refundable would benefit many lower–income filers, including some who already receive child care and development subsidies. For example, some filers receiving vouchers may also have some out–of–pocket child care expenses and would thus benefit from a refundable state tax credit. Making the tax credit refundable also would benefit families who are eligible for subsidies but do not receive them, and families who are ineligible for subsidies. Families receiving vouchers already receive a large state subsidy whereas other similar families do not receive the tax credit or a subsidy. In targeting additional resources for an expanded credit, the Legislature could consider restricting the tax credit to filers who do not receive any subsidies, as this would increase the relative benefit to those families who do not receive subsidies. We note that restricting the credit in this way would increase administrative costs if strictly enforced.
Benefits for More Than Two Dependents. Due to federal conformity, the state credit is limited to two dependents. The state could choose to extend the limit to three or four, or to eliminate it entirely. Another option could be to reduce the amount of the credit on a per–child basis while at the same time eliminating the two–child limit to provide those with more than two children greater relative benefit. Like other options that depart from federal conformity, this option would complicate taxpayer compliance and pose administrative challenges.
Total Level of Funding. Like any spending augmentation or tax reduction, an expanded child credit would require additional budgetary resources. Within any credit modification budget, the Legislature faces trade–offs concerning the degree to which different income groups would benefit. For example, expanding the credit to the entire low–income range may come at the trade–off of a lower credit value across the board, which may reduce the work incentives provided by the credit. We advise the Legislature to choose its priorities for the credit and then scale the modifications within a target funding amount consistent with available budgetary resources.
Back to the TopOptions for Legislative Consideration
The decision points discussed above could lead to many different possible structures for a revamped state child care credit depending on the Legislature’s priorities and objectives. To facilitate the Legislature’s consideration of priorities, we provide several options that are tied to its goal of making child care more affordable for lower–income families. To illustrate the trade–offs of these different options, we estimate their costs and compare benefits at different income levels.
- Costs. The costs of an option include both the potential revenue loss to the state and administrative costs. (We describe cost estimating challenges in the nearby box.) Estimates of administrative costs were developed by the Franchise Tax Board (FTB). We note that in preparing these estimates, FTB has assumed that it would be required to perform robust fraud and error prevention, outreach, and education activities for each option. The amount of focus FTB assumes for these activities may differ from what would be included in a legislative package to modify the tax credit.
- Benefits. For each option, we show the change in the maximum possible benefit available to a single filer with two or more dependents in child care at different income levels. We only describe the effects on other types of households in the first option, but the effects on these other types of households would generally be proportionally similar under options 2 through 4.
Cost Estimating Challenges and Considerations
Minimum Wage Changes Will Affect Cost Estimates. In 2010, when California last had a refundable child care credit in effect, the state’s minimum wage was $8 per hour. It is now $10 an hour. This report was essentially completed prior to the recent approval of state minimum wage legislation. That legislation will further increase the minimum wage. These increases will affect the income distribution in future years and therefore will change the cost of credit modification options, particularly over the longer run.
Data Issues. We note that the most recent personal income tax data cover tax year 2013. To produce the estimates in this report, we start with 2013 data and project the 2016 income distribution. Estimates will vary somewhat as new data become available.
Other Challenges. To the extent that the options presented in this report impact employment, changes in incomes could increase or decrease the revenue losses presented in these options. Other economic effects are also possible. These effects, however, are difficult to quantify and thus are not captured in the revenue estimates in this report. We note that these revenue effects would likely be far smaller than the direct revenue loss resulting from a credit expansion. Similarly, because policies that subsidize child care are designed to increase the demand for child care, the options presented in this report could increase child care costs to some small degree due to increased demand for services.
Effects on Propositions 98 and 2. Proposition 98 establishes a minimum funding guarantee for schools and community colleges that is in part based on state revenue. When state revenue decreases, it is usually the case that required spending on schools decreases as well. While the precise effect will vary from year to year, the Proposition 98 minimum guarantee generally decreases by around 50 percent of the revenue loss. For example, we estimate that option 1 in this report would decrease state revenues by $110 million, which might decrease the Proposition 98 minimum guarantee by around $55 million. In addition, the options described in this report would decrease budget reserve deposits and debt payments required under Proposition 2 (2014) by between about $1 million and $3 million.
Features Common to All Options. The options presented in this report retain most of the features of the state credit as it exists in current law. The credit would continue to conform with the federal credit, including federal provisions limiting the number of eligible children to two and capping eligible child care expenses at up to $6,000. Each option also makes the credit refundable again. Because the options are all relatively administratively simple, FTB’s administrative costs likely would be similar for all options. Specifically, FTB estimates that administrative costs under all options would be $13.3 million in the first year with ongoing costs of $11.9 million annually. The key difference among the options described below is the value of the state credit offered to filers in different income ranges.
Option 1: Restore Refundability
Option Benefits Low– to Middle–Income Filers. Option 1 makes the credit refundable. It makes no changes in the credit percentages. Specifically, the credit percentages would remain 50 percent of the federal credit for filers with incomes between $0 and $40,000, 43 percent for incomes between $40,000 and $70,000, and 34 percent for incomes between $70,000 and $100,000. Figure 7 compares the credit value under this option to current law for one adult with two dependents in child care. As shown in the figure, option 1 generally would benefit lower–income filers. Specifically, option 1 would provide a substantial benefit of $1,050 to filers making $15,000 or less per year, a significant benefit of at least $516 to filers earning between $15,000 and $50,000 per year, and a relatively modest benefit to filers earning between $50,000 and $60,000 a year. We estimate the revenue loss under option 1 to be $110 million.
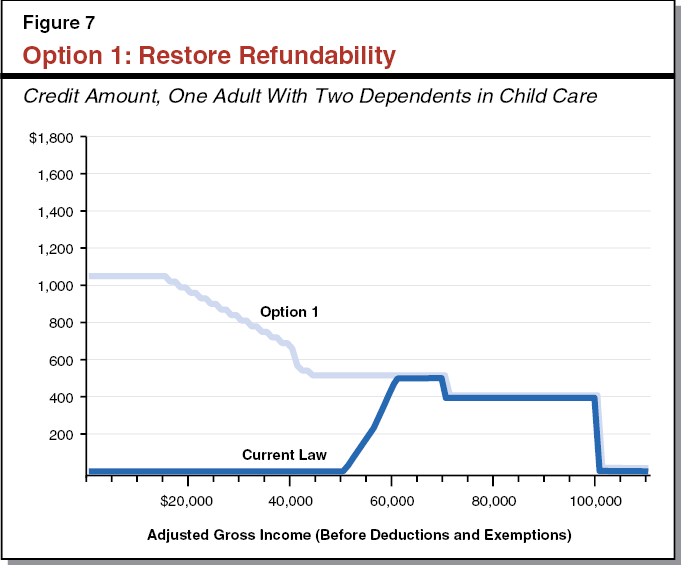
Effects on Other Types of Households. Joint filers with two dependents would receive a similar benefit but across a somewhat higher income range—reflecting their generally higher household incomes. For a single filer with one dependent, the proposed credit would be exactly half as large as those shown in Figure 7 at all income levels. These effects can be applied to options 2 through 4.
Option 2: Restore Refundability at a Somewhat Lower Cost
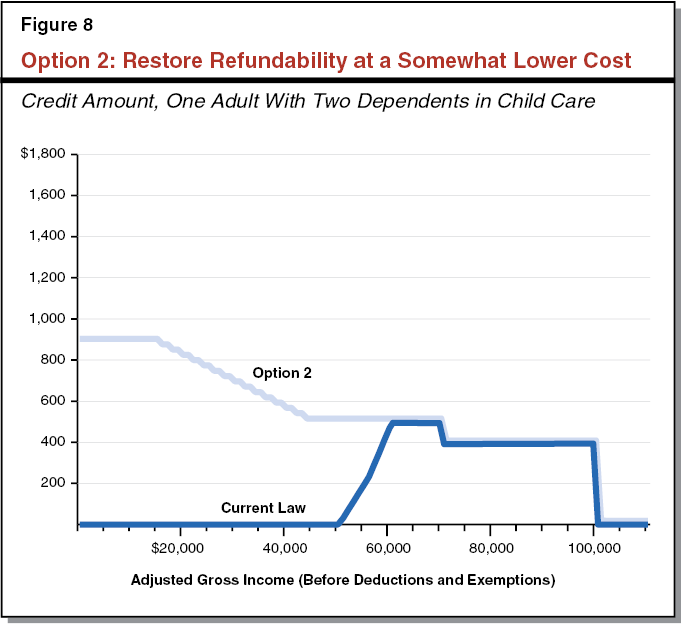
Option Provides Somewhat Less Benefit Than Option 1. If the Legislature were concerned about the cost of option 1, it could lessen the impact in other ways. For instance, our option 2 would provide filers with taxable income under $40,000 with a credit equal to 43 percent of the federal credit instead of 50 percent. (The 43 percent rate currently applies to incomes between $40,000 and $70,000.) This option would slightly reduce the benefits to those filers—making less than $40,000 compared to option 1. This option, however, would cost around 10 percent less than option 1. Specifically, we estimate the revenue loss associated with this option to be $98 million, or $12 million lower than option 1. Figure 8 compares the credit values under option 2 to current law for one adult with two dependents in child care.
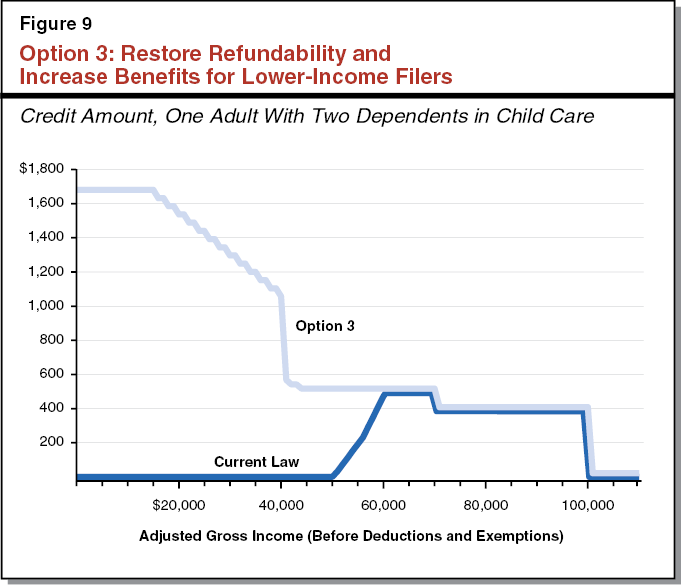
Option 3: Restore Refundability and Increase Benefits for Lower–Income Filers
Provides Even More Benefit to Low–Income Filers. If the Legislature wishes to focus more resources on increasing the credit value for low–income filers, it can increase the credit percentages for filers making less than $40,000 per year. Option 3 provides filers making less than $40,000 a credit equal to 80 percent of the federal credit rather than 50 percent under current law. Figure 9 compares the credit values under option 3 to current law for one adult with two dependents in child care. As shown in the figure, filers earning just under $40,000 per year would receive a substantial benefit of over $1,000. The credit value would increase with decreasing incomes, reaching a maximum of $1,680 for filers making under $15,000 per year. This last amount would likely provide a greater incentive for people to seek paid work, considering that the base annual pay of a full–year, half–time job at the current state minimum wage of $10 an hour is $10,000. We estimate the revenue loss associated with option 3 to be $157 million in 2016—$47 million greater than option 1 and $59 million greater than option 2.
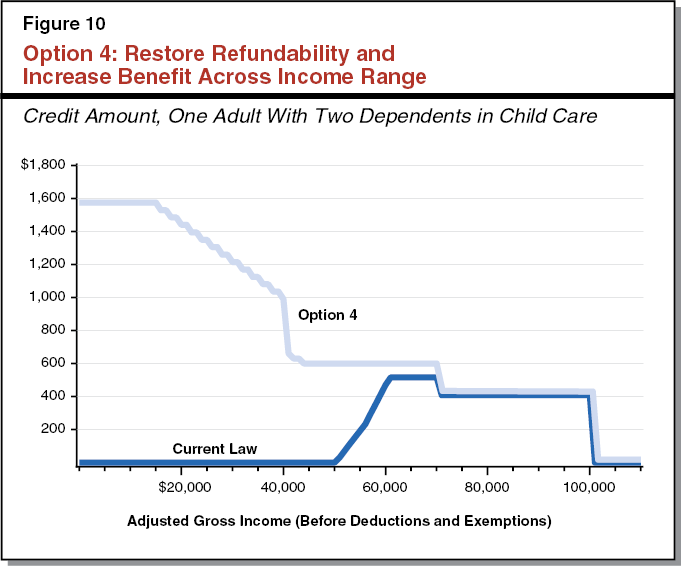
Option 4: Restore Refundability and Increase Benefits Across Income Range
Option Benefits All Filers, Particularly Low–Income Filers. Options 1 through 3 would focus additional resources on lower–income earners. If the Legislature also wants to increase benefits for higher–income earners, it can change the credit to achieve this objective. For example, option 4 would increase the state credit percentage from: 50 percent to 75 percent (under $40,000), 43 percent to 50 percent ($40,000 to $70,000), and 34 percent to 35 percent ($70,000 to $100,000). Compared to option 3, option 4 would provide filers earning less than $40,000 per year a somewhat smaller benefit while providing filers earning between $40,000 and $100,000 a somewhat larger benefit. Option 4 would carry the same cost as option 3—about $157 million—illustrating how the Legislature can tailor the credit percentages to reflect the benefit it wants to provide to filers across different income ranges. Like option 3, this option would provide a greater incentive for people to seek paid work, particularly for filers making less than $15,000 per year. Figure 10 compares the credit value under option 4 to current law for one adult with two dependents in child care.
Summary of Options
Figure 11 summarizes the four options presented in this report. The maximum benefit displayed in the figure applies to families making less than $15,000 per year. Consistent with the intent of the Legislature in requesting this report, all four of the options make the credit refundable again. In addition, these options retain the basic structure of the state credit. We took this approach to avoid possible administrative and compliance costs involved with changing the basic structure of the credit. More importantly, however, these options are relatively straightforward comparisons to current law.
Figure 11
Comparisons of Credit Expansion Options in This Report
|
Option 1 |
Option 2 |
Option 3 |
Option 4 |
|
|
State Percentage of Federal Credit for Filers Making: |
||||
|
$0 to $40,000 |
50% |
43% |
80% |
75% |
|
$40,000 to $70,000 |
43 |
43 |
43 |
50 |
|
$70,000 to $100,000 |
34 |
34 |
34 |
35 |
|
Maximum Benefit |
$1,050 |
$903 |
$1,680 |
$1,575 |
|
State Fiscal Impacts |
||||
|
Revenue loss |
$110 |
$98 |
$157 |
$157 |
|
Ongoing administrative costsa |
12 |
12 |
12 |
12 |
|
Total, Ongoing Impactsb |
$122 |
$110 |
$169 |
$169 |
|
aFranchise Tax Board estimates that administrative costs for all options would be $13.3 million in the first year and $11.9 million ongoing. bIn addition, does not reflect lower state costs under Proposition 98 minimum funding guarantee or lower reserve and debt payment requirements under Proposition 2. |
||||
Estimating the Costs of Other Options
The options provided above illustrate how different credit percentages would affect filers across the income range differently. These credit percentages, however, could equal any value the Legislature deems appropriate. Below, we detail the costs of making marginal changes in various aspects of the credit structure.
Altering the Federal Credit Fractions. As we discussed earlier in this report, changing the state fractions of the federal credit allows the Legislature to tailor the benefit to filers in different income ranges as well as the overall costs of modifying the credit. Figure 12 shows the estimated costs of increasing (or savings from decreasing) the state fractions of the federal credit by one percentage point. The estimates assume that the credit would be made refundable. For example, we estimate that increasing the fraction for filers making $40,000 to $70,000 5 percentage points (from 43 percent to 48 percent) would cost $5.4 million (5 percentage points multiplied by an estimated $1.08 million per point).
Figure 12
Change in Cost Resulting From Each
Percentage Point Change in Fraction
of the Federal Credit
|
Income Range |
Cost Change (In Millions) |
|
$0 to $40,000 |
$1.59 |
|
$40,000 to $70,000 |
1.08 |
|
$70,000 to $100,000 |
0.75 |
|
Note: Assumes child care tax credit is made refundable. |
|
Extending the Credit to More Dependents. The Legislature also could consider changing the number of dependents eligible for the credit. Figure 13 shows the percentage change in revenue loss from increasing the number of eligible dependents. For example, the estimated annual cost of option 1 (restoring refundability with no change in the state credit percentages) is $110 million. If the Legislature implements this option and eliminates the two–dependent limit, the estimated cost would increase by 13.6 percent, or about $15 million, for a total cost of $125 million. (The FTB estimates that this would result in additional administrative costs of around $2.5 million per year.)
Figure 13
Increase in Cost From Increasing
the Number of Eligible Dependents
|
Number of Dependents |
Percentage Increase in Cost |
|
3 |
10.4% |
|
4 |
12.8 |
|
No limit |
13.6 |
|
Note: Assumes child care tax credit is made refundable. Based on U.S. Census Bureau American Community Survey data. |
|
Other Considerations
Consider Outreach to Maximize Take–Up. While the state credit was refundable as recently as 2010, many filers who would be eligible for a refundable child care credit today did not have any dependents in child care in 2010. Moreover, some taxpayers who would benefit from a refundable credit may not be routinely filing tax returns due to having no tax liability. As such, if the Legislature makes the credit refundable again, it could consider efforts to promote participation and maximize the credit’s effects.
Consider Trade–Offs Between Voucher Slots and Credit. The state child care voucher program currently has an average annual cost of roughly $8,500 per child. If the Legislature were to apply $110 million (the revenue loss associated with option 1) instead to expanding the voucher program by creating more slots, it could create slots for roughly 13,000 more children. This would increase the number of children covered by the voucher program by over 5 percent, but this would represent less than 1 percent of the eligible population. In contrast, adopting option 1 would provide a much smaller benefit per household but would benefit many more households. The Legislature may wish to consider these trade–offs in weighing an expanded child care tax credit.
Conclusion
Many Trade–Offs to Consider in Modifying Child Care Credit. If the state child care credit were made refundable again it would provide a noticeable income boost to California working families and also encourage participation in the formal labor market to some extent. Because of the credit’s structure as a variable percentage of the federal credit, the state has any number of options for targeting the benefits to particular income groups without necessarily increasing administrative complexity. Other options could achieve other policy goals. For example, increasing or eliminating the two–dependent limit would make the program modestly more expensive but could benefit households with more than two dependents. Providing different credit amounts based on the age of the child or the quality of the provider may have policy merits but would come at the cost of significantly greater administrative complexity. The Legislature also would want to weigh the merits of limiting improper payments against the additional enforcement expense. These are all trade–offs the Legislature will want to consider in modifying the child care tax credit.