In This Report
LAO CONTACTS
K-12 Education in Context
Overview of the Governor's Budget
Local Control Funding Formula,
Special Education
Preschool Restructuring
Education Mandates,
Teacher Workforce Trends
County Offices of Education,
High Speed Network

February 18, 2016
The 2016-17 Budget
Proposition 98 Education Analysis
Executive Summary
Overall Proposition 98 Budget Plan
Governor’s Budget Increases Proposition 98 Funding Significantly. Proposition 98 funds preschool, K–12 education, the California Community Colleges (CCC), and adult education. The Governor’s budget includes $4.3 billion in Proposition 98 funding increases, with the largest augmentation ($2.8 billion) for implementation of the Local Control Funding Formula (LCFF) for school districts and charter schools. For community colleges, the largest proposals are $255 million for deferred maintenance and instructional equipment and $200 million for a new CCC workforce development program.
Governor’s Estimates of Proposition 98 Minimum Guarantee Reasonable. The Governor’s budget plan contains multiyear estimates of the Proposition 98 minimum guarantee. We believe these estimates are a reasonable starting point for budget deliberations. Changes in state General Fund revenue, however, will affect estimates of the guarantee over the period. Whereas revenue changes will have an almost dollar–for–dollar effect on the guarantee in 2014–15, the guarantee is relatively unaffected by revenue changes in 2015–16, and the 2016–17 guarantee likely will change about 50 cents for every $1 change in state General Fund revenue.
Governor’s Local Property Tax Estimates Likely Too Low. Though the administration’s estimates of the minimum guarantee appear reasonable to us, we think the administration’s estimate of local property tax revenue is around $1.1 billion too low across the 2015–16 and 2016–17 period. This is primarily due to differences in our estimates of redevelopment–related revenue and growth in assessed property values. Though higher local property tax revenue would not affect overall Proposition 98 funding, it would free up a corresponding amount of non–Proposition 98 General Fund.
Governor’s Budget Has Relatively Small Cushion. As in the past few years, a key budget decision this year concerns the amount of 2016–17 funding allocated to one–time versus ongoing purposes. The Governor allocates $520 million (about 1 percent of 2016–17 Proposition 98 spending) to one–time purposes. The Legislature could consider designating a larger amount for one–time purposes to provide a greater cushion in the event of a future economic slowdown.
Specific Proposition 98 Proposals
Recommend a Preschool Restructuring Approach That Links Funding to Children. The Governor proposes to redirect $1.6 billion in Proposition 98 funds from three existing preschool programs to create a new block grant intended to benefit low–income and at–risk four–year olds. The block grant would be given to local education agencies (LEAs) and potentially other entities based on historical funding allocations and local need. The administration would develop the remaining aspects of the program over the next few months. Though we think the Governor’s general approach of consolidating existing programs and prioritizing the neediest children is promising, we are concerned that basing funding on historical allocations would work counter to keeping funding linked to children. We recommend the Legislature create a single, coherent program that would serve all low–income and at–risk children, provide a uniform per–child funding rate, offer a full–day option for working families, and include developmentally appropriate activities.
Recommend Creating a Plan for Retiring the Mandate Backlog. The Governor proposes to allocate $1.4 billion towards paying down the K–14 mandate backlog ($1.3 billion to schools and $76 million to community colleges). While the per–student funding approach is consistent with prior years and initially had notable advantages, it can practically never retire the entire K–14 backlog. As an alternative, we recommend the Legislature create a $2.6 billion plan to retire the backlog over the next two or three years (depending on the availability of one–time funding). Participating school districts and county offices of education (COEs) would receive per–student funding based on the statewide median claim ($450 per student), with an additional allocation to COEs based on the number of students within the county ($20 per student) and a minimum COE payment of $1 million. As a condition of accepting funding, participating LEAs would write–off all outstanding claims through 2015–16.
Funding Inequities in Special Education Going Unaddressed. The administration has no specific proposal on special education equalization. Existing per–student special education funding rates, however, vary widely across the state, and these differences affect local contributions to special education as well as the amount of resources remaining for general education. We recommend equalizing special education funding rates over the next few years in tandem with LCFF implementation.
Services for Infants and Toddlers With Disabilities in Need of Comprehensive Reform. The Governor removes a $30 million ongoing augmentation that the state had provided last year for LEAs serving infants and toddlers with disabilities. He removes the funding because no agreement could be reached on how to use the funds. The state’s existing approach to serving these children is outdated and overly complex. We recommend the Legislature undertake a comprehensive review of this program with the intent of pursuing a major restructuring in future years.
Governor’s COE Cost Estimates Highlight Need to Address Larger LCFF Design Flaw. We believe that the administration underestimates LCFF costs for some COEs by a total of $20 million in 2015–16 and $35 million in 2016–17. The shortfall is related to how the state funds COEs under the “minimum state aid” provision of LCFF. We believe this provision is a fundamental design flaw of LCFF that works at cross–purposes to the formula’s intent by creating new and growing funding differences among COEs. We recommend the Legislature repeal the provision. Doing so would free up $40 million (Proposition 98) in 2016–17 and save tens of millions of dollars every year moving forward.
Recommend Rethinking Governor’s Proposal for Funding High Speed Network (HSN) Grantee. The Governor proposes providing the HSN grantee $19.3 million in 2016–17 expenditure authority. Of this amount, $8 million would come from Proposition 98 General Fund. We are concerned that the proposal would allow the HSN grantee to carry a reserve of $8.8 million without adequate justification and that the proposal does not include a plan for “right–sizing” the grant to meet present–day expectations. We recommend the Legislature provide no General Fund appropriation to the grantee in 2016–17, instead requiring the grantee to fund its 2016–17 operations using its reserves, leaving a $1.4 million reserve at year end. We also recommend the Legislature ask CDE to report about the performance and cost–effectiveness of the HSN grantee at spring budget hearings.
Introduction
Proposition 98 funds subsidized preschool, elementary and secondary education, and community colleges. In this report, we analyze the Governor’s Proposition 98 budget package. In the first section, we provide background on public schools in California. (We provide background on community colleges in our forthcoming Higher Education Budget Analysis.) In the second section, we provide background on Proposition 98 and the Proposition 98 minimum funding guarantee. We next describe and assess the Governor’s estimates of the minimum guarantee and his corresponding overall Proposition 98 spending package. In the remaining sections of the report, we describe and assess the Governor’s specific Proposition 98 proposals.
K–12 Education in Context
In this section, we answer many questions legislators and others commonly ask about K–12 education in California. We begin with a focus on the main components of California’s public school system, then turn to the state’s academic standards and student performance on standards–aligned assessments, and finish by explaining the basics of school finance in California.
California’s Public School System
Below, we describe California’s students, teachers, local education agencies, and state education agencies.
Students
California Has More Than 6 Million Public K–12 Students. In 2014–15, California’s public schools enrolled a total of 6.2 million students, representing 13 percent of all public school students in the nation. About two–thirds of these students were in grades kindergarten through eight, with one–third attending high school. Over the past decade, student enrollment has been virtually flat, with enrollment in 2014–15 about 1 percent below the 2004–05 level. Enrollment in the preceding decade, however, grew rapidly, with growth averaging 2 percent per year between 1994–95 and 2004–05. Over this earlier decade, statewide enrollment grew by nearly 1 million students.
Almost Six in Ten California Students Are From Low–Income Families. In 2014–15, 59 percent of California’s public school students were eligible to receive a free or reduced price school meal under a large federal nutrition program. States frequently use this eligibility measure as an indicator of student poverty. Qualifying students come from families earning no more than 185 percent of the federal poverty level. In 2014–15, this level equated to $45,000 for a family of four. California’s rate of free or reduced price meal eligibility is above the nationwide rate of 50 percent.
Half of California Students Are Hispanic. As shown in Figure 1, the ethnic make–up of California’s students differs notably from the nationwide picture. Whereas half of California’s students are of Hispanic origin and about one–quarter are white, in the United States those shares are flipped. Differences exist among other ethnic groups too, with Asian students comprising a larger share of students in California than the nation (12 percent and 5 percent, respectively), and black students comprising a smaller share (6 percent in California compared to 15 percent nationwide).

Nearly One–Quarter of California Students Are English Learners. In 2014–15, 22 percent (1.4 million) of California students were classified as English learners—a higher proportion than in any other state. One out of every three English learners in the nation attends school in California. Even more California students—almost 2.7 million students overall—speak a primary language other than English at home, but almost half of these students are considered fluent in English. California students come from families speaking over 60 different home languages, although the vast majority (78 percent) speak Spanish, with Vietnamese the next most common language (3 percent).
One in Ten California Students Are Identified as Having a Disability Affecting Their Education. In 2014–15, about 647,000, or roughly 10 percent of K–12 students in the state, were identified with a disability affecting their education. Pursuant to federal law, schools must provide these students with special education services. California identifies a slightly smaller proportion of students for special education than the rest of the nation (13 percent). Specific learning disabilities such as dyslexia are the most common diagnoses requiring special education services (affecting 4 percent of the state’s K–12 students), followed by speech and language impairments (affecting 2 percent of California’s students). While the overall prevalence of students with autism and chronic health problems still is relatively rare (each affecting about 1 percent of California’s students), the number of students diagnosed with these disabilities has increased notably over the last decade.
Teachers
California Has Almost 300,000 Teachers. In 2014–15, about 296,000 teachers were employed in the public school system. Roughly three–quarters of teachers are women, similar to the share in other states. Compared to the student population, teachers are more likely to be white (68 percent of teachers compared to 25 percent students) and less likely to be Hispanic (19 percent of teachers compared to 54 percent of students). The number of teachers decreased during the last economic recession, dropping from 310,000 in 2007–08 to 284,000 in 2011–12. Since 2011–12, the number of teachers has increased each year.
California’s Credentialing Requirements Are Similar to Those in Other States. To obtain a first–time teaching credential in California, individuals must have a bachelor’s degree, complete a teacher preparation program, meet certain basic skills requirements, and demonstrate subject matter competency. Within five years of receiving their initial credentials, teachers must complete approved, two–year, on–the–job training programs to obtain their full professional credentials. Most other states have similar requirements. Fully credentialed teachers from other states who want to work in California typically are granted in–state credentials conditionally, having to fulfill certain California–specific requirements (including a basic skills requirement and a requirement relating to teaching English learners) within a set amount of time.
Four in Ten Teachers in California Have Advanced Degrees. In 2014–15, less than 1 percent of California’s teachers held less than a bachelor’s degree, 57 percent possessed a bachelor’s degree, and 42 percent had a master’s degree or other advanced graduate degree. The share of teachers with a master’s or other advanced graduate degree has increased by almost 10 percentage points over the past ten years.
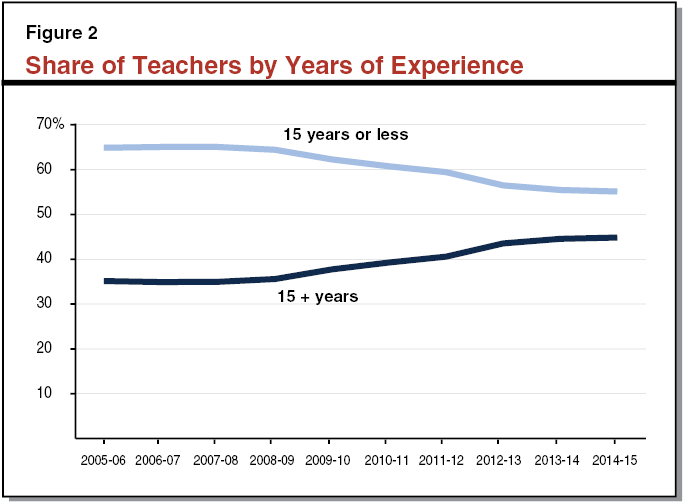
Average Years of Teaching Experience Have Steadily Increased Over Last Decade. In 2014–15, California’s teachers had an average of 14 years of experience. This is higher than ten years ago, when teachers had an average of 13 years of experience. As shown in Figure 2, the share of teachers in California with 15 or fewer years of experience has steady declined (from 65 percent in 2005–06 to 55 percent in 2014–15), whereas the share with more than 15 years of experience has steadily increased (from 35 percent in 2005–06 to 45 percent in 2014–15).
California’s Teacher Salaries Higher Than Most Other States. Based upon the most recent national data, California has the third highest average teacher salary. Its average teacher salary in 2013–14 was 26 percent higher than the national average. California consistently has ranked in the top four of states, having the highest average teacher salary of all states three of the last ten years.
Teacher Salaries Vary Significantly Across the State. In California, the state requires most LEAs to set teacher salary levels through collective bargaining. The average teacher salary in California in 2014–15 was $71,400, but teacher salary levels varied widely across the state. Orange County had the highest average salary at $81,000, whereas Siskiyou County had the lowest salary at $55,200. Average teacher salaries tend to be higher in urban counties, such as San Mateo ($74,500), Los Angeles ($72,400), and San Diego ($71,700), and lower in rural counties, such as Shasta ($60,900) and Sierra ($56,500).
California Has Among Highest Student–to–Teacher Ratio in Nation. Though California’s teachers tend to be better paid than the rest of the nation, the state employs comparatively fewer of them. Based upon the most recent national data, California had the highest student–to–teacher ratio. California’s average student–to–teacher ratio in 2012–13 was 23.7 to 1 compared to the national average of 16 to 1. The state’s student–to–teacher ratio consistently has been among the highest in the nation, even prior to the recent economic recession.
Local Education Agencies
School Districts, Charter Schools, and County Offices of Education Provide Instruction to Students. The public school system is comprised of many local education agencies (LEAs). In 2014–15, 947 school districts, 1,173 charter schools, and 58 county offices of education operated in California. California’s public school system also includes three state special schools for certain blind and deaf students as well as four Division of Juvenile Justice facilities for incarcerated students.
Size of California School Districts Varies Dramatically. As shown in Figure 3, California’s 947 school districts vary greatly in size. One–quarter of school districts are very small, serving 300 or fewer students. Another one–third are small, serving between 301 and 2,500 students. Whereas these two sets of districts combined comprise more than half of all districts in California, they account for only 7 percent of all students. At the other extreme, 13 very large districts each serve more than 40,000 students and together educate about one–fifth of all students in the state. The largest district in California (and the second largest in the nation) is the Los Angeles Unified School District, serving 9 percent of all California students. Seven of the state’s counties contain only a single school district, and 201 school districts contain only a single school. At the other extreme, Los Angeles County contains 80 school districts and the Los Angeles Unified School District contains almost 800 schools.
Figure 3
California School Districts Vary Greatly in Size
2014–15
|
District Size |
Number of Districts |
Percent of All Districts |
Total Students |
Percent of All Students |
|
6 to 300 |
238 |
25% |
28,970 |
1% |
|
301 to 2,500 |
308 |
33 |
335,323 |
6 |
|
2,501 to 5,000 |
136 |
14 |
490,730 |
9 |
|
5,001 to 10,000 |
116 |
12 |
863,800 |
16 |
|
10,001 to 40,000 |
136 |
14 |
2,593,579 |
47 |
|
40,000+ |
13 |
1 |
1,172,038 |
21 |
|
Totals |
947 |
100% |
5,484,441 |
100% |
|
Note: Based on average daily attendance. Excludes charter school attendance. |
||||
Charter Schools Are Fast–Growing Sector of California’s K–12 School System. An increasing share of California students attend charter schools. Charter schools are publicly funded schools that are similar to traditional schools in many ways—they must employ state–certified teachers, and they must teach and assess students based on the same state academic standards. They differ from traditional district–operated schools, however, in that they are exempt from certain laws, allowing them more flexibility over the design of their education programs. While overall K–12 enrollment has been relatively flat over the past decade, the number of students attending charter schools has more than tripled, growing at an average rate of 12 percent each year. In 2014–15, charter schools served 545,000 students (9 percent of the statewide total). Charter schools ranged in size from 7 students to more than 5,000 students, with an average school size of 444.
County Offices of Education (COEs) Operate Regional Programs and Services. Specifically, they operate alternative programs for students who are incarcerated, on or referred by probation, or have been mandatorily expelled by their district of residence. Many COEs also operate regional special education and career technical education programs. In addition, COEs offer a variety of regional services to support school districts. Most COEs, for example, operate countywide payroll systems and provide professional development for teachers and administrators. The COEs also are required to review and approve school districts’ annual budgets, monitor the fiscal health of districts twice per year, and review districts’ strategic plans, known as Local Control and Accountability Plans.
State Education Agencies
California Department of Education (CDE) Administers Education Programs at the State Level. The department is the primary state entity responsible for administering federal and state education programs. The department monitors compliance with laws and regulations for education programs; collects and compiles data related to districts, schools, and students; allocates funding; and monitors state contracts for student testing. The department has an annual budget of around $250 million and about 1,500 employees—rendering it midsized compared to other departments within California state government. More than two–thirds of CDE’s funding comes from federal funds, as most of CDE’s activities are associated with federal programs. The Superintendent of Public Instruction (SPI) oversees the day–to–day operations of CDE. In California, the SPI is a non–partisan position elected by voters. This contrasts with most other states in which the officers heading their departments of education typically are appointed by their governors or state boards of education.
Three Other State Agencies Involved in Aspects of K–12 Education. In addition to CDE, the following three state entities are involved in major aspects of K–12 education.
- The State Board of Education (SBE), consisting of ten members appointed by the Governor, is responsible for setting and implementing various state policies, including developing regulations needed to implement state laws involving K–12 education, granting LEAs waivers from certain requirements in state law, selecting a contractor for the state’s standardized tests, and adopting instructional materials for kindergarten through grade eight.
- The Commission on Teacher Credentialing is responsible for accrediting teacher preparation institutions to ensure those institutions have met minimum standards; credentialing teachers to ensure those individuals have met minimum training requirements; and monitoring teacher conduct to ensure teachers conduct themselves appropriately.
- The State Allocation Board allocates bond funding for the construction and modernization of public school facilities. Prior to receiving state bond funding, school facility projects must be reviewed and approved by the Office of Public School Construction, an office within the Department of General Services.
A Few Entities Tasked With State–Level Functions. In addition to these state entities, the state contracts with a few entities (via their COEs) to undertake activities that have statewide benefits. The Fiscal Crisis and Management Assistance Team (affiliated with the Kern COE) provides fiscal advice, management assistance, and other training to school districts across the state. California School Information Services (also affiliated with the Kern COE) helps LEAs across the state with data management issues. The K–12 High Speed Network (affiliated with the Imperial COE) assists schools with connectivity to Internet2 (a network reserved mostly for education institutions). The California Collaborative for Educational Excellence (affiliated with the Riverside COE), established by the state in 2013 and in the midst of development, will serve as a hub of expertise for helping LEAs improve student outcomes.
Policy and Performance
Below, we focus on major state and federal laws affecting K–12 education and then turn to student performance.
Law and Regulations
State and Federal Law Governs Large Portion of K–12 Education. Much of school operations are dictated by state and federal law. For example, the state sets caps on the size of elementary and middle school classrooms, requires a minimum of 180 instructional days per year, and sets minimum course requirements for high school graduation. State law also requires LEAs to implement state–adopted academic standards, administer state–approved student assessments, and report certain student performance outcomes. In addition to state law, federal law places, as a condition of receiving funding, several major requirements on schools. Most notably, the federal government requires schools to provide special education services and requires annual testing in certain subjects and grade levels. The federal government also funds various programs that have specific requirements associated with them. For example, if a school district accepts a federal Title I grant, then it must demonstrate that the funds are used for supplemental services for low–income students. (As highlighted in the nearby box, the federal government recently reauthorized the legislation governing much of its K–12 education requirements.)
President Signs Every Student Succeeds Act on December 10, 2015
The Every Student Succeeds Act (ESSA) is the main federal legislation affecting K–12 education. The act supersedes the No Child Left Behind (NCLB) Act, enacted in 2002 and up for reauthorization since 2007. As with NCLB, the ESSA sets specific requirements for states to test students in English language arts, math, and science; report testing data by specified student subgroups (including low–income students); and identify and intervene in their lowest–performing schools. The ESSA most notably differs from NCLB in that it provides states with flexibility to develop their own accountability systems and decide for themselves what actions they will take to improve low–performing schools and districts. By comparison, NCLB was much more prescriptive in dictating specific school turnaround strategies that states were to implement.
The SBE Is Responsible for Developing State Regulations. In many instances, state law delegates important policy decisions to the board. In 2014, for example, the board adopted regulations that specified how LEAs could spend certain revenues from the Local Control Funding Formula. The board also is in the midst of considering various issues relating to the state’s new accountability system, including whether to modify or replace the Academic Performance Index (a summary measure of academic performance), what to include in the evaluation rubrics COEs are to use to monitor school district performance, and how to integrate the state’s accountability system with recently adopted changes in federal law.
Academic Standards
The SBE Adopted California’s First Set of Academic Content Standards in the Late 1990s. As required in state law, these academic content standards were to specify what students should know after completing each subject area in each grade level. California first adopted academic content standards for its core content areas—English language arts, math, science, and history–social science—in 1997 and 1998. The state subsequently adopted standards for English language development (used for instructing English learners), visual and performing arts, physical education, career technical education, and world languages. The Instructional Quality Commission, an advisory body to SBE, created associated curriculum frameworks that provided examples of lesson plans aligned with the content standards.
Like Most States, California’s Instruction Now Based on Common Core State Standards. In 2010, at the direction of the state Legislature, the SBE adopted the Common Core State Standards (with the addition of a few California–specific standards) as the new foundation for what students should know and be able to do in English language arts and math from kindergarten through twelfth grade. The new standards are designed to be better at preparing students for college and career. California schools are implementing the new standards by modifying curriculum, conducting professional development for staff, and purchasing new instructional materials. Forty two states and the District of Columbia also have adopted and are implementing the Common Core State Standards.
State in Process of Implementing New Science Standards. California also adopted the nationally developed Next Generation Science Standards in 2013. (California was a lead state partner in the development of these new standards.) Because the state has yet to develop curriculum frameworks or new exams aligned with NGSS, instruction in the classroom is not yet aligned to the new science standards.
Student Assessments
Federal Law Requires States to Administer Standardized Tests. Federal law requires states to assess students in English language arts and math in grades 3 through 8 and at least once from grades 10 through 12. In addition, federal law requires states to assess students in science at least once during: (1) grades 3 through 5, (2) grades 6 through 9, and (3) grades 10 through 12. States also are required to annually assess the English proficiency of English learners. From 2003 through 2013, most students in California were assessed using the California Standards Tests (CSTs) in these subjects, which were aligned to the state’s first set of academic standards. (Students with moderate or severe disabilities were assessed using alternative assessments.)
First Exams Aligned to Common Core Administered in Spring 2015. Although the Common Core State Standards were adopted by SBE in 2010, schools were not expected to have their instruction aligned with the new standards until 2014–15, at which time the state was to administer a new set of Common Core–aligned assessments. The new assessments were developed by the Smarter Balanced Assessment Consortium (SBAC), a group of 18 member states, with California a lead member. The SBAC assessments are intended to be taken online using a computer or tablet (though schools have a pencil–and–paper option for the first three years). Compared to the state’s previous exams, which consisted almost exclusively of multiple choice questions, the SBAC assessments contain some open–ended responses. For example, both English language arts and math exams include performance tasks that require students to review source materials and respond in writing to several questions.
State in Process of Developing Several New Exams. Over the next several years, the state plans to develop additional assessments aligned with the Common Core State Standards. Specifically, the state plans to develop new assessments for students with disabilities and new assessments in languages other than English. In addition, the state plans to develop new exams in science and English language development to replace existing exams that are aligned to older standards. The state also will consider whether to add other assessments. By March 1, 2016, the SPI must submit recommendations to SBE regarding whether the state should add assessments in social science, visual and performing arts, technology, or any other subject matter. The SPI also may consider whether additional assessments should be developed to supplement existing exams in English language arts, math, and science.
Student Performance
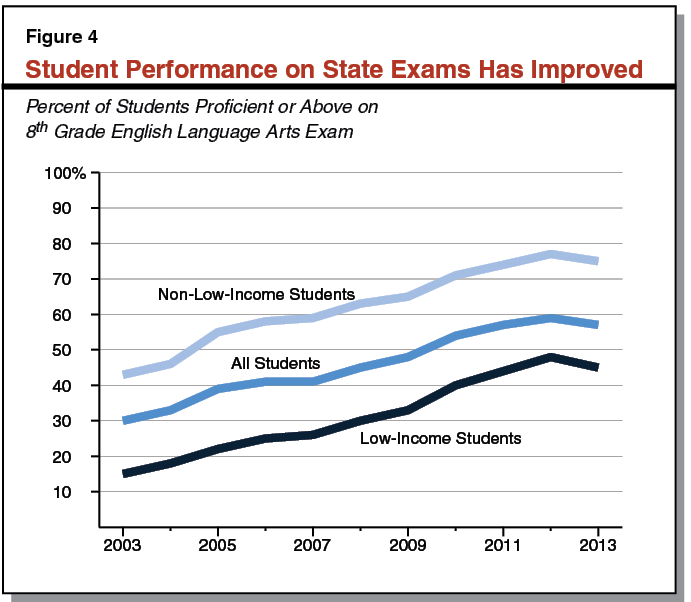
Student Performance on State Exams Improved From 2003 Through 2013. Student performance on the CSTs improved significantly during the ten years when the CSTs were administered. As Figure 4 shows, the percentage of students scoring advanced or proficient on the eighth grade English language arts exam almost doubled—from 30 percent to 57 percent—from 2003 to 2013. Performance improved at similar rates for both low–income and non–low–income students. Student performance also improved at similar rates in English language arts at other grade levels and on math exams. As part of the transition to new exams, California suspended the CSTs in spring 2014. Thus, no performance data is available for 2014.
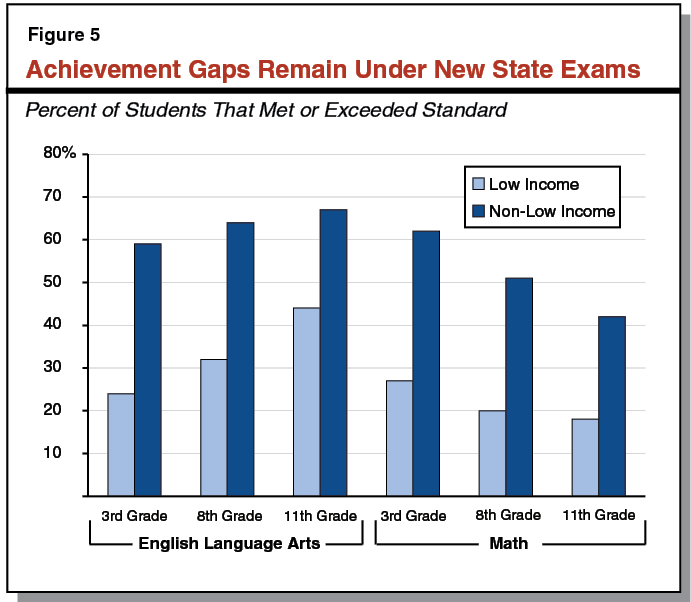
Large Achievement Gaps Remain Under New Assessments. The results of the new assessments in English language arts and math—the first year of results based on the new standards—were made public in September 2015. Statewide, 44 percent of California students met or exceeded standards in English language arts, whereas 33 percent met or exceeded standards in math. As Figure 5 shows, the results of the new exams show significant “achievement gaps”—the difference between the scores of low–income and non–low–income students. In eighth grade English language arts, for example, 64 percent of non–low–income students met or exceeded the state standards, compared to 32 percent of low–income students. These gaps are similar for other subjects and other grade levels and similar to achievement gaps under the prior exams (a difference of roughly 30 percentage points).
California Ranks Near Bottom on National Tests. Figure 6 shows California’s ranking on the National Assessment of Educational Progress, a federal assessment conducted nationwide. As the figure shows, California performs near the bottom in tests of reading and math for fourth and eighth grades. Although the performance of non–low–income students tends to rank somewhat higher than that of low–income students, both groups perform lower than their peers in other states. California’s performance compared to other states has not changed significantly in the past ten years. In addition to having lower performance compared to other states, California also has among the largest achievement gaps between low–income and non–low–income students. In fourth grade reading, for example, California’s achievement gap is ranked 49th in the country. (That is, 48 states have achievement gaps that are smaller than California.)
Figure 6
California Ranks Near Bottom on National Testsa
California’s Ranking Among 50 States and District of Columbia
|
All Students |
Low Income Students |
Non–Low Income Students |
Achievement Gapb |
|
|
4th grade |
||||
|
Reading |
49 |
49 |
40 |
49 |
|
Mathematics |
48 |
51 |
39 |
49 |
|
8th grade |
||||
|
Reading |
44 |
45 |
39 |
37 |
|
Mathematics |
41 |
45 |
34 |
38 |
|
aBased on performance on the 2015 National Assessment of Educational Progress. Ranking compared to 50 states and District of Columbia. bAchievement gap is difference between score of non–low–income and low–income students. The state that is ranked 1 has the smallest gap. |
||||
Eight in Ten Students Graduate High School Within Four Years. Of the cohort of students that entered ninth grade in the 2010–11 school year, 81 percent graduated within four years, 12 percent dropped out of school, 7 percent returned to school for a fifth year, and less than 1 percent received either a High School Equivalency Certificate (if they passed the General Educational Development Test) or a special education certificate of completion.
Increasing Share of Graduates Complete Coursework Required for University Eligibility. In 2014, 42 percent of California students graduated high school having completed the coursework required to be eligible for admission to the University of California and California State University. This proportion has been gradually increasing over the last 20 years. In 1994, 32 percent of California high school graduates completed such coursework. (To meet the minimum eligibility requirements for the University of California and California State University, students also must meet certain grade point average requirements and take college entrance exams.)
Finance
Below, we discuss how schools are funded in California and how funds are allocated and spent at the local level.
School Funding
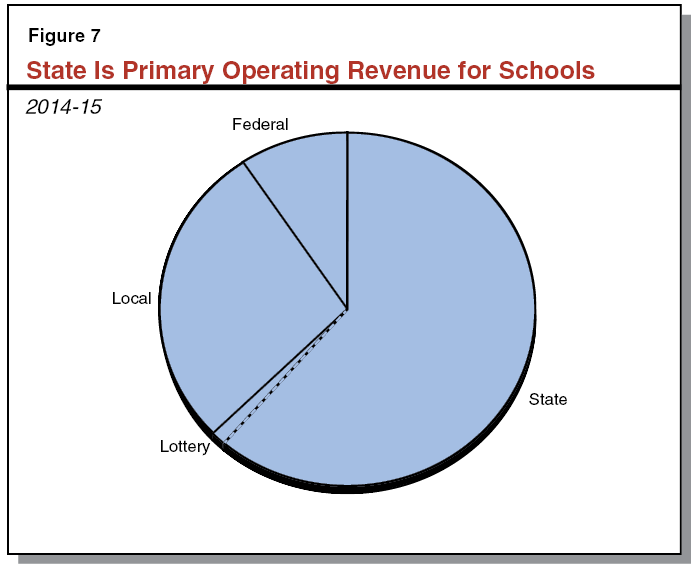
State Is Primary Source of Operating Revenue for Schools. In 2014–15, schools received $82 billion in total funding from all sources. As Figure 7 shows, the largest share of school funding comes from the state, with smaller shares coming from local sources (primarily from local property tax revenue) and the federal government. These proportions differ from many other states, where local property tax revenues cover a much larger share of school funding. (Unlike many other states, California’s State Constitution limits local property tax rates.) Additionally, in contrast to many other states, most school districts’ overall funding levels are not affected by how much local property tax revenue they receive. This is because California generally uses local property tax revenue as an offset for state General Fund spending. That is, if a district receives more local property tax revenue in a given year, the state reduces the district’s General Fund support by a like amount. About one in ten school districts in California, however, are affected by growth in their local property tax revenue, as they have such high levels of local revenue that the state provides no direct base aid.
Per–Pupil Funding in 2014–15 Exceeded Pre–Recession Level. For 2014–15, schools directly received $9,853 in state General Fund and local property tax revenue per student, about $200 (2 percent) above the 2007–08 pre–recession level adjusted for inflation. The 2015–16 Budget Act provided schools with $10,089 per student, a $200 (2 percent) increase from 2014–15.
California Per–Pupil Spending Ranks in Bottom One–Third of States. Based on data from 2012–13, California ranked 36th in per–pupil spending among the 50 states and District of Columbia. In 2007–08, prior to the most recent recession, California ranked 23rd in per–pupil spending. The drop in ranking over this period is primarily due to the reductions the state made during the recession. Because California’s revenues are highly sensitive to changes in the economy and financial markets, California’s budget tends to be more significantly affected by recessions (and recoveries) than most other states. Given California has made significant increases in K–12 funding over the past three years, its ranking likely will increase as newer data become available.
If Adjusted for Cost of Employment, California Drops in the Rankings. Some organizations produce rankings of state per–pupil spending with adjustments for regional costs. In these rankings, California typically ranks much lower. In one recent ranking, for example, California ranked 46th in per–pupil spending. The adjustments in these rankings are primarily intended to control for the variation in wages across the country, with average wages higher in California.
Allocation and Use of Funds
Most Funding Is Allocated Through the Local Control Funding Formula (LCFF). The 2015–16 budget plan allocated 90 percent of K–12 education funding (state General Fund and local property tax revenue combined) through LCFF. School districts and charter schools may use LCFF funds for any educational purpose, though they must use a portion of these funds for increasing or improving services for English learners and low–income students. In addition to general purpose LCFF funds, the state provides funding for various categorical programs, the largest being special education. (Categorical programs restrict funding for specified purposes.)
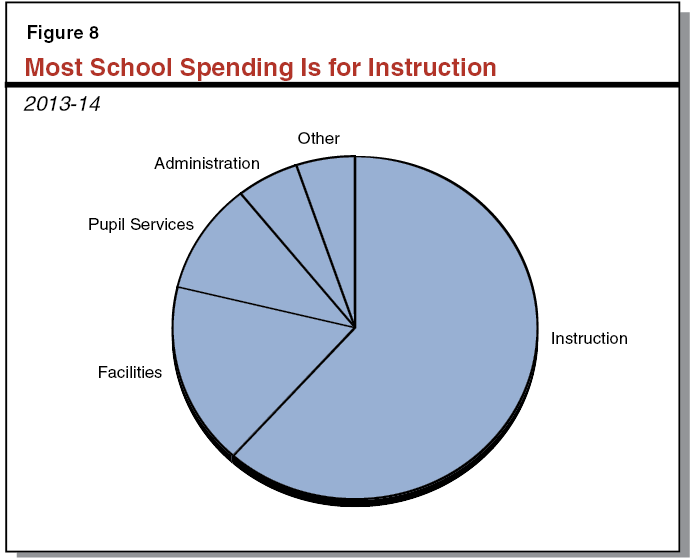
Most School Spending Is for Instruction. As Figure 8 shows, 62 percent of school expenditures in 2013–14 were related to instruction and instructional support—largely paying teacher salaries and benefits. Schools spent 17 percent of their funds on facilities, including land acquisition, construction, and maintenance. Schools spent 10 percent on pupil services, including school meals, pupil transportation, counseling, and health services. About 10 percent of funds were spent on central administration, including the compensation of superintendents; central business, legal, and human resource functions; and other expenses, including purchasing, printing, and data processing.
 Back to the Top
Overview of the Governor’s Budget
In this section, we describe how the state calculates its school funding obligation under Proposition 98; discuss changes in proposed funding and spending from 2014–15 through 2016–17; and examine some of the key issues facing the Legislature over the next few years.
Background on Calculating Minimum Guarantee
Proposition 98 Sets Minimum Funding Level for Schools and Community Colleges. State budgeting for schools and community colleges is governed largely by Proposition 98, passed by voters in 1988. The measure, modified by Proposition 111 in 1990, establishes a minimum funding requirement for schools and community colleges, commonly referred to as the minimum guarantee. Both state General Fund and local property tax revenue apply toward meeting the minimum guarantee.
Various Inputs Determine Operative “Test.” As described in Figure 9, the minimum guarantee is determined by one of three tests set forth in the State Constitution. These tests are based on several inputs, including changes in K–12 attendance, per capita personal income, and per capita General Fund revenue. The operative test that sets the minimum guarantee is triggered automatically depending on these inputs. In most years, Test 2 or Test 3 has been the operative test, with the minimum guarantee building upon the level of funding provided the prior year. Since the inputs are not finalized until a few years after the close of the fiscal year, the operative test can fluctuate and the minimum guarantee can change significantly from the level initially assumed in the budget.
Figure 9
Constitution Sets Forth Three Tests for Calculating Proposition 98 Minimum Guarantee
|
Test 1—Share of General Fund. Ensures Proposition 98 programs receive at least 40 percent of state General Fund revenue. This test applies only when it results in a higher funding level than Test 2 or Test 3. Test 1 has been operative 4 of the last 27 years. |
|
Test 2—Growth in Personal Income. Adjusts prior–year Proposition 98 funding for changes in K–12 attendance and per capita personal income. This test applies when higher than Test 1 but lower than Test 3. Test 2 has been operative 14 of the last 27 years. |
|
Test 3—Growth in General Fund Revenue. Adjusts prior–year Proposition 98 funding for changes in K–12 attendance and per capita General Fund revenue. This test applies when higher than Test 1 but lower than Test 2. Test 3 has been operative 7 of the last 27 years. |
|
Note: In 2 of the last 27 years, the state suspended Proposition 98. |
State Can Provide More Funding Than Required or Suspend Guarantee. During the economic boom that prevailed in the late 1990s, the state for several years provided more funding than was required by the minimum guarantee. Alternatively, in 2004–05 and 2010–11, the state applied a provision of Proposition 98 allowing for the suspension of the minimum guarantee upon a two–thirds vote of each house of the Legislature. When the state suspends the minimum guarantee, it can provide a lower level of funding but it creates an out–year obligation to restore K–14 funding in later years (as described below).
State Creates “Maintenance Factor” Obligation in Certain Years. Proposition 111 allows the state to provide less funding than the Test 2 level if Test 3 is operative or it suspends the minimum guarantee. In these years, the state creates a maintenance factor obligation, which is equal to the difference between the higher Test 2 level and the amount of funding actually provided. Moving forward, the maintenance factor obligation is adjusted annually for changes in K–12 attendance and per capita personal income. In subsequent years, when General Fund revenue is growing more quickly, the Constitution requires the state to make maintenance factor payments until this obligation has been paid off. The magnitude and timing of these payments is determined by formula, though stronger and faster revenue growth generally requires larger and more rapid payments. These maintenance factor payments increase the minimum guarantee on an ongoing basis.
Changes in Minimum Guarantee
As part of its budget package, the administration has updated its estimates of the minimum guarantee for 2014–15, 2015–16, and 2016–17. Below, we describe these changes.
2014–15 Minimum Guarantee Up $387 Million From Budget Act Estimates. As shown in Figure 10, the administration’s revised estimate of the 2014–15 minimum guarantee is $66.7 billion, an increase of $387 million compared with the budget plan adopted last June. This upward revision largely reflects a $441 million increase in the amount of local property tax revenue received by schools and community colleges. (Because Test 1 is operative in 2014–15, increases in property tax revenue result in a higher overall Proposition 98 funding level rather than offsetting General Fund costs.) The increase in property tax revenue is due to higher–than–expected ongoing savings from the dissolution of redevelopment agencies ($303 million) and changes to several other components of local property tax revenue ($138 million). The administration also adjusts its estimate of the guarantee to reflect changes in a few other factors, including a $93 million reduction in General Fund tax revenue and slightly lower–than–expected growth in state population. These adjustments result in a $54 million reduction to General Fund Proposition 98 funding.
Figure 10
Updating Estimates of 2014–15 and 2015–16 Minimum Guarantees
(Dollars in Millions)
|
2014–15 |
2015–16 |
||||||
|
June 2015 Estimate |
January 2016 Estimate |
Change |
June 2015 Estimate |
January 2016 Estimate |
Change |
||
|
Minimum Guarantee |
|||||||
|
General Fund |
$49,608 |
$49,554 |
–$54 |
$49,416 |
$49,992 |
$575 |
|
|
Local property tax |
16,695 |
17,136 |
441 |
18,993 |
19,183 |
191 |
|
|
Totals |
$66,303 |
$66,690 |
$387 |
$68,409 |
$69,175 |
$766 |
|
|
Operative Test |
1 |
1 |
— |
3 |
2 |
— |
|
|
Key Factors |
|||||||
|
General Fund tax revenue |
$112,068 |
$111,975 |
–$93 |
$116,619 |
$120,205 |
$3,585 |
|
|
Maintenance factor payment |
$5,402 |
$5,392 |
–$10 |
— |
$810 |
$810 |
|
|
K–12 average daily attendance |
5,994,522 |
5,981,073 |
–13,449 |
5,995,889 |
5,976,227 |
–19,662 |
|
2015–16 Minimum Guarantee Up $766 Million from Budget Act Estimates. Also shown in Figure 10, the administration’s revised estimate of the 2015–16 minimum guarantee is $69.2 billion, an increase of $766 million compared with the budget plan adopted last June. This increase is due primarily to a $3.6 billion increase in General Fund tax revenue. Whereas the June budget plan assumed the state would make no maintenance factor payment in 2015–16, this higher revenue requires a maintenance factor payment of $810 million. The administration also revises its estimates of a few other Proposition 98 factors. These adjustments yield a net $44 million reduction in the guarantee. The most notable of these other revisions is for K–12 attendance. Whereas the June budget plan assumed attendance would grow by 0.02 percent from 2014–15 to 2015–16, the administration now estimates that K–12 attendance has declined 0.08 percent over the period. (Under a two–year hold harmless provision in the State Constitution, the change in K–12 attendance is deemed to be zero rather than negative.)
Under Revised Estimates, State Pays Off All Maintenance Factor by End of 2015–16. Upon making the $810 million maintenance factor payment, the state will have paid off all maintenance factor created during the last recession, leaving no maintenance factor outstanding for the first time since 2005–06. Paying off this obligation has two main implications. First, any additional increases in 2015–16 revenue will not result in a further increase to the guarantee. This dynamic contrasts notably with the situation in 2012–13 and 2014–15, under which additional revenue increased the guarantee nearly dollar for dollar. Second, paying off the maintenance factor created prior to July 1, 2014 is one of the conditions the state must meet before making a deposit into the state school reserve, thus triggering the capping of local districts’ reserves. Though the state likely now will meet this condition, we do not anticipate the state will meet the remaining conditions for making a deposit and capping school district reserves (as described later).
2016–17 Guarantee Up $3.2 Billion Over 2015–16 Budget Act Level. As shown in Figure 11, the Governor’s budget includes $71.6 billion in total Proposition 98 funding in 2016–17. This funding level is $3.2 billion (4.6 percent) above the 2015–16 Budget Act level and $2.4 billion (3.5 percent) above the revised 2015–16 level. Relative to the 2015–16 Budget Act level, several factors explain the higher 2016–17 guarantee. First, the $766 million upward adjustment in the 2015–16 guarantee carries forward, increasing the 2016–17 guarantee by a like amount. Second, Test 3 is operative in 2016–17, with the guarantee adjusted for the growth in per capita General Fund revenue. The administration estimates this growth at 2.4 percent. In combination with a 0.5 percent increase that applies automatically when Test 3 is operative, this growth results in the guarantee increasing by about $2 billion. Third, the state is required to make a $475 million supplemental appropriation to ensure the minimum guarantee grows at least as quickly as the rest of the state budget. (The supplemental appropriation is due to a state law adopted in 1990 and is required only when Test 3 is operative.) These three increases are offset by a 0.08 percent decline in K–12 attendance, which reduces the guarantee by roughly $25 million. (The constitutional hold harmless provision does not apply in 2016–17 because attendance declined in the two preceding years.) Despite the increase associated with these factors, the 2016–17 guarantee remains below the Test 2 funding level. As a result, the state creates $548 million in new maintenance factor.
Figure 11
Proposition 98 Funding by Segment and Source
(Dollars in Millions)
|
2014–15 Revised |
2015–16 Revised |
2016–17 Proposed |
Change From 2015–16 |
||
|
Amount |
Percent |
||||
|
K–12 Educationa |
|||||
|
General Fund |
$44,496 |
$44,536 |
$45,442 |
$906 |
2.0% |
|
Local property tax |
14,834 |
16,560 |
17,802 |
1,242 |
7.5 |
|
Subtotals |
($59,330) |
($61,096) |
($63,244) |
($2,148) |
(3.5%) |
|
California Community Collegesb |
|||||
|
General Fund |
$4,979 |
$5,373 |
$5,447 |
$74 |
1.4% |
|
Local property tax |
2,302 |
2,624 |
2,812 |
188 |
7.2 |
|
Subtotals |
($7,281) |
($7,997) |
($8,259) |
($262) |
(3.3%) |
|
Other Agenciesc |
$80 |
$82 |
$83 |
— |
0.3% |
|
Totals |
$66,690 |
$69,175 |
$71,585 |
$2,410 |
3.5% |
|
General Fund |
$49,554 |
$49,992 |
$50,972 |
$980 |
2.0% |
|
Local property tax |
17,136 |
19,183 |
20,613 |
1,430 |
7.5% |
|
aIncludes State Preschool in 2014–15 and 2015–16 and proposed early education block grant in 2016–17. bIncludes $500 million for adult education regional consortia in 2015–16 and 2016–17. cConsists entirely of General Fund. |
|||||
60 Percent of Increase in 2016–17 Guarantee Covered by Higher Local Property Tax Revenue. Though the minimum guarantee grows by $2.4 billion from revised 2015–16 estimates to 2016–17, state General Fund spending grows by only $980 million (2 percent), whereas local property tax revenue increases by $1.4 billion (7.5 percent). As shown in Figure 12, this large increase in local revenue mainly results from two factors:
- Assessed Property Values Projected to Grow by 5.6 Percent. The largest source of local revenue for schools and community colleges is the 1 percent tax levied on the value of residential and commercial property. The administration projects that assessed property values will increase by 5.6 percent in 2016–17, similar to the average growth rate over the past 20 years. This increase equates to $929 million in additional property tax revenue.
- Final Shift of Revenue From End of “Triple Flip.” The triple flip began phasing out in 2015–16, with $1.3 billion in associated local property tax revenue flowing back to schools and community colleges. In 2016–17, schools and community colleges will receive an additional $419 million associated with the final quarter of this shift. (The triple flip was a complex financing mechanism under which the state diverted local sales tax revenue to pay off certain state bonds, backfilled cities and counties with property tax revenue, and backfilled schools and community colleges with state General Fund.)
Figure 12
Proposition 98 Property Tax Revenue Estimates
Reflects Governor’s Budget (Dollars in Millions)
|
2014–15 Revised |
2015–16 Revised |
2016–17 Estimated |
Change From 2015–16 |
||
|
Amount |
Percent |
||||
|
Local Property Tax Components |
|||||
|
Tax on assessed valuea |
$15,737 |
$16,616 |
$17,544 |
$929 |
5.6% |
|
End of “triple flip” |
— |
1,257 |
1,676 |
419 |
33.3 |
|
RDA ongoing revenue shift |
1,126 |
1,008 |
1,045 |
36 |
3.6 |
|
Other local revenueb |
1,069 |
998 |
1,039 |
41 |
4.1 |
|
Excess tax revenuec |
–796 |
–695 |
–690 |
5 |
–0.7 |
|
Totals |
$17,136 |
$19,183 |
$20,613 |
$1,430 |
7.5% |
|
aReflects school and community college allocations from the 1 percent property tax levied in each county. bLargely reflects the taxes levied on business property and property sold midyear. Also includes payments of delinquent taxes, one–time revenue associated with the sale of RDA assets, and several smaller taxes. cReflects revenue in “basic aid” districts and county offices of education that does not count toward the Proposition 98 minimum guarantee. RDA = Redevelopment Agency. |
|||||
Changes in Spending
Governor’s Budget Package Includes $4.3 Billion in New Proposition 98 Spending. The Governor’s budget includes a total of $4.3 billion in additional spending related to increases in the Proposition 98 minimum guarantee. From an accounting perspective, $387 million is attributable to 2014–15, $766 million is attributable to 2015–16, $3.2 billion is attributable to 2016–17, and $257 million is a settle up payment related to meeting the Proposition 98 minimum guarantee for 2009–10. In addition, the proposed budget repurposes $1.5 billion in Proposition 98 funding freed up from several expiring one–time 2015–16 initiatives. From a cash perspective, schools and community colleges will receive all of this funding in 2016–17. Below, we describe the Governor’s major Proposition 98 spending proposals.
Higher 2014–15 and 2015–16 Spending Largely Dedicated to Paying Down Mandate Backlog. The Governor proposes to dedicate $342 million of the available 2014–15 funding and $754 million of the available 2015–16 funding toward the K–14 mandate backlog. Of the combined $1.1 billion, schools would receive $1 billion and community colleges would receive $76 million. The Governor designates the remainder of available 2014–15 and 2015–16 funding for a few other purposes (including startup grants for new charter schools).
Largest Spending Proposals for 2016–17. Figure 13 summarizes the Governor’s Proposition 98 spending proposals for 2016–17. For schools, the Governor’s largest proposal is to provide $2.8 billion to continue implementation of LCFF. The next largest proposal is to provide $240 million for the Career Technical Education Incentive Grant for Secondary Schools. (The Governor also proposes $60 million in 2015–16 dollars for this purpose, bringing total program funding to $300 million.) Additionally, the Governor proposes a significant restructuring of the State Preschool and transitional kindergarten programs. For community colleges, the Governor’s largest proposal is to provide $255 million on a one–time basis for deferred maintenance and instructional equipment. The Governor also proposes $200 million to implement the recommendations of the Board of Governors (BOG) task force on workforce development and $115 million to increase community college enrollment by 2 percent.
Figure 13
2016–17 Proposition 98 Changes
(In Millions)
|
Revised 2015–16 Proposition 98 Spending |
$69,175 |
|
Technical Adjustments |
|
|
Remove prior–year one–time payments |
–$1,446 |
|
Make other adjustments |
–115 |
|
Adjust categorical programs for changes in attendance |
–16 |
|
Make LCFF adjustments |
101 |
|
Revise estimate of energy efficiency funds |
58 |
|
Annualize funding for previously approved preschool slot increases |
31 |
|
Subtotal |
(–$1,386) |
|
K–12 Education |
|
|
Increase LCFF Funding |
$2,825 |
|
Fund CTE Incentive Grant for Secondary Schools (year two of three) |
240a |
|
Provide 0.47 percent COLA for select categorical programs |
23 |
|
Fund truancy and dropout prevention program |
7 |
|
Fund High Speed Network |
5b |
|
Support Exploratorium |
4 |
|
Fund improvement of web–based tools for state accountability system |
1 |
|
Shift funding for transitional kindergarten and preschool into new block grant |
0 |
|
Remove prior–year augmentation for infants and toddlers with disabilities |
–30 |
|
Subtotal |
($3,073) |
|
California Community Colleges |
|
|
Fund deferred maintenance and instructional equipment (one time) |
$255 |
|
Implement workforce recommendations of BOG task force |
200 |
|
Fund 2 percent enrollment growth |
115 |
|
Make CTE Pathways Initiative ongoing |
48 |
|
Augment Basic Skills Initiative |
30 |
|
Provide 0.47 percent COLA for apportionments |
29 |
|
Fund Innovation Awards at community colleges (one time) |
25 |
|
Increase funding for Institutional Effectiveness Initiative |
10 |
|
Fund development of “zero–textbook–cost” degree programs |
5 |
|
Improve systemwide data security |
3 |
|
Increase apprenticeship reimbursement rate |
2 |
|
Provide 0.47 percent COLA for selected student support programs |
1 |
|
Subtotal |
($723) |
|
Total Changes |
$2,410 |
|
2016–17 Proposition 98 Spending |
$71,585 |
|
aBudget includes additional $60 million from other Proposition 98 funds. bBudget includes additional $3.5 million from other Proposition 98 funds. LCFF = Local Control Funding Formula, COLA = cost–of–living adjustment, CTE = Career Technical Education, and BOG = Board of Governors. |
|
Other Proposals for 2016–17. The Governor’s budget also includes several smaller proposals. As shown in Figure 13, the budget provides a 0.47 percent cost–of–living adjustment (COLA) for several K–12 programs (including special education and child nutrition) as well as community college apportionments. Due to the recent drop in fuel prices, this COLA is well below the historical average of about 3 percent per year. For schools, the budget also proposes to allocate $7 million for truancy and dropout prevention, consistent with the requirements of Proposition 47. The budget also allocates $5 million in ongoing funding for the K–12 High Speed Network (HSN). (In 2015–16, the state required this program to fund its operations by drawing down reserves.) For community colleges, the budget provides (1) $48 million to make the CTE Pathways program permanent, (2) $30 million to augment the Basic Skills Initiative, (3) $25 million (one time) to fund Innovation Awards, (4) $10 million to increase funding for the Institutional Effectiveness Initiative, and (5) $5 million to create pathways that allow students to earn degrees and certificates with no textbook costs.
Increases in Funding Per Student. Under the Governor’s budget, K–12 Proposition 98 funding per student increases from a revised 2015–16 level of $10,237 to $10,605 in 2016–17, an increase of $368 (3.6 percent). Community college Proposition 98 funding per full–time equivalent (FTE) student increases from a revised 2015–16 level of $6,878 to $7,003 in 2016–17, an increase of $125 (1.8 percent).
Issues to Consider
Changes to Revenue Estimates Affect the Minimum Guarantee Differently Across the Period. The Governor’s budget assumes that General Fund tax revenue will be $112 billion in 2014–15, $120.2 billion in 2015–16, and $124.2 billion in 2016–17. Although we believe these estimates are a reasonable starting point for budget deliberations, they rely upon many assumptions about the national and state economy. In May, the administration will revise these estimates based upon the latest available economic data. Compared with current estimates, higher revenue would tend to increase the minimum guarantee whereas lower revenue would tend to reduce the guarantee. The exact effect, however, varies notably depending on the year in which the revenue changes occur. Below, we describe sensitivity of the guarantee to revenue changes in 2014–15, 2015–16, and 2016–17.
- 2014–15 Guarantee Is Highly Sensitive. In 2014–15, Test 1 is the operative test for calculating the minimum guarantee and the state is making a large maintenance factor payment. Under these conditions, the guarantee changes virtually dollar for dollar with any change in revenue. Any increase in the guarantee, however, likely would not carry forward into 2015–16. This is due to a provision in the State Constitution known as “spike protection,” which effectively prevents large jumps in the guarantee from carrying forward into future years.
- 2015–16 Guarantee Is Relatively Insensitive. In 2015–16, Test 2 is operative and the state has paid off all maintenance factor. Relative to the administration’s estimates, state revenue could increase by as much as $7 billion with no increase in the guarantee. Conversely, state revenue could fall by as much as $1.3 billion with no decrease in the guarantee.
- 2016–17 Guarantee Is Moderately Sensitive. In 2016–17, Test 3 is operative and growth in the guarantee depends upon year–to–year growth in General Fund revenue. For every $1 dollar increase (decrease) in 2016–17 revenue, the guarantee would increase (decrease) by roughly 50 cents. Changes in 2015–16 revenue also could affect the 2016–17 guarantee. Counterintuitively, higher revenue in 2015–16 (all else constant) would reduce the guarantee in 2016–17 because it would lower the year–to–year growth rate. Lower revenue in 2015–16 would increase the guarantee in 2016–17 because it would raise the year–to–year growth rate.
Local Property Tax Estimates Likely Too Low in 2015–16 and 2016–17. We believe the administration’s estimate of local property tax revenue is $1.1 billion too low across the two–year period—$520 million too low in 2015–16 and $620 million too low in 2016–17. As described below, most of our differences with the administration are concentrated in two areas. (Our estimates for a few of the smaller components of property tax revenue also are slightly higher than what the administration projects.)
- Redevelopment–Related Ongoing Revenue. The administration estimates that the ongoing revenue shifted to schools and community colleges from former redevelopment agencies will be about $1 billion per year in 2015–16 and 2016–17. Based on increases in the tax increment allocated to the former redevelopment agencies and the repayment of redevelopment–related debt, we think revenue is likely to exceed the administration’s estimates by $330 million in 2015–16 and $364 million in 2016–17. (We believe the administration’s current forecast methodology systematically understates redevelopment–related revenue.)
- Assessed Property Values. The administration estimates that assessed property values will grow by 5.6 percent per year in 2015–16 and 2016–17. By contrast, we estimate growth of 6 percent in 2015–16 (based on the latest data submitted by county assessors) and 6.3 percent in 2016–17 (based on continuing growth in housing prices). Accounting for the higher growth rates, we think the associated tax revenue will exceed the administration’s estimates by about $100 million in 2015–16 and $200 million in 2016–17.
If local property tax revenue comes in higher than the administration estimates, Proposition 98 General Fund costs will be correspondingly lower and available non–Proposition 98 General Fund will be higher.
Recent Data Suggest Per Capita Personal Income Will Grow More Quickly Than Administration Projects. Federal data released in December 2015 suggest that per capita personal income will grow more quickly than the administration assumes in 2016–17. Whereas the administration assumes a growth rate of 4.4 percent, we believe growth could be around 1 percentage point higher based on this new information. Though the higher growth is unlikely to change the operative test or the minimum guarantee in 2016–17, it does mean the state likely will create more maintenance factor than the administration assumes. With a 5.4 percent growth rate, for example, the state would create a new maintenance factor obligation of about $1.3 billion, compared with the $548 million obligation assumed by the administration. This additional maintenance factor obligation would tend to increase school funding in future years.
Devoting Some 2016–17 Funding for One–Time Purposes Provides Cushion if Revenue Declines in Future Years. Though a recession does not seem imminent, the minimum guarantee could decrease in 2017–18 or future years if stock market prices were to drop or growth in the economy and personal income were to decline. Even a modest slowdown could reduce the 2017–18 minimum guarantee below the Governor’s proposed 2016–17 spending level. Such a scenario serves as a caution against the state committing all available Proposition 98 funding for ongoing purposes. The Governor’s budget dedicates $520 million of the funding within the 2016–17 minimum guarantee for one–time activities. This effectively reflects a cushion of less than 1 percent (0.7 percent). If the guarantee were to decline by more than this amount in 2017–18, the Legislature might have to reverse its progress toward LCFF implementation or make reductions to other ongoing programs. The Legislature could consider dedicating a larger share of 2016–17 funding for one–time activities to minimize the likelihood of such future reductions.
Proposals to Extend Proposition 30 Income Taxes Would Increase Minimum Guarantee. Proposition 30, approved by the voters in November 2012, temporarily increased personal income taxes for very high–income Californians. Though these taxes are scheduled to expire at the end of December 2018, a proposal is being circulated to extend them. We estimate that an extension would raise between $5 billion and $11 billion annually in the initial years of implementation, with the increase in 2018–19 around half of this amount, as half of the associated revenue raised in 2019 would be accrued to 2018–19. The large range in the estimate is due to the income volatility of high–income Californians. These individuals receive a large portion of their incomes from investments in the stock market and other sources that can vary notably from year to year. The additional revenue would increase the minimum guarantee, with the exact effect depending upon which Proposition 98 test were operative and how much maintenance factor were outstanding in 2018–19 and 2019–20. Under most of the economic scenarios we examined, the increase in the guarantee was roughly 50 cents for each dollar of revenue, though the exact effect ranged from as low as 20 cents to as high as 60 cents. For planning purposes, we think the Legislature could assume schools and community colleges would receive roughly half of any revenue increase associated with an income tax extension. For example, if the measure raised $4 billion in 2018–19 and an additional $4 billion in 2019–20 ($8 billion on an annual basis), the state might plan for the guarantee to increase by $2 billion in 2018–19 and an additional $2 billion in 2019–20 ($4 billion on an annual basis).
Deposits in State School Reserve Remain Unlikely in Near Term. A state law approved in 2014 imposes a cap on school district reserves in the year after the state makes a deposit into the state school reserve. Deposits are predicated on several conditions. Though we anticipate one condition will be satisfied in 2015–16 (having paid off all maintenance factor created before 2014–15), we do not anticipate the state will meet the other conditions within the next few years. For example, a deposit requires the minimum guarantee to be growing more quickly than per capita personal income. Under the projections released by our office in November and by the administration in January, this condition will not be met in 2016–17 or any of the following three years. To meet all of the conditions for a deposit, the state very likely would need to experience a year–to–year revenue surge of at least several billion dollars relative to these projections. Though an extension of the Proposition 30 income taxes would tend to increase state revenue, our projections indicate that this increase alone would not be large enough to meet all of the conditions for a deposit into the state school reserve in 2018–19 or 2019–20. Absent a larger surge, a deposit would not occur and the local reserve cap would not be triggered.
Recent Growth in School Funding Has Far Exceeded Initial Growth in Districts’ Retirement Contributions. School and community college districts are affected by both CalSTRS and CalPERS employer contribution rates. (CalSTRS administers the pension system for teachers and other certificated employees, whereas CalPERS administers the pension system for classified employees.) The 2014–15 budget package included a plan to fully fund the CalSTRS pension system over the next roughly 30 years. In the first few years of implementation, districts’ CalSTRS contribution rates increased from 8.25 percent of payroll in 2013–14 (before the start of the rate increases), to 8.88 percent in 2014–15, and to 10.73 percent in 2015–16. In addition to CalSTRS rate increases, the CalPERS board recently began increasing CalPERS contribution rates to move that system closer to full funding. Over this initial period of rate increases, district costs for these two pension systems have grown by more than $800 million (about 80 percent of which is related to CalSTRS increases). Over the same period, the Proposition 98 minimum guarantee has increased by more than $10 billion.
Retirement Contributions Scheduled to Continue Rising While Growth in School Funding Projected to Slow. District retirement contributions are scheduled to continue increasing each year for the next five years. Under the statutorily established schedule, districts’ CalSTRS contribution rates are to reach 19.1 percent of payroll in 2020–21. CalPERS contribution rates, though not fixed in statute, also are expected to increase over this period. Compared to 2013–14 levels, districts’ CalSTRS and CalPERS costs are anticipated to be roughly $5 billion higher annually by 2020–21 due to the scheduled rate increases (with about three–quarters due to CalSTRS rate increases). Under various multi–year economic simulations, we found districts’ retirement cost increases accounted for between roughly one–quarter and half of the projected increases in school funding over the period.
Pension Rate Increases, Coupled With LCFF Implementation, Pose Certain Challenges for Certain Types of Districts. As the state implements LCFF, some districts, typically those with historically low per–pupil funding rates and/or high levels of poverty, are receiving larger annual funding increases than other districts. On the one hand, these districts may face somewhat less challenge in accommodating the pension rate increases. On the other hand, the state is requiring these districts to increase or improve their services for EL/LI students. These districts likely are experiencing tension in deciding how best to balance these two priorities (covering the pension rate increases and improving EL/LI services), along with all other priorities. Despite this tension, these districts still likely face somewhat less difficult choices than those districts with historically high per–pupil rates and/or low levels of poverty that are experiencing pension rate increases at the same time their annual allocations are growing slowly.
Back to the TopLocal Control Funding Formula
The largest proposal in the Governor’s budget is a $2.8 billion augmentation for implementation of LCFF. Below, we discuss the enactment of LCFF and the main components of the formula. We then describe and assess the Governor’s proposal.
Background
State Enacts New School Funding Formula in 2013–14. Legislation enacted as part of the 2013–14 budget package made major changes to the way the state allocates funding to school districts and charter schools. Previously, the state distributed school funding through revenue limits (general purpose grants) and more than 40 state categorical programs. Categorical programs had long constrained districts by requiring them to spend fixed amounts on prescribed activities. The state replaced the historical revenue limit and categorical funding system with a new system designed to be more flexible, student–oriented, and cost–driven.
New Formula Based on Student and District Characteristics. The LCFF has three primary components: base funding rates tied to four grade spans; supplemental funding for English learner, low–income, and foster youth (EL/LI) students; and concentration funding for districts with relatively high proportions of EL/LI students (more than 55 percent of their enrollment). As displayed in Figure 14, the base rates generally increase for higher grades in recognition of their higher costs—for example, providing career technical education in high school. (The K–3 rate is an exception to this rule. It is higher than the rates for grades 4–8, as it is intended to support smaller class sizes in the early grades.)
Figure 14
LCFF Target Funding Rates
Target Rates as Calculated in 2015–16a
|
Grade Spans |
Base Rates |
Supplemental Fundingb |
Concentration Fundingc |
|
K–3 |
$7,820 |
$1,564 |
$3,910 |
|
4–6 |
7,189 |
1,438 |
3,595 |
|
7–8 |
7,403 |
1,481 |
3,702 |
|
9–12 |
8,800 |
1,760 |
4,400 |
|
aDoes not reflect actual funding levels. State funded 90 percent of the target rates in 2015–16. bEquals 20 percent of the base rate. Generated for each district student who is a foster youth, an English learner, or low income (EL/LI). cEquals 50 percent of the base rate. When EL/LI students comprise more than 55 percent of total district enrollment, generated for each EL/LI student above that threshold. LCFF = Local Control Funding Formula. |
|||
An Illustration of Two Districts’ LCFF Calculations. Figure 15 shows the LCFF target calculation for two equally sized elementary school districts. Both districts generate the same amount of base funding given they serve the same number of students in the K–3 and 4–6 grade spans. Though they have the same attendance by grade span, District A has a notably higher share of EL/LI students compared to District B. As a result, District A generates more supplemental funding than the other district. Unlike District B, District A also generates concentration funding given its share of EL/LI students exceeds the 55 percent threshold. Given the difference in student demographics, District A receives a total of $430,000 more than the other district.
Figure 15
Illustration of LCFF Calculation for Two Elementary School Districtsa
|
District A |
District B |
Difference |
|
|
Attendance |
|||
|
K–3 |
100 students |
100 students |
— |
|
4–6 |
120 students |
120 students |
— |
|
EL/LI percentageb |
91% |
50% |
41% |
|
Grade span funding |
$1,645,000 |
$1,645,000 |
— |
|
Supplemental funding |
299,000 |
165,000 |
$134,000 |
|
Concentration funding |
296,000 |
— |
296,000 |
|
Totals |
$2,240,000 |
$1,810,000 |
$430,000 |
|
aReflects target rates as calculated in 2015–16. Rounded to nearest thousand. bEL/LI students as a share of total enrollment. LCFF=Local Control Funding Formula and EL/LI=English Learner/low–income. |
|||
Implementation Expected to Take a Number of Years. When it enacted the new formula, the state set target per–pupil rates that were much higher than under the former system. Over the course of implementation, districts and charter schools will receive new funding based on the difference (or gap) between their prior–year funding level and their target LCFF funding level. Based on projections of growth in Proposition 98 funding, the administration estimated that the state would reach full implementation in 2020–21. Over the past three years, the state has provided $12.8 billion towards implementing the formula. As shown in Figure 16, the LCFF target level was 72 percent funded in 2013–14 and is 90 percent funded in 2015–16.
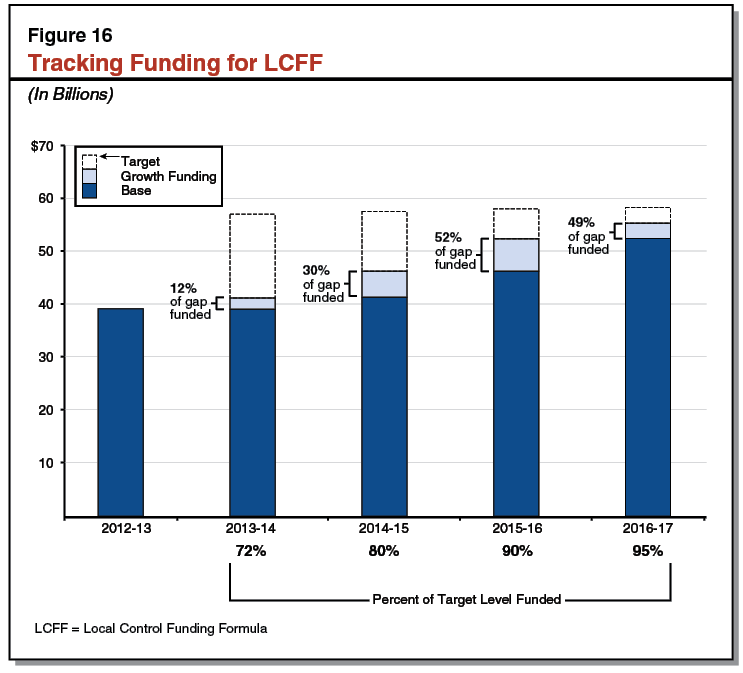
Considerable Funding Provided on Behalf of EL/LI Students. One frequently asked question regarding LCFF is how much funding the state is providing on behalf of EL/LI students. If LCFF had been fully implemented in 2015–16, the state would have provided districts with $36 billion (out of a total of $58 billion in LCFF funding) on behalf of EL/LI students. In 2015–16, the state is providing funding sufficient to cover only 90 percent of full implementation costs. If one assumes all components of the formula are being phased in at the same rate (that is, base, supplemental, and concentration funding all are 90 percent funded on a statewide basis), then districts in 2015–16 received $32 billion (out of a total $53 billion in LCFF funding) for EL/LI students. Of the $32 billion, $24.5 billion is base funding, $4.5 billion is supplemental funding, and $3 billion is concentration funding.
Districts Have Discretion Over Use of Funds. Districts can use most LCFF funds at their discretion. For supplemental and concentration funding, however, statute requires districts to demonstrate that they are “increasing or improving” services for EL/LI students in proportion to the increase in funding generated by the students. As required by statute, SBE developed a formula to link the proportional increase in funding with increase in services, but districts have no explicit requirement to spend a certain amount on EL/LI services.
Governor’s Proposal
Provides $2.8 Billion LCFF Increase. Consistent with the prior three years, the Governor’s largest proposed programmatic augmentation in 2016–17 is for the LCFF for school districts and charter schools. The Governor’s budget provides a $2.8 billion (6 percent) increase from 2015–16—bringing total LCFF funding to $55 billion (excluding Transitional Kindergarten). The Governor estimates the additional funding would close 49 percent of the remaining gap to target funding levels. We estimate the proposed 2016–17 LCFF funding level would be approximately 95 percent of the statewide full implementation cost.
Assessment
Prioritizing LCFF Implementation Consistent With State’s Prior–Year Actions. The Governor’s plan to dedicate most additional ongoing K–12 funding to LCFF implementation is consistent with the Legislature’s approach over the past three years. By continuing to prioritize LCFF implementation in 2016–17, both the Governor and the Legislature would be fostering greater local control and flexibility while simultaneously making progress toward providing additional funding for disadvantaged students.
In Future Years, State Should Evaluate Whether LCFF Has Helped Close Achievement Gaps. Given the LCFF was a recognition the state wanted to do more to help improve outcomes for EL/LI students, the state likely will want to examine EL/LI performance data to assess what effect the reforms have had on EL/LI outcomes. Given the relatively short time frame districts have had to make changes to their programs (LCFF has only been in effect for two and a half years) and the recent changes in the state’s testing system that make test scores difficult to compare to previous years’ scores, it is too early to draw conclusions regarding the effect of LCFF. Over the next several years, additional outcome data will become available, allowing the state to assess both the overall effectiveness of LCFF and the performance of individual districts. Down the road, were the state to find no overall improvement in EL/LI outcomes, it might consider rethinking or refining its funding and accountability approach. Were the state to find some districts’ EL/LI students performing much better than other districts’ EL/LI students (even under a system that provides all districts the same amount of funding for these students), it could examine differences in district services to determine if some instructional approaches and practices were more effective at helping EL/LI students.
Back to the TopPreschool Restructuring
In this section, we provide background on California’s major preschool programs; describe the Governor’s proposal for preschool restructuring; provide an assessment of the Governor’s proposal; and offer a framework for developing a single, coherent preschool program.
Background
California Has Several Major Preschool Programs. Figure 17 highlights key features of California’s four largest preschool programs: center–based voucher programs, the California State Preschool Program (CSPP), Transitional Kindergarten (TK), and federal Head Start. As shown in the figure, the programs are similar in some ways and different in other ways. For example, three of the four programs determine eligibility based on family income whereas one determines eligibility by a child’s birthday. Two of the programs require low–income families to be working to receive full–day preschool whereas the other two programs do not have a work requirement. The programs operate out of school districts, subsidized preschool centers, or both places. The state funds each of the three state programs using a different funding method (family vouchers, direct state contracts, and school district LCFF payments). Though not shown in the figure, in 2014–15 the state also began providing $50 million annually for Quality Rating and Improvement Systems (QRIS) designed to promote improvement among some CSPP providers in some areas of the state. In addition to the programs already mentioned, some preschool in California is funded with federal Title I funds, local First 5 revenue, and special education funding. Some children may benefit from multiple preschool programs. For example, some children are enrolled in both CSPP and Head Start.
Figure 17
Major Preschool Programs in California
|
Center–Based Voucher Programsa |
California State Preschoolb |
Transitional Kindergartenc |
Head Startd |
|
|
Eligibility |
||||
|
Family income eligibility cap |
70 percent of state median income |
70 percent of state median income |
None |
100 percent of federal poverty level |
|
Income cap for family of three (2015–16) |
$42,216 |
$42,216 |
N/A |
$20,090 |
|
Work requirement |
Yes |
Yes for full–day program |
No |
No |
|
Age eligibility criteria |
Two through five–year olds |
Three and four–year olds |
Four–year olds with birthdays between September 2 and December 2 |
Three and four–year olds |
|
Four–year olds served (2015–16 estimates) |
5,400 |
138,400 |
83,000 |
46,400 |
|
Program |
||||
|
Provider(s) |
Subsidized centers |
LEAs and subsidized centers |
LEAs |
LEAs and subsidized centers |
|
Duration |
Varies based on parents’ work schedules |
At least 6.5 hours per day, 250 days per year for full–day program; at least three hours per day, 175 days per year for part–day program |
Must operate no fewer than 180 days per year, hours per day determined by district |
Determined by local provider |
|
Funding |
||||
|
Method of payment |
State provides funds to providers on behalf of families |
State directly contracts with providers |
State provides funds through LCFF |
5–year federal grant directly to providers |
|
Total funding for four–year olds (2015–16 estimates) |
$60 million |
$740 million |
$690 million |
$420 million |
|
Annual funding per child (2015–16) |
Average of $10,600 for full–time program |
$4,200 (part day) and $9,600 (full day) |
Average of $8,500 |
Average of $9,100 |
|
a Includes the CalWORKs child care and Alternative Payment programs. Programs are offered to children birth through 12 years of age, with a certain funding rate and program requirements for children two through five–years old. Number of four–year olds served is estimate of four–year olds receiving care in a center. Overall, 19,100 four–year olds received vouchers for care in a variety of settings. Full–time rate assumes reimbursement on a monthly basis. bUp to 15 percent of children in program may come from families with incomes above cap. Program gives priority to serving four–year olds. cDistricts may choose to serve other four–year olds, but those children do not generate state funding until they turn five. dUp to 10 percent of children in program may come from families with incomes above cap. Some programs also provide home visits and wraparound services such as health check–ups. Number of four–year olds served is based on 2014–15 enrollment. |
||||
|
LEA = local education agency and LCFF = Local Control Funding Formula. |
||||
For Some Programs, Available Slots Insufficient to Serve All Eligible Children. Some voucher programs, CSPP, and Head Start are unable to serve all eligible children. Slots for these programs are determined by annual budget appropriations and priority for slots is given to certain children. Voucher programs and CSPP must give priority to children receiving child protective services, children at risk of being abused or neglected, and children from families with the lowest incomes. Head Start providers are required to develop their own priority ranking based on the needs of the local community, but they too generally limit eligibility to children from low–income families. For TK, all four–year olds with September 2 to December 2 birthdays, regardless of family income, are guaranteed slots. School districts receive TK funding for these children automatically as part of their LCFF allotments.
Some Children From Low–Income Families Not Currently Served. Based on participation data from the four programs, we estimate between 60 percent and 80 percent of four–year olds from families that earn below 185 percent of the federal poverty level (FPL) are served by subsidized preschool centers and school districts. This range is large because we do not have data on the number of children enrolled in multiple programs. (The 185 percent threshold is used as an eligibility criterion for various K–12 education programs, including a major child nutrition program. In 2015–16, the 185 percent threshold equated to about $37,000 a year for a family of three.) Eligible children may not be participating for a variety of reasons. Some families may not be aware of subsidized programs, may choose not to enroll their children, or may be unable to find slots in nearby programs.
Many Children With Disabilities Not Currently Served in Mainstream Programs. Federal law requires that LEAs provide appropriate services, in many cases including preschool, to children with disabilities. Federal law also requires that students with disabilities be served in the least restrictive environment. For most three and four–year olds with disabilities, this means a program where they are served along with their mainstream peers, such as in CSPP. Because federal law does not require school districts to create a mainstream preschool program if they do not already have one, some children with special needs may not have a mainstreaming option available. In 2013–14, 41 percent of three and four–year olds with special needs were served in mainstream programs, 34 percent were served in specialized programs, and 25 percent did not receive any form of early education.
Programs Have Different Standards and Oversight. Figure 18 describes the standards that apply to the four preschool programs. Each program has a unique set of requirements related to teacher qualifications, staffing ratios, health and safety standards, developmental standards, and oversight. As shown in the figure, all programs are required to meet some minimum health and safety standards, although specific standards vary by program. Three of the programs must include developmental standards, but these specific standards also vary somewhat across the programs. Center–based voucher programs are not required to include developmental standards, but some may provide services similar to CSPP.
Figure 18
Standards for Major Preschool Programs
|
Center–Based Voucher Programs |
California State Preschool |
Transitional Kindergarten |
Head Start |
|
|
Teacher Qualifications |
Child Development Associate Credential or 12 units in ECE/CD.a |
Child Development Teacher Permit (24 units of ECE/CD plus 16 general education units).b |
Bachelor’s degree, Multiple Subject Teaching Credential, and a Child Development Teacher Permit or at least 24 units of ECE/CD or comparable experience.c |
Half of teachers must have a bachelor’s degree in ECE/CD or a bachelor’s degree with ECE/CD experience. Rest of teachers must have associate degree in ECE/CD (typically between 24 and 40 credits) or associate degree with ECE experience. |
|
Staffing Ratios |
1:12 teacher–child ratio or 1 teacher and 1 aide per 15–18 children. |
1:24 teacher–child ratio and 1:8 adult–child ratio. |
1:33 maximum teacher–child ratio. |
1:20 teacher–child ratio and 1:10 adult to child ratio. |
|
Health and Safety Standards |
Staff and volunteers are fingerprinted. Subject to CCL health and safety standards. |
Staff and volunteers are fingerprinted. Subject to CCL health and safety standards. |
Staff and volunteers are fingerprinted. Subject to K–12 health and safety standards. |
Staff and volunteers are fingerprinted. Subject to CCL health and safety standards. |
|
Developmental Standards |
None. |
Developmentally appropriate activities designed to facilitate transition to kindergarten. |
Locally developed, modified kindergarten curriculum. |
The Head Start Early Learning Outcomes Framework. |
|
Oversight |
Unannounced visits by CCL every three years or more frequently under special circumstances. |
Unannounced visits by CCL every three years or more frequently under special circumstances. Onsite reviews by CDE every three years (or as resources allow) and annual self–assessments. |
Teacher–child ratios subject to annual audit. Some school facilities inspected by COEs. |
Unannounced visits by CCL every three years or more frequently under special circumstances. Onsite reviews by the Federal Office of Head Start every three years. |
|
aThe Child Development Associate Credential is issued by the National Credentialing Program of the Council for Professional Recognition. bThe Child Development Teacher Permit is issued by California’s Commission on Teacher Credentialing. cEffective for new TK teachers hired after July 1, 2015. CCL= Community Care Licensing; CDE = California Department of Education; and ECE/CD = Early Childhood Education/Child Development. |
||||
Governor’s Proposal
Governor Proposes Consolidating Three Existing Funding Streams Into New Block Grant. The Governor proposes to consolidate three existing preschool programs into a new $1.6 billion Early Education Block Grant. Specifically, the proposal would redirect funding from CSPP ($845 million), TK ($726 million), and the QRIS Block Grant for CSPP ($50 million). Funds from the new block grant would be given to LEAs and potentially other entities that currently offer CSPP to operate a developmentally appropriate preschool program. The providers also would be required to conduct some support activities, including family engagement, screening for developmental disabilities, and referral to supportive health and social services, if appropriate. The Governor’s proposal does not shift $33 million in CSPP funds that support preschool programs at 55 community colleges. (These programs serve the dual purpose of providing preschool for children of community college students and serving as a lab school for students training to become preschool teachers.)
Low–Income and At–Risk Children to Receive Priority. The Governor’s proposal requires block grant recipients to prioritize services to children from low–income families (as defined locally), homeless children, foster children, children with disabilities, children at–risk of abuse and neglect, and English learners. Although the proposal specifies which students should receive priority, the proposal does not require providers to serve any specific group of students.
Hold Harmless Provision for LEAs. The Governor’s proposal includes a hold harmless provision that ensures LEAs receive the same amount from the new block grant as they otherwise would have received from TK and CSPP contracts. The state would distribute any remaining block grant funds based on local need. (At the time of this writing, the administration’s proposed trailer legislation had no specific definition of “local need.”)
Administration Plans to Submit Additional Details of New Program as Part of May Revision. The Governor’s January proposal contains few details about the restructured preschool program. The proposal, for example, does not set forth specific eligibility criteria, the role of private providers, program standards, or clear funding rules. The administration intends to solicit feedback from stakeholders on these issues and release a more detailed proposal in May.
Assessment
Consolidating Funding and Prioritizing Based on Need Are Improvements Over Current Approach. The Governor’s proposal to consolidate three preschool funding streams into one program would help simplify and streamline the state’s existing labyrinth of preschool programs while improving transparency and coherence. Prioritizing funds for low–income children would ensure that the state’s available resources are directed to those most likely to benefit. Low–income families are both less likely than higher–income families to be able to afford preschool and more likely to benefit from access to preschool (according to most mainstream research). Prioritizing at–risk students would provide children who have had adverse early childhood experiences access to supportive environments. Finally, prioritizing children with disabilities as part of a larger mainstream program creates more opportunities for them to be served alongside their peers.
Allowing Income Eligibility to Be Locally Determined Likely to Result in Similar Children Receiving Different Levels of Service. We are concerned about the Governor’s proposal to let income eligibility criteria be locally determined. Allowing this core eligibility criterion to be set locally very likely would result in notable differences across the state in services and funding per child. This could result in similar children being treated very differently based on where they live. Neighboring school districts with similar levels of funding, for example, could target their program to a different set of students and provide significantly different levels of service.
Hold Harmless Provision Limits Ability to Allocate Funding Based on Need. We also are concerned about the Governor’s proposal to lock in districts’ funding allocations permanently. Because TK eligibility is based on birth month and not tied to need, school districts with relatively low and relatively high shares of low–income students currently may be operating TK programs that are similar in size. Thus, the Governor’s proposed hold harmless provision would result in some districts permanently receiving a disproportionate amount of funding relative to their numbers of low–income and at–risk children. These districts would be able to expand eligibility to serve a much larger share of their children or provide a much more expensive program for low–income or at–risk children in their areas. By contrast, some school districts with relatively high proportions of low–income and at–risk children would receive proportionately fewer resources. As a result, these districts would have to narrow eligibility or operate with notably less funding per child.
Recommendations
Key Features of Any Restructured Preschool Program. As discussed below, we believe certain features are important to include as part of any restructured preschool program.
One Consolidated Funding Stream. We recommend the Legislature consolidate all existing Proposition 98 funding for preschool into one new program. Under this approach, the state would consolidate nearly $1.7 billion in funding from CSPP, TK, and QRIS, as well as the set aside for community college lab schools, into one program.
Specific Eligibility Criteria. To ensure similar children are treated similarly across the state, we recommend the Legislature set specific criteria for which students are eligible for the new preschool program. We think a reasonable approach would be to provide preschool to all four–year olds from families with incomes below 185 percent of FPL, and all four–year olds who are receiving child protective services, are at–risk of being abused or neglected, are homeless, or have disabilities. Providers under such an approach might choose to offer preschool to children above 185 percent of FPL, but they would need to do so using other resources.
Funding Linked to Children. To ensure that additional funding directly results in additional children being served, we recommend the Legislature allocate funding to providers based on the number of eligible children who participate in the program. This approach is similar to current funding for CSPP and TK. (As discussed in the nearby box, setting a per–child funding rate is likely to be among the Legislature’s most difficult program decisions.) If the Legislature were to adopt a hold harmless provision for current providers, we recommend the provision only take effect during the transition to the new system, as this would better ensure funding upon full implementation is linked to children.
Illustration of One Possible Funding Rate for New Preschool Program
One of the most difficult decisions the Legislature likely would face as part of restructuring is setting the specific per–child funding rate. Ideally, the funding rate would be based on the cost of the service being sought. For illustrative purposes, if the Legislature required new preschool programs to operate 180 days per year (the same as the school year), it might offer a part–day rate of $5,200 and a full–day rate of $7,800 (part–day rate plus a $2,600 wraparound rate). This part–day rate is 20 percent higher than the current CSPP part–day rate. This wraparound rate is the same as the current CSPP wrap rate, adjusted for 180 days. These rates are roughly comparable to the current market–based, full–time, monthly voucher preschool rates, adjusted for 180 days. At these rates, we estimate the state could serve all children who meet our recommended eligibility criteria within existing resources.
Convenience for Families. The Legislature could take a couple of steps to make participation easier for families. We recommend the state require providers to offer full–day preschool programs for children from low–income, working families. Without a full–day option, some families would otherwise be unable work or opt to place their children in less formal environments that have no specific learning expectations. We also recommend the Legislature create a streamlined eligibility verification process that reviews eligibility only once per year (at the beginning of the school year). Under such an approach, a child would remain eligible for the entire school year, regardless of changes in family circumstances.
Developmentally Appropriate Activities. We also recommend providers be required to include developmentally appropriate activities in their preschool programs. This could include using California’s Preschool Learning Foundations or an alternative framework, such as the Head Start Early Learning Outcomes Framework, that includes age–appropriate activities. Foundations such as these typically focus on helping children learn self–awareness and self–regulation, how to interact with peers and teachers, language and basic literacy, and basic numeracy. Because these types of frameworks are not overly prescriptive, providers still would retain a great deal flexibility to develop a specific curriculum tailored to the needs and interests of their children.
Minimum Staffing Requirements. We recommend the Legislature set some minimum standards to ensure a baseline of services for all eligible children. At a minimum, we recommend that the state require teachers to have some education in child development (for example, a Child Development Permit, as is required in CSPP) and set a maximum teacher–child ratio.
Basic Reporting Requirements. We recommend the Legislature also require basic information from providers. We recommend requiring providers to collect basic student demographic information, such as race, gender, family income, and disability status. This data would allow educators and policymakers to monitor program participation. The Legislature also could require CDE to report preschool participation rates by county. This would help the state identify geographical areas that consistently enroll relatively few eligible children, thereby allowing the state to make targeted efforts to increase preschool enrollment in those areas. To foster transparency, we also recommend the state require providers to create plans that would be available online. Such plans could include information on key elements of a program, such as the length of the program (hours per day and days per year), curriculum, process for measuring the program’s added value to the child, and family engagement activities.
Other Key Restructuring Decisions
Various Trade–Offs to Consider When Designing Remaining Features of Program. In addition to the above issues, the Legislature faces other important restructuring decisions. These decisions entail selecting providers, developing a method for disbursing funding, and figuring out how best to oversee the new program. Below, we discuss some trade–offs the Legislature faces in making each of these decisions.
Providers. One key decision the Legislature would face in restructuring preschool is identifying which entities should be responsible for providing the program. On the one hand, school districts and charter schools offer greater opportunity to ensure preschool is aligned with kindergarten and the rest of the K–12 school system. Additionally, because school districts already have specific district boundaries and are required to serve all school–aged children within those boundaries, they are well–positioned to ensure that all eligible children living within their catchment area have access to a new preschool program. (Smaller school districts, charter schools, and COEs also are familiar with forming joint powers agencies to help them coordinate program services within their vicinities.) Currently, no similar catchment system exists for non–LEA providers. On the other hand, many non–LEA providers have a long history and considerable expertise serving preschool–aged children. In many cases, these providers also provide wraparound services, such as infant or toddler child care and after school care. Furthermore, non–LEA providers may provide certain types of preschool options that have greater appeal to some families and may be more conveniently located for some families than their LEA options.
A Method for Disbursing Funds. Another important decision the Legislature would face in restructuring preschool is deciding how to disburse funds to providers. Disbursing funds to LEAs through the LCFF system is straightforward and requires no special administrative structure. Were both LEAs and non–LEAs to provide preschool programs, however, the state likely would need another funding disbursement mechanism. For example, it might continue issuing direct contracts with providers. Though direct contracts are somewhat more administratively burdensome than LCFF allocations, they still can keep funding linked with children served and track slots allotted to each provider.
Oversight and Accountability. Finally, if it pursues preschool restructuring, the Legislature will need to decide how to oversee program providers. On the one hand, having a robust state oversight system could result in greater consistency among programs statewide. On the other hand, a local oversight system could take into account local priorities and challenges while also providing more tailored feedback to local providers on improving their programs.
Some Program Components Fit Together Better Than Others. Some combinations of decisions seem to fit together better than other combinations. In particular, certain combinations of eligibility, provider, funding, and oversight decisions seem to go together. For example, if the Legislature were to decide to serve all low–income children, then relying on school districts becomes a relatively natural fit, as districts could be required to serve all children showing up for the program. If LEAs were selected as providers, then disbursing funds through LCFF and using local governing boards as oversight agents become more natural downstream decisions. Alternatively, were the Legislature to decide to select both LEAs and non–LEAs as providers, then disbursing funds through direct state contracts and using state agencies to perform some oversight activities become more natural downstream decisions.
Transition
Multi–Year Phase In. Any effort to restructure California’s preschool programs into a single, coherent program will involve many decisions and take some time. By gradually introducing new eligibility, program, funding, and administrative requirements over a number of years, the state could minimize disruption to children, families, and providers while ensuring steady progress towards a better system. Given families typically make enrollment decisions and providers typically make staffing and budget decisions several months in advance, we recommend the Legislature allow plenty of time to notify them of any program changes.
Transition Plan. As part of restructuring, we recommend the Legislature create a transition plan that sets forth when certain changes would take place. For example, in the first year of a transition plan, the state could continue CSPP and TK under existing rules. In the second year, the state could replace CSPP and TK rules with new eligibility rules and begin changing funding allocations to match children served. In the third year, the state could fully transition to the new funding formula and begin to ramp up program oversight.
Back to the TopEducation Mandates
In this section, we first provide background on state education mandates and then discuss the Governor’s proposals for paying down the mandate backlog and funding the mandates block grant.
Background
Constitution Requires the State to Reimburse Local Governments for Mandated Activities. Proposition 4, passed by California voters in 1979, requires the state to reimburse local governments for the cost of new programs and higher levels of service it imposes upon them. Under a process subsequently established in state law, the Commission on State Mandates (CSM) determines if a new law, regulation, or executive action constitutes a reimbursable state mandate for local governments. In the area of education, a local government is defined as a school district, COE, or community college district—collectively referred to as local education agencies (LEAs) throughout this section. Although some state–mandated activities also apply to charter schools, the CSM deemed these schools ineligible for reimbursement beginning in 2006.
Currently 58 Active Education Mandates. As shown in Figure 19, the state budget currently recognizes 43 mandates that apply to K–12 education and 15 that apply to community colleges. (Of these mandates, seven apply to both K–12 education and community colleges.) The state has suspended 17 other education mandates (five that apply only to K–12 education, five that apply only to community colleges, and seven that apply to both). LEAs are not required to perform the activities associated with suspended mandates and, consequently, the state is not required to reimburse them.
Figure 19
Education Mandatesa
|
K–12 Education |
|
|
Active (43) |
|
|
Academic Performance Index |
Juvenile Court Notices II |
|
Agency Fee Arrangements |
Law Enforcement Agency Notificationc |
|
AIDS Prevention/Instruction I and II |
Notification of Truancy |
|
Annual Parent Notificationb |
Open Meetings/Brown Act Reform |
|
California State Teachers’ Retirement System Service Credit |
Parental Involvement Programs |
|
Caregiver Affidavits |
Physical Performance Tests |
|
Charter Schools I, II, III, and IV |
Prevailing Wage Rate |
|
Child Abuse and Neglect Reporting |
Public Contracts |
|
County Office of Education Fiscal Accountability Reporting |
Pupil Suspensions and Expulsions I and II |
|
Collective Bargaining |
Pupil Health Screenings |
|
Comprehensive School Safety Plans I and II |
Pupil Promotion and Retention |
|
Criminal Background Checks I and II |
Pupil Safety Notices |
|
Developer Fees |
Race to the Top |
|
Differential Pay and Reemployment |
School Accountability Report Cards I, II, III, and IV |
|
Expulsion of Pupil: Transcript Cost for Appeals |
School District Fiscal Accountability Reporting |
|
Financial and Compliance Audits |
School District Reorganization |
|
Graduation Requirements |
Teacher Notification: Pupil Suspensions/Expulsionsd |
|
Habitual Truants |
The Stull Act |
|
High School Exit Examination I and II |
Threats Against Peace Officers |
|
Immunization Records (includes Pertussis and Hepatitis B) |
Uniform Complaint Procedures |
|
Intradistrict Attendance |
Williams Case Implementation I, II, and III |
|
Interdistrict Attendance Permits |
|
|
Suspended (12) |
|
|
Absentee Ballots |
Mandate Reimbursement Process I and II |
|
Brendon Maguire Act |
Physical Education Reports |
|
County Treasury Withdrawals |
Pupil Residency Verification and Appeals |
|
Grand Jury Proceedings |
Removal of Chemicals |
|
Health Benefits for Survivors of Peace Officers/Firefighters |
School Bus Safety I and II |
|
Law Enforcement Sexual Harassment Training |
Scoliosis Screening |
|
Community Colleges |
|
|
Active (15) |
|
|
Agency Fee Arrangements |
Minimum Conditions for State Aid |
|
Cal Grants |
Open Meetings/Brown Act Reform |
|
California State Teachers’ Retirement System Service Credit |
Prevailing Wage Rate |
|
Collective Bargaining |
Public Contracts |
|
Community College Construction |
Reporting Improper Governmental Activities |
|
Discrimination Complaint Procedures |
Threats Against Peace Officers |
|
Enrollment Fee Collection and Waivers |
Tuition Fee Waivers |
|
Health Fee Elimination |
|
|
Suspended (12) |
|
|
Absentee Ballots |
Law Enforcement Jurisdiction Agreements |
|
Brendon Maguire Act |
Law Enforcement Sexual Harassment Training |
|
County Treasury Withdrawals |
Mandate Reimbursement Process I and II |
|
Grand Jury Proceedings |
Sex Offenders: Disclosure by Law Enforcement |
|
Health Benefits for Survivors of Peace Officers / Firefighters |
Sexual Assault Response Procedures |
|
Integrated Waste Management |
Student Records |
|
aMandates typically include only very specific activities associated with their name. bAlso includes Schoolsite Discipline Rules and Alternative Schools. cAlso includes Missing Children Reports. dAlso includes Pupil Discipline Records. |
|
Two Additional Mandates in Various Phases of the Filing and Determination Process. The CSM recently found two new state requirements to be mandates. The CSM recognized a law requiring school districts and COEs to provide annual training on the detection of child abuse to be a mandate. In addition, the CSM identified as a new mandate a requirement for school districts and COEs to purchase devices for the administration of new computer–based state exams in English language arts and math. The CSM is currently in the process of determining a cost estimate for both mandates.
State Traditionally Paid Mandates Through Claims Process. Under the state’s traditional mandate reimbursement process, LEAs submit claims for the actual cost of performing each mandated activity. The State Controller’s Office (SCO) pays claims from funds appropriated in the state budget. The SCO also audits some claims and reduces payments accordingly.
Mandates Also Can Be Paid Using Reasonable Reimbursement Method (RRM). Beginning in 2004, the state established an alternative reimbursement method, known as the RRM. Rather than filing for the actual cost of performing the mandated activity, an RRM uses a formula to determine a reasonable amount to allocate to each applicable LEA. The CSM has adopted two education RRMs to date—one relating to the high school science graduation requirement and one relating to behavioral intervention plans.
State Went Many Consecutive Years Without Paying Claims, Large Backlog Mounted. The state deferred payments on education mandate claims for seven consecutive years—from 2003–04 through 2009–10. During this period, LEAs continued to submit claims, creating a large backlog of outstanding mandate claims.
Claim Amounts Vary Widely. Over the past several decades, our office has expressed concerns with the traditional claims reimbursement process. One of the most disconcerting aspects of the state’s traditional reimbursement method is that per–student claims vary so greatly among every type of LEA. As Figure 20 shows, school district per–student claims range from less than $1 to almost $8,700. The range in per–student claims for COEs is even wider, from a low of less than $150 to a high of almost $30,000. Perhaps surprisingly, LEA size is not strongly correlated with the size of per–student claims. For example, the smallest and largest district claimers both have fewer than 5,000 students.
Figure 20
Distribution of LEAs’ Outstanding Claims
Claims Per Student
|
Share With Claims |
Minimum Claim |
Median Claim |
Maximum Claim |
|
|
School districts |
50% |
—a |
$400 |
$8,673 |
|
County offices of education |
69 |
$148 |
2,649 |
29,719 |
|
Community college districts |
14 |
183 |
1,514 |
5,001 |
|
aActual value of claim is $0.39 per student. Note: Local education agencies (LEAs) with no outstanding balances have been omitted. |
||||
Widespread Agreement Claims Process Has Other Serious Shortcomings. In addition to allowing vast differences in per–student claims, the traditional reimbursement process provides no incentive for LEAs to perform activities as efficiently as possible. The traditional reimbursement process also has a high administrative burden, as LEAs must document specific costs and fill out associated reimbursement forms. This administrative process is so daunting that some LEAs do not file for reimbursement and other LEAs hire consultants specifically to help with their filings. Costs associated with filing this paperwork led the CSM to determine that the filing process was itself a mandate, for which LEAs could submit reimbursement claims. The Mandate Reimbursement Mandate traditionally is one of the state’s more expensive mandates. Even after collecting and submitting receipts, LEAs subsequently can be audited by the state, and the SCO historically has had very high disallowance rates on audited claims. Of K–12 claims that the SCO determines to be high risk and audits, it disallows about 75 percent of claim costs.
State Has Made Significant Progress Towards Reducing the Backlog, but Sizeable Backlog Remains. As Figure 21 shows, the state has provided $4.5 billion for reducing the K–14 mandate backlog since 2010–11. Of this amount, $3.8 billion has been for the K–12 backlog and $700 million for the community college backlog. After accounting for these payments, we estimate that the current K–14 backlog is $1.9 billion. (Our backlog estimate does not include the $700 million in submitted claims associated with pending litigation, as we assume the state prevails in these cases.)
Figure 21
Funding for Education Mandates Backlog Since 2010–11
(In Millions)
|
Year Funding Provided |
K–12 Education |
Community Colleges |
Totals |
|
2010–11 |
$187 |
$23 |
$210 |
|
2014–15 |
400 |
50 |
450 |
|
2015–16 |
3,205 |
632 |
3,837 |
|
Totals |
$3,792 |
$705 |
$4,497 |
State Created Mandate Block Grants as Alternative to Claims Process. To address concerns with the mandate claims process and provide a streamlined alternative approach for reimbursing LEAs, the state created two mandate block grants in the 2012–13 budget: a K–12 block grant (for districts, COEs, and charter schools) and a community college block grant. The LEAs that choose to participate in these block grants receive per–student funding to cover the cost of state–mandated activities in lieu of submitting claims. Figure 22 shows the per–student funding rates provided in the block grants. As shown in the figure, the per–student funding rate for most types of students is $28, with double that amount ($56) provided for high school students. Charter schools generally receive half the per–student funding rates of school districts, as about half of K–12 mandates apply to them. A COE receives funding for its direct students, as well as $1 for each K–12 student in the county. The K–12 and CCC block grants are intended to cover the annual costs of included mandates. Under this approach, the backlog for any mandates in the block grants does not grow, but action still is needed to reduce the prior–year backlog.
Figure 22
Mandate Block Grant Rates
|
Type of LEA |
Attendance Type |
Block Grant Rate Per Student |
|
School Districts |
K – 8 |
$28 |
|
9 – 12 |
56 |
|
|
Charter Schools |
K – 8 |
14 |
|
9 – 12 |
42 |
|
|
COEs |
K – 8 |
28 |
|
9 – 12 |
56 |
|
|
Countywide K–12 |
1 |
|
|
Community Colleges |
FTE student |
28 |
|
LEA = local education agency; COE = county office of education; and FTE = full–time equivalent. |
||
Near Universal Participation in Block Grant. The two block grants have very high participation rates. In 2015–16, 93 percent of school districts, 91 percent of COEs, 91 percent of charter schools, and all community college districts participated in the block grant. These participation rates reflect modest increases for all LEA types compared to 2014–15. Currently, the LEAs participating in the block grants account for 99 percent of K–14 attendance statewide.
Mandate Backlog
Below, we explain the Governor’s proposal to pay down the backlog of outstanding mandate claims, assess the proposal, and recommend an alternative approach.
Governor’s Proposal
Governor Counts $1.4 Billion in One–Time Funding Toward Mandates Backlog. The Governor’s budget proposes to provide a large amount of one–time funding to schools ($1.3 billion) and community colleges ($76 million). The Governor proposes to count this funding toward schools’ and community colleges’ mandate backlogs. Consistent with similar payments made by the state the past few years, the Governor proposes to distribute this funding on a per–student basis, with schools receiving $214 per ADA and community colleges receiving $72 per FTE student. (From an accounting perspective, the $1.4 billion consists of $754 million from 2015–16 funds, $342 million from 2014–15 funds, $229 million from settle–up funds, and $32 million from unspent prior–year funds.)
Schools and Community Colleges Can Use Funds for Any Purpose. In many cases, LEAs incurred associated mandate costs many years ago, with some claims dating to more than twenty years ago. The funding LEAs would receive in 2016–17 therefore generally would not reimburse activities recently undertaken. Given this timing issue, the Governor proposes language encouraging school districts, COEs, and charter schools to dedicate their one–time funds to implementation of Common Core State Standards, technology, professional development, induction programs for beginning teachers, and deferred maintenance. Somewhat similarly, the Governor’s proposal includes language encouraging community colleges to use their one–time funds for campus security, technology, professional development, and the development of open education resources and zero–textbook–cost degrees.
Assessment
Many LEAs Have No Outstanding Claims. Due to the substantial payments the state already has made to reduce the backlog, many LEAs now have no outstanding mandate claims. After accounting for payments made in the 2015–16 budget, we estimate 50 percent of school districts, 31 percent of COEs, and 86 percent of community colleges have no outstanding claims. (Because charter schools are not eligible for reimbursement, they also have no outstanding claims.)
Few Apparent Reasons Why Some LEAs Might Still Have Claims. Based on our review, we found few reasons to explain differences in per–student mandate claims. As mentioned earlier, the size of outstanding claims does not strongly relate to LEA size. One clear finding is that COEs have consistently higher claims on average than school districts. Even among COEs, however, significant differences exist. For example, among COEs that directly serve fewer than 100 students, outstanding claims range from $315 to $29,700 per student.
Ten Community Colleges With Remaining Claims Are a Stark Illustration of Issues Now Facing State. As Figure 23 shows, the four community college districts with the largest remaining claims account for nearly 90 percent of the remaining community college backlog. However, the students enrolled in these four community colleges account for less than 7 percent of all community college students statewide. The highest claimer, the North Orange Community College District, accounts for 52 percent of the remaining statewide backlog yet only 3 percent of the system’s FTE students. The level of disparity in community college claims is particularly striking considering the mandated activities apply uniformly and community colleges have less variation in size than school districts or COEs.
Figure 23
Community Colleges With Remaining Mandate Backlog Claims
Estimated Backlog at End of 2015–16
|
Community College District |
FTE Students |
Remaining Claims |
Percent of Remaining Backlog |
|
North Orange |
29,825 |
$149,056,058 |
52% |
|
El Camino |
18,462 |
41,191,858 |
14 |
|
Victor Valley |
9,293 |
37,521,227 |
13 |
|
Long Beach |
19,676 |
28,287,718 |
10 |
|
Foothill–Deanza |
27,115 |
13,010,492 |
5 |
|
Redwoods |
3,760 |
5,952,136 |
2 |
|
West Kern |
2,478 |
4,175,026 |
1 |
|
San Mateo |
18,418 |
3,377,897 |
1 |
|
Palo Verde |
1,362 |
1,061,374 |
— |
|
Gavilan Joint |
4,647 |
831,693 |
— |
|
Totals |
135,036 |
$284,465,480 |
100% |
|
FTE = full–time equivalent. |
|||
Paying Down Backlog on Per–Student Basis Initially Had Notable Advantages. Paying down the backlog on a per–student basis allocates funding proportionally, regardless of past mandate claiming practices. This approach ensures that LEAs are not disadvantaged if they did not submit claims in the past due to the complexity of the claiming process or if they performed mandated activities at a lower cost compared to other LEAs. The uniform per–student approach for all LEAs also reduces the incentive for LEAs in the future to perform state–mandated activities in inefficient or excessively costly ways. A per–student approach also is consistent with the mandate block grant approach, which allocates funding primarily based on attendance, with some adjustments for the particular circumstances of charters schools and COEs.
Eliminating Remaining Backlog Solely Using Per–Student Basis Unrealistic. Given the wide variation in remaining claims, paying off the backlog using solely a per–student approach is no longer sensible. Of the Governor’s proposed $1.4 billion mandate backlog payment, we estimate that only 48 percent of the K–12 payments and 14 percent of the community college payments would reduce the backlog. If the state were to continue a per–student approach in future years, such payments would be even less efficient for paying off the backlog. After the Governor’s proposed payment, we estimate the state would need to provide an additional $177 billion to retire the K–12 mandate backlog and another $5 billion to retire the community colleges backlog using the per–student approach.
Recommendations
Recommend a Multi–Year Plan for Retiring the Mandate Backlog. We recommend creating a plan for districts and COEs to address the mandate backlog. The plan would provide $2.6 billion over the next two to three years, about $1 billion more than the existing mandate backlog. (The exact length of the plan would depend on the amount of one–time funding available.) As a condition of receiving funding, the state would require school districts and COEs to write–off any mandate claims outstanding as of the end of 2015–16. For those LEAs choosing not to participate in the payment plan, the state would continue to retain and track all of their outstanding mandate claims. We think that our plan provides a per–student funding stream that avoids rewarding LEAs with extraordinarily high claims, while also strategically retiring a large proportion of the existing backlog. Below, we discuss the specific amounts that our plan provides to school districts, COEs, charter schools, and community colleges.
Provide Districts With Per–Student Funding Based on Statewide Median Claim. We recommend providing all participating school districts with $450 per ADA, equal to the median outstanding mandate claim for K–12 LEAs. If all school districts chose to accept the funding, the state cost would be $2.4 billion.
Provide Most COEs With Per–Student Funding, With Minimum Payment for Small COEs. We recommend the state provide COEs $450 per ADA (the same rate as districts), plus $20 per countywide ADA. An additional countywide ADA payment is consistent with the structure of the mandates block grant for COEs, which provides funding per countywide ADA in recognition of the countywide services that COEs perform. To ensure the payments are sufficient to significantly reduce the backlog for small COEs, which tend to have the highest per–student costs of all types of LEAs, we recommend each participating COE receive the greater of its ADA–derived allotment or $1 million. If all COEs chose to participate in this plan, the state cost could be $160 million.
Do Not Provide Funding to Charter Schools. We recommend the Legislature provide no additional funding for charter schools at this time. In each of the past few years, the state has provided charter schools with the same per–student backlog funding it provided for school districts. The state, however, provides charter schools about half the district rate under the mandates block grant in recognition that about half of mandates apply to them. Because the state has not cut charter schools per–student mandate backlog rates in half the past few years, we believe the state already has provided an amount sufficient to cover charter schools prior–year mandate costs.
Do Not Provide Funding for Community College Backlog at This Time. The vast majority of community colleges (86 percent) have no outstanding backlog as of 2015–16. Given remaining claims are concentrated among only a dozen community colleges, providing a uniform per–student payment to all community colleges in 2016–17 would retire very little of the outstanding backlog. Instead of addressing outstanding claims at this time, we recommend the state continue to track claims. As we discuss further below, we recommend the state revisit the backlog when the vast majority of community colleges once again have claims on the books.
Address Any Remaining Backlog When Vast Majority of LEAs Once Again Have Sizeable Outstanding Claims. Under the funding rates for the backlog plan specified above, the vast majority of LEAs would receive enough funding to fully retire their backlogs. Other school districts and COEs that have some, but not all, of their claims funded likely would participate in plan too, thereby writing off their remaining claims. Upon full implementation of the plan, relatively few LEAs likely would have outstanding claims. We expect that outstanding claims will begin to grow again, as CSM identifies new mandates and LEAs incur costs during the initial determination phase. Growth in the backlog would occur very gradually, however, as the process of determining if legislation is a mandate and placing it in the block grant can take several years. Furthermore, the state has set precedent the past few years for adding new mandates to the block grant as soon as statewide cost estimates have been developed, such that backlog costs incurred in the interim phase could be relatively minor. Barring an unexpected, very costly mandate determination, we anticipate many years could pass before the vast majority of LEAs once again have outstanding mandate claims. We recommend that when the vast majority of LEAs have new claims and the outstanding backlog is sizeable, the state revisit the backlog. At that time, the state could consider new per–student funding rates for paying down both new and prior claims.
Mandates Block Grant
Below, we describe the Governor’s 2016–17 proposal related to the mandate block grants and recommend the Legislature apply a COLA to the block grants to preserve their purchasing power over the long run.
Governor’s Proposal
Maintains Per–Student Funding Levels for Block Grants. The Governor’s budget provides $219 million for the K–12 mandates block grant and $33 million for the community college mandates block grant. Compared to 2015–16, these totals reflect a $1 million reduction to the K–12 block grant and a $1 million increase to the community college block grant to reflect respective changes in attendance. The Governor makes no adjustment to the per–student rates for the block grants nor does the Governor propose to add or remove any mandates from the block grants.
Recommendation
Recommend Applying a COLA to Block Grants. We recommend the Legislature provide a 0.47 percent COLA to the mandates block grants (the same COLA rate used for other K–12 and community college programs). Applying a 0.47 percent COLA in 2016–17 would cost $1.2 million ($1 million for the K–12 block grant and $150,000 for the community colleges block grant). Providing an annual COLA would ensure block grant rates better reflect the cost of performing mandated activities and ensure LEAs’ purchasing power is maintained. The mandate block grant rates have not changed since the block grant was created in 2012–13. Without a COLA, the value of the block grants will erode over time, which might cause some LEAs to stop participating in the block grants and return to filing separate reimbursement claims—arguably a disadvantage both for them and the state.
Back to the TopSpecial Education
In this section, we begin with an overview of the Governor’s proposed budget for special education. We then examine three special education budget issues: (1) differences in special education per–student funding rates, (2) funding for infants and toddlers with exceptional needs, and (3) funding to develop new systems of support for struggling students.
Overview
Governor’s Budget Proposes Slight Reduction in Special Education Funding. As Figure 24 shows, the Governor’s budget includes $5 billion for special education in 2016–17. Funding decreases $41 million (1 percent) from the revised 2015–16 level. The largest single source of this decrease is the Governor’s proposal to remove a $30 million augmentation for infant and toddler services included in last year’s budget. An additional decrease of $30 million reflects a slight decline (0.4 percent) in projected 2016–17 attendance and various other technical adjustments. Offsetting some of this $60 million reduction is an $18 million increase for a 0.47 percent COLA and a $1 million increase in federal funding. Of total special education funding in 2016–17, 63 percent comes from the state General Fund, 24 percent from federal funds, and 13 percent from local property tax revenue. These shares are about the same as in the prior two years.
Figure 24
Special Education Funding
(Dollars in Millions)
|
2014–15 Actual |
2015–16 Revised |
2016–17 Proposed |
Change From 2015–16 |
||
|
Amount |
Percent |
||||
|
Proposition 98 |
|||||
|
General Fund |
$3,287 |
$3,257 |
$3,181 |
($76) |
–2% |
|
Local Property Taxes |
529 |
593 |
627 |
34 |
6 |
|
Subtotals |
($3,816) |
($3,850) |
($3,808) |
(–$42) |
(–1%) |
|
Federal Fundsa |
$1,210 |
$1,206 |
$1,207 |
$1 |
— |
|
Totals |
$5,026 |
$5,056 |
$5,016 |
–$41 |
–1% |
|
aExcludes $14 million in federal funding for infants and toddlers passed through from the Department of Developmental Services. |
|||||
Special Education Funding Rates
Below, we provide background on special education funding, discuss differences in special education funding rates, and recommend a process for reducing these differences over time.
Background
Federal Law Requires Districts to Provide Supplemental Support for Students With Disabilities. Specifically, the federal Individuals with Disabilities Education Act (IDEA) requires school districts, COEs, and charter schools (collectively referred to as LEAs) to provide “specially defined instruction, and related services, at no cost to parents, to meet the unique needs of a child with a disability.” Once a district has determined a student with a disability requires additional educational support, it develops an Individual Education Program (IEP) for the student that documents which special education services the district will provide. Throughout this section, we use the term student with disability (SWD) to refer to a student who has formally qualified to receive special education services.
Special Education Services Supported by Both General Purpose and Categorical Funds. Local agencies receive billions of dollars in LCFF funding on behalf of educating all students, including SWDs. As shown in Figure 25, the supplemental services LEAs must provide to SWDs impose additional costs on top of this base level of support. To assist LEAs in paying these additional costs, both the state and federal government distribute categorical funds dedicated specifically for special education. Because these funds typically are not sufficient to cover the costs of all IEP–required services, LEAs use general purpose funds to cover any remaining cost. (In addition to the main state and federal special education categorical programs, a few other special education categorical programs exist. The most notable of these is a state categorical program for infants and toddlers with exceptional needs.)
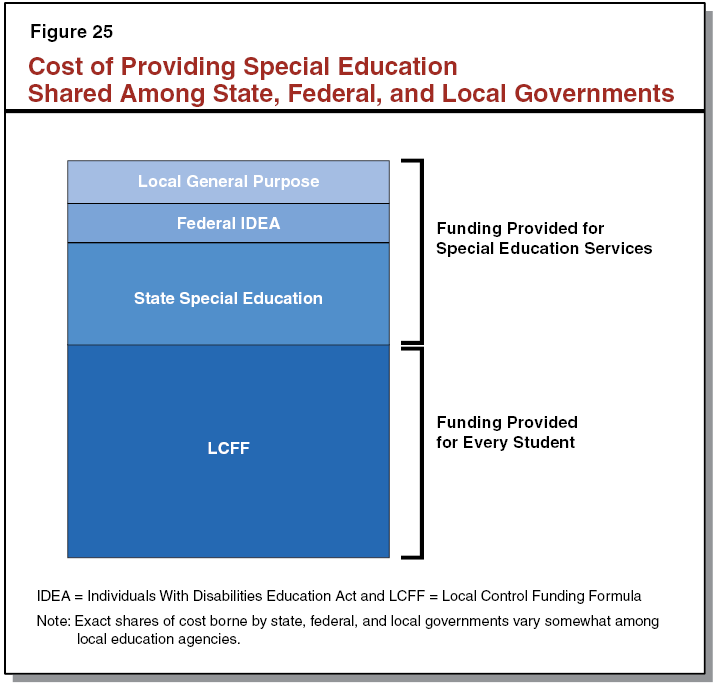
Most Categorical Funds Allocated to Special Education Local Plan Areas (SELPAs). Because economies of scale often improve both programmatic outcomes and cost–effectiveness, the state distributes special education categorical funds to 130 SELPAs rather than to the approximately 2,000 LEAs in the state. Most SELPAs are consortia of nearby districts, COEs, and charter schools, although some large districts have formed their own SELPAs. Additionally, three SELPAs consist of only charter schools and one SELPA consists solely of court schools in Los Angeles County. Each SELPA has a governing board consisting of member LEAs that determines how categorical funds will be allocated. These funds can be distributed to member LEAs or retained by the SELPA to operate shared, regionalized services. (A few special education funding streams, including funding for infants and toddlers with exceptional needs, are allocated directly to LEAs.)
State Previously Distributed Categorical Funds Based on Projected Costs. Prior to 1998, California distributed funds to SELPAs based on the estimated cost of providing specific “units” of special education services. This system provided higher funding amounts to SELPAs that identified a larger proportion of their students for special education and served these students in more expensive settings.
Most Categorical Funds Now Allocated Based on Overall Student Population. To eliminate the incentives to over–identify students for special education and provide them with more costly services, California switched to a “census–based” model for special education funding in 1998. The census–based model allocates funds to SELPAs based on total student attendance, regardless of how many students are served in special education. In adopting this model, the state implicitly assumes that SWDs are distributed equally across SELPAs. The federal government made a similar switch towards a census–based funding model starting in 2000, though some federal funds still are allocated according to other factors.
Special Education Funding Rates Vary Across SELPAs. Figure 26 shows the variation in SELPA per–student funding rates. The statewide median rate is $510 per student, with rates ranging from $480 to $925. This large variation in rates has existed for many decades, largely stemming from differences that pre–date the transition to the census–based model in 1998–99. When the state made the transition to the new special education funding model, each SELPA’s per–student rate was based on the amount of funding it had received under the old unit–based model. The state effectively carried forward significant variations in those former rates into the new system.
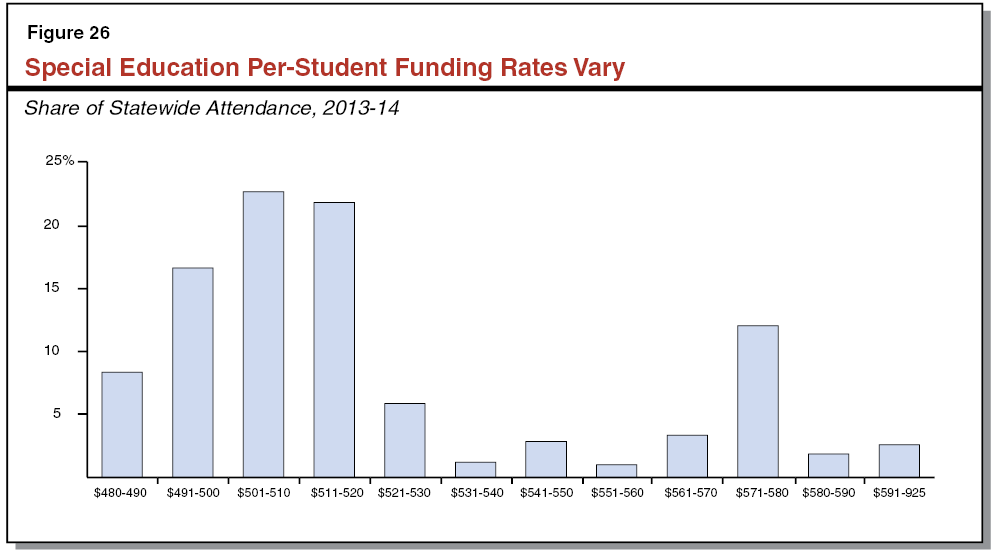
State Has Made Efforts to Equalize Special Education Rates. In an effort to reduce inequities in SELPA funding rates, the state funds all SELPAs’ attendance increases at a uniform rate ($530 per student in 2014–15). That is, when a SELPA’s attendance increases, it receives $530 per student, not its unique per–student rate. As SELPA attendance increases, this approach slowly increases the lowest per–student rates and decreases the highest rates. Because statewide attendance has been virtually flat over the last 10 years, this equalization approach has had little effect on the variation in per–student funding rates, with only growing SELPAs being affected. The state also provided $122 million in the late 1990s to partially equalize SELPA per–student rates. More recently, in 2013–14, the Legislature appropriated $30 million to equalize special education rates at the same pace as LCFF implementation, but these funds were vetoed by the Governor. In his veto message, the Governor expressed concern that special education equalization would come at the expense of LCFF implementation.
Special Education Funding Disparities Not Addressed in State’s Recent Finance Reform. Since enacted in 2013–14, the state has dedicated billions of new dollars toward implementing LCFF. In allocating these new dollars, the state has taken a “gap” approach, such that districts receive additional funding based on the difference (or gap) between their prior–year funding level and their target LCFF funding level. Under this approach, districts with historically low per–student funding rates are receiving larger LCFF funding increases than those with historically high per–student rates. Because special education funding was not shifted into LCFF and the Governor has not approved the Legislature’s recent special education equalization efforts, special education per–student rates have not increased significantly nor have differences in these rates been reduced significantly.
Assessment
Inequities in Special Education Funding Rates Are Due to Multiple Historic Anomalies. The differences between special education funding rates across the state are due to multiple historic anomalies that have no relationship to SELPAs’ current student populations. When the census–based funding model was first adopted in 1998, each SELPA’s per–pupil rate was determined by dividing their 1997–98 special education funding by their total ADA. These original rates differed among SELPAs primarily for two reasons. First, the old unit–based funding model provided greater levels of funding to SELPAs that identified a larger proportion of students for special education and served students in more expensive settings. Second, the state paid unequal per–unit rates to SELPAs. These per–unit rates were based on an informal survey of special education expenditures in 1979–80. The variation in expenditures primarily reflected differences in average teacher salaries at that time, which, in turn, were driven by differences in regional wages and differences in the experience and qualifications of individual teachers. Although we believe the state’s current census–based funding model is better designed than the old unit–based system, the current system in practice inherited the old system’s disparities in per–student rates, and the state has yet to reduce those disparities significantly.
LEAs in SELPAs With Relatively Low Rates Must Contribute a Larger Share of Local Funds to Special Education. When special education categorical funding does not cover all IEP–required services, LEAs must use their local general purpose funds to cover the difference. As a result, LEAs that belong to SELPAs with relatively low special education funding rates must contribute more (all else constant). We estimate that in 2013–14, school districts and COEs located in the quarter of SELPAs with the lowest funding rates spent an average of $370 per student in local funds. By contrast, districts and COEs located in the quarter of SELPAs with the highest funding rates spent an average of $305 per student in local funds. Because these funds would otherwise be available for general purpose expenditures, these findings indicate that inequities in special education funding spill over and generate inequities in the amount of resources districts and COEs have for general education purposes.
Recommendations
Set Target to Equalize Special Education Funding at the 90th Percentile. We recommend the Legislature adopt statute stating intent to equalize special education funding rates to the 90th percentile of existing rates. (When the Legislature has equalized funding for education programs in the past, it typically has set this level as a target.) We estimate the 90th percentile is approximately $570 per ADA in 2016–17. We estimate funding this equalization target would cost $307 million in 2016–17.
Close Special Education Funding “Gap” at Same Rate as LCFF. We recommend the Legislature take steps to equalize special education funding rates at the same pace as LCFF implementation. Using this approach would involve two steps. First, it would require calculating each SELPA’s funding “gap”—the difference between the 90th percentile rate and the SELPA’s current rate. Second, it would require that any funds set aside for LCFF transition funding be applied proportionally to the remaining gaps in both LCFF and special education. This would involve adding the total special education funding gap for all SELPAs to the statewide LCFF gap and using this new “LCFF plus special education” gap level to calculate a gap closure rate. This gap closure rate then would be applied equally to every SELPA (to close a portion of their special education funding gap) and LEA (to close an identical portion of their LCFF gap). If the Legislature adopted the Governor’s proposal to provide $2.8 billion for LCFF gap funding and used this approach to funding special education equalization, roughly $140 million would be appropriated to SELPAs. Under this approach, the state would close 46 percent of gap for both LCFF and special education funding (rather than 49 percent of the gap for LCFF only).
Infants and Toddlers With Exceptional Needs
Below, we provide background on the state’s program for infants and toddlers with exceptional needs, assess the Governor’s proposal to remove an augmentation provided for this program last year, and recommend the Legislature pursue comprehensive reform of this program.
Background
State Serves Infants and Toddlers Who Are Developmentally Delayed or at Risk for Delay. California receives federal funding under IDEA Part C, which requires participating states to offer services to all children from birth to 36 months of age who are developmentally delayed or at serious risk for a developmental delay. Risk factors include disabling conditions, such as hearing loss, visual or orthopedic impairments, and neurodevelopmental disorders, such as autism. The state identified and served approximately 35,000 infants and toddlers under these eligibility categories in 2014–15.
Most Infants and Toddlers Receive Services From the Department of Developmental Services (DDS). At the state level, responsibility for serving infants and toddlers with exceptional needs is shared by DDS and CDE. The state has designated DDS as the lead agency for IDEA Part C services. Approximately 85 percent of enrolled infants and toddlers receive services from Regional Centers contracting with DDS, whereas the remaining 15 percent receive services from LEAs and SELPAs under the direction of CDE.
LEAs and SELPAs Required to Serve Infants and Toddlers With Certain Disabilities. Since 1993, California has required SELPAs to serve all children who have solely low–incidence disabilities, which the state defines as being deaf or hard of hearing, blind or visually impaired, or orthopedically impaired. LEAs and SELPAs are not required to serve children who have a low–incidence disability in addition to another eligible condition. For example, children who are both blind and autistic typically would be served by their Regional Center.
Some LEAs Serve Some Infants and Toddlers With Other Conditions. The state’s approach for identifying, serving, and funding infants and toddlers with exceptional needs has changed over time. Today, some LEAs provide services to infants and toddlers with exceptional needs who do not have solely low–incidence disabilities. Currently, a total of 97 LEAs provide such services. The state selected these LEAs for historical reasons, and no new LEAs have been allowed to start serving these types of children since 1987, the last time the state expanded the program.
Most LEA Infant and Toddler Services Supported by Unit–Based Funding System Adopted in Early 1980s. As shown in Figure 27, the state provides most funding for LEA infant and toddler programs through the J–50 system, which was originally developed for K–12 special education and then applied to infant and toddler services starting in 1980–81. The state stopped using this system for most special education services in 1998–99 but continues to use it for infants and toddlers. The J–50 system funds LEAs for certain “units” of service, such as service in separate classrooms containing only students with disabilities or service in integrated classrooms containing students both with and without disabilities. For each type of service, LEAs receive a unique per–unit rate based on their average personnel costs in 1980–81 adjusted for cost–of–living increases. Although the state distributes funding based on the number and type of units that LEAs report, these units do not reflect how services are typically provided to infants and toddlers. As a result, LEAs may, for example, provide only home–based services for children even if their unit–based funding assumes they deliver service in a classroom with an instructor and an aide.
Figure 27
LEA Funding for Infants and Toddlers With Exceptional Needs
(Dollars in Millions)
|
2014–15 Actual |
2015–16 Budget Act |
2016–17 Proposed |
Change from 2015–16 |
||
|
Amount |
Percent |
||||
|
Proposition 98 Funds |
|||||
|
J–50 units |
$59 |
$105 |
$75 |
–$30 |
–29% |
|
Infant Discretionary Funda |
2 |
2 |
2 |
— |
— |
|
Subtotals |
($62) |
($107) |
($77) |
(–$30) |
(–28%) |
|
Part C Grant for SELPAsb |
$14 |
$14 |
$14 |
— |
— |
|
Total |
$76 |
$121 |
$91 |
–$30 |
–25% |
|
aProvides additional funding to LEAs that can document extraordinary costs. bReflects portion of federal funding passed through from the Department of Developmental Services to the Department of Education. Total IDEA Part C funding is approximately $50 million. LEA = local education agency and IDEA = Individuals With Disabilities Education Act. |
|||||
SELPAs and LEAs Receive Additional Support Provided From Two Minor Funding Streams. Two additional funding streams supplement the J–50 unit system. One of these is the Part C Grant for SELPAs, which is a $14 million grant intended to cover the cost of providing specific services mandated by federal law. (These services include providing transportation, case management, and services for all infants and toddlers with solely low–incidence disabilities.) The Part C Grant for SELPAs is funded as a portion of a larger federal grant received by DDS. The second funding stream is the Infant Discretionary Fund, which provides $2 million (Proposition 98 General Fund) for supplementary assistance to SELPAs and LEAs who can document extraordinary costs in their infant and toddler program.
Special Education Task Force Recommends Centralizing Program Under Single State Agency. In 2015, a group of special education experts in California (collectively referred to as the Statewide Task Force on Special Education) issued a report recommending policy changes. Among their recommendations was a proposal to centralize administration for the infant and toddler program under a single state agency. The task force concluded that the current diffusion of responsibility for this program between DDS and CDE has resulted in unjustified disparities in funding rates and unequal access to programs in all parts of the state.
2015–16 Budget Included Ongoing Increase of $30 Million for LEA Infant and Toddler Services. The 2015–16 Budget Act included an ongoing augmentation of $30 million for services to infants and toddlers with special needs, an approximately 33 percent increase in state support for the program. These funds were to be allocated to LEAs according to a method determined jointly by the Department of Finance, the California Department of Education, and the Legislative Analyst’s Office. During discussions this fall, the three agencies were unable to agree on a specific method for allocating the funds. As a result, these funds were not spent.
Governor’s Proposal
Governor’s Budget Removes Ongoing Increase for Infants and Toddlers. Because the three agencies were unable to come to an agreement on how to distribute the $30 million, the Governor’s budget removes the ongoing increase for infant and toddler services. Funding for these services would return to approximately the same funding level as in 2014–15, adjusted for changes in enrollment and cost–of–living. (As discussed later in this section, the Governor proposes to provide $30 million in one–time funding for another special education initiative.)
Assessment
Funding Formula Is Based on Inaccurate Assumptions of How Services Are Provided. The J–50 unit system has never reflected how services are provided to infants and toddlers. Federal law requires that these services be provided in a natural setting, such a child’s home, but LEAs are funded for providing education in formal settings such as special day classes. This disconnect between how services are provided and how LEAs are funded has been apparent since the earliest days of the program. In 1985, only four years after the program was created, a statewide survey of LEAs providing infant and toddler services found that 58 percent indicated “the present funding model does not reflect how services are provided.” These LEAs recommended developing a funding model that more accurately reflected the delivery of home– and/or center–based services. More than thirty years have passed, however, and the funding model remains unchanged.
Variation in LEA Rates Results in Large Funding Inequities. In addition to using a model that is not aligned to actual services, the current funding model provides unique per–unit rates to LEAs based on their average personnel costs in 1980–81. (These rates have received the same cost–of–living adjustments as other state education programs, but they have not otherwise been adjusted since 1980–81.) We estimate that the effective rates LEAs receive under the J–50 system range from less than $7,000 to more than $17,000 per child served.
2015–16 Augmentation Provided Substantial Increase to LEAs, No Increase to DDS. The 2015–16 Budget Act increased LEA funding for infants and toddlers by roughly one–third. This augmentation was provided without considering whether funding increases would be more effective in serving infants and toddlers if distributed proportionally to LEAs and DDS Regional Centers, which serve the vast majority of eligible infants and toddlers. (We estimate that, prior to the 2015–16 augmentation, LEAs received more direct state and federal funding per infant/toddler served than Regional Centers.)
Given Major Flaws With Funding Model, Proposal to Remove Ongoing Increase Is Reasonable. Because the funding system is complex, outdated, and unequal, we think the Governor’s proposal to remove the ongoing $30 million increase is reasonable. While increases in funding for infants and toddlers may be warranted, using the existing funding system to allocate a sizeable funding increase would exacerbate existing inequities.
Recommendation
Recommend Comprehensive Restructuring of Program. Given the major flaws with the existing funding model, we recommend the Legislature consider undertaking a comprehensive review of the state’s programs for infants and toddlers with special needs. Such a review could include an analysis of how funding rates vary by LEA, a comparison of LEA rates with DDS rates, a summary of how LEAs and Regional Centers coordinate services, and an analysis of the governance structure of the infant and toddler programs. Such a report would help the Legislature take specific action in the future to address the flaws in the existing system and ensure funding is equitable across the state.
Schoolwide Systems of Support
Below, we provide background on the issue of schoolwide systems of support for struggling students, assess the Governor’s proposal to increase funding for a grant related to these systems, and recommend rejecting this proposal, as we believe the original grant amount is sufficient to realize state goals.
Background
Special Education Task Force Recommends Support for Struggling Students. Last year, the Statewide Special Education Task Force recommended encouraging districts to implement systems of support for students who struggle either academically or behaviorally. These systems would serve as alternatives to identifying struggling students for special education or addressing behavioral issues through disciplinary action. Examples of such systems might include revising instructional practices to make curriculum more accessible to students with diverse learning needs or developing a special curriculum for students with behavioral issues.
2015–16 Budget Allocated $10 Million to Develop Systems of Support for Struggling Students. The 2015–16 budget included $10 million to be awarded to one or two COEs to develop new resources related to these new systems of support. Trailer legislation required the award recipient(s) to identify strategies for implementing these systems, develop materials related to these strategies, and provide technical assistance and professional development to LEAs interested in implementing these systems of support. CDE is currently reviewing grant applications and expects to make an award decision in April 2016.
Governor’s Proposal
Governor’s Budget Proposes $30 Million One–Time Increase for Systems of Support. The administration has indicated that it intends for the majority of the $30 million increase to be passed through to LEAs via a subgrant process administered by the recipient of the original award. These subgrants would help LEAs cover the cost of implementing new strategies.
Assessment
Original Grant Is Sufficient to Realize State Goals. We believe the original grant offers sufficient funding for the recipient to identify effective strategies, develop a repository of related materials, and train a small number of teachers and administrators from across the state who can in turn provide training to their peers. The CDE currently has received applications from 11 COEs, suggesting the $10 million is enough to perform the activities specified in statute.
School Districts Already Have Sufficient Resources to Implement New Systems. We believe the justification for subgrants to help LEAs cover the cost of implementing new instructional and support strategies is weak. School districts have received substantial increases in LCFF funding in recent years, as well as substantial one–time funding to pay down the mandate backlog that can be used for any purposes, including training teachers and school leaders on new systems of student support. We believe such efforts would be best planned and coordinated by local governing boards.
Recommendation
Reject Governor’s Proposal. Because we believe the state’s goals can be realized with the original grant amount, we recommend rejecting the proposed augmentation. This would free up $30 million in Proposition 98 funding that the Legislature could use for other one–time purposes, such as paying down more of the existing mandate block grant.
Back to the TopCounty Offices of Education
The 2016–17 Governor’s Budget provides the state’s 58 COEs with a total of $1 billion in LCFF funds, reflecting a slight increase ($1.8 million) from the revised 2015–16 level. Below, we provide background on the COE funding formula; describe the adjustments the Governor makes to COE funding in 2014–15, 2015–16, and 2016–17; discuss our ongoing concerns about an implementation issue with the COE funding formula; and offer a corresponding recommendation. (For more detail on COE funding, please see our online EdBasics, “How Are County Offices of Education Funded Under the Local Control Funding Formula.”)
Background
State Created New COE Funding Formula in 2013–14. In tandem with implementing the LCFF for school districts, the state also revised its approach to funding COEs. While the allocation formula for districts differs from that for COEs, the state had a similar restructuring goal—to replace an outdated and prescriptive set of revenue limit rules and categorical grants with a more consistent and student–oriented funding approach. The COE LCFF consists of a two–part formula that reflects the two core functions of COEs: (1) ongoing support to the school districts, including review of districts’ budgets and Local Control and Accountability Plans, and (2) operation of COE alternative schools for certain categories of students. Each part of the formula contains specified funding rates for performing the associated functions. Each COE’s target funding level is the sum of the two parts. Like the school district formula, the COE LCFF is funded by a combination of state General Fund and local property tax revenue, with the proportion of each fund source varying by county.
State Included Two “Hold Harmless” Provisions in LCFF Legislation. The legislation creating LCFF (for both school districts and COEs) included two provisions designed to ensure that no LEA experienced a loss in funding as a result of implementing the new formula. The first hold harmless provision ensures that each LEA will continue to get at least as much total funding as it received in 2012–13. Under this provision, each COE receives either its 2012–13 total funding level or its calculated LCFF target funding level, whichever is greater. The second hold harmless provision, known as the “minimum state aid” provision, ensures that each LEA will continue to get at least as much state General Fund as it received in 2012–13 for categorical programs. This means that even in a county where local property tax revenue is sufficient to fund most or all of its LCFF allotment, the state still must provide a specified amount of state aid. Each COE’s minimum state aid entitlement varies based on historical participation in categorical programs, with those that ran more and/or larger programs before LCFF receiving larger amounts of state aid.
Two–Thirds of COEs Funded Above Their LCFF Targets. In 2014–15, the state fully implemented the LCFF for COEs—funding every COE at or above their target level. Because of the two hold harmless provisions, almost two–thirds of COEs are above their target levels. As Figure 28 shows, current funding levels are above LCFF target funding levels in 37 counties, with some COEs’ funding levels notably exceeding their targets. Of these 37 COEs, 16 COEs are above their targets solely due to the first hold harmless provision, 2 are above their targets solely due to the second hold harmless provision, and 19 are above their targets due to a combination of the two provisions.
Figure 28
Almost Two–Thirds of COEs Funded Above Their LCFF Target Levels
2015–16, Based on LAO Estimates
|
Funding Level |
County Office of Education (COE) |
|
|
At LCFF Target (21 COEs) |
Alameda |
San Benito |
|
Alpine |
San Francisco |
|
|
Colusa |
Shasta |
|
|
El Dorado |
Sierra |
|
|
Humboldt |
Siskiyou |
|
|
Kern |
Trinity |
|
|
Kings |
Tulare |
|
|
Madera |
Tuolumne |
|
|
Modoc |
Yolo |
|
|
Nevada |
Yuba |
|
|
Orange |
||
|
101 Percent to 125 Percent Above LCFF Target (11 COEs) |
Butte |
San Bernardino |
|
Calaveras |
San Joaquin |
|
|
Imperial |
San Luis Obispo |
|
|
Lassen |
Solano |
|
|
Merced |
Tehama |
|
|
Monterey |
||
|
126 Percent to 150 Percent Above LCFF Target (11 COEs) |
Amador |
Placer |
|
Contra Costa |
Sacramento |
|
|
Fresno |
Santa Cruz |
|
|
Lake |
Sonoma |
|
|
Los Angeles |
Ventura |
|
|
Mariposa |
||
|
151 Percent to 200 Percent Above LCFF Target (11 COEs) |
Del Norte |
San Diego |
|
Glenn |
Santa Barbara |
|
|
Marin |
Santa Clara |
|
|
Mendocino |
Stanislaus |
|
|
Napa |
Sutter |
|
|
Plumas |
||
|
201 Percent to 260 Percent Above LCFF Target (4 COEs) |
Inyo |
Riverside |
|
Mono |
San Mateo |
|
|
LCFF = Local Control Funding Formula. |
||
Governor’s Proposal
Finalizes 2014–15 LCFF Allotments. Based on final data, the Governor makes two notable adjustments to prior–year COE LCFF funding, resulting in a net reduction of $33 million. The first adjustment is a decrease of $43 million due to the actual amount of 2014–15 base COE funding upon which LCFF targets and hold harmless amounts are calculated being lower than the administration originally estimated. The second adjustment is an increase of $10 million due to higher minimum state aid costs than the administration originally estimated.
Makes Corresponding Downward Adjustment to 2015–16 Funding Level. The Governor’s budget makes two notable adjustments to current–year COE LCFF funding, resulting in a net reduction of $35 million compared to the 2015–16 Budget Act. The bulk of the change is due to carrying forward the adjustments from the prior year, with a slight additional drop primarily due to lower attendance than the administration estimated.
Proposes Nearly Flat Funding for 2016–17. The Governor proposes to increase COE LCFF funding in 2016–17 by $1.8 million (0.2 percent) over the revised 2015–16 level. This slight increase is due to some COEs receiving a 0.47 percent COLA. We estimate 23 COEs would receive the COLA, with the remaining 35 COEs already at funding levels in excess of their COLA–adjusted LCFF targets.
Assessment
Revisiting Rationale for First COE LCFF Hold Harmless Provision. The two hold harmless provisions departed from the essence of the new LCFF formula (that is, linking funding to students and providing the same funding rates statewide), but we believe the first hold harmless provision was a reasonable measure to help some COEs transition to the new funding system. Specifically, the first provision ensuring that a COE received no less than its total 2012–13 funding level meant that the COE could maintain its existing programmatic level moving forward. Though the affected COEs were ones with historically high revenue limit rates, categorical funding rates, or both, we understand the desire of the Legislature to minimize disruption during the transition to the new funding formula. Moreover, the benefit of this hold harmless provision was designed to lessen over time and eventually go away. As the state implemented LCFF and funding levels were raised for COEs with historically lower rates, these latter COEs would catch up and eventually receive the same per–student rates as their historically higher funded peers.
Fundamental Design Flaw in Second Hold Harmless Provision. The second hold harmless provision went further by ensuring no loss of state aid for COEs. Under this provision, several COEs will increasingly benefit from their large former state categorical aid allocations. We believe locking in their state categorical aid permanently is completely counter to trying to eliminate historical differences in state categorical aid. Furthermore, unlike the first hold harmless provision, the second hold harmless provision is not easing transition to the new system. To the contrary, some historically high–funded COEs are now benefiting two–fold—from solid growth in local property tax revenue and having state aid provided on top of their local property tax allotment.
Second “Hold Harmless” Provision Generating New Funding Differences Among COEs. The second LCFF hold harmless provision is creating big COE differences. Figure 29 illustrates what is happening. As local property tax revenue grows in a county over time, the minimum state aid allotment for that COE becomes a new bonus in base funding on top of the their LCFF level. By 2019–20, we estimate 27 COEs will be receiving all or part of their minimum state aid allotments in excess of the LCFF level. That is, rather than moving all COEs toward their student–oriented, cost–driven LCFF levels, some COEs will be moving further and further away from their LCFF levels.
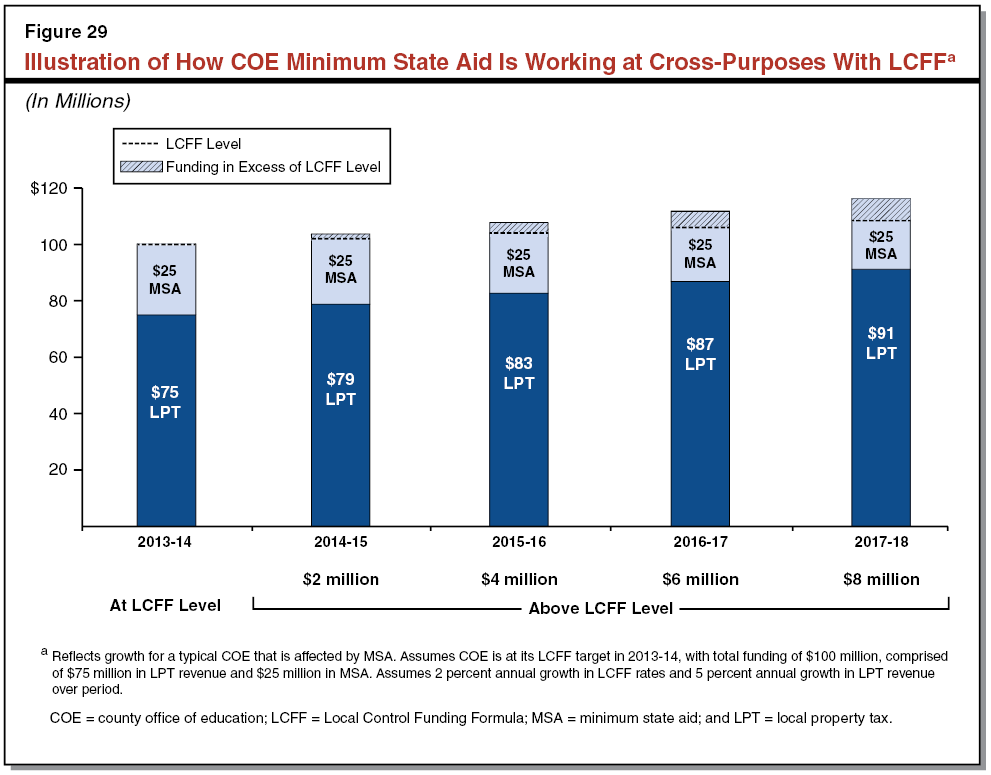
Cost of “Hold Harmless” Provision Steadily Increasing. Providing the minimum state aid supplement on top of COEs’ base LCFF funding increases the amount the state must dedicate towards the COE LCFF. As Figure 30 shows, we project these costs will continue to grow in the coming years as local property tax revenue increases. (All else constant, increases in local property tax revenue normally reduce state General Fund costs.) We estimate the cost of the minimum state aid provision will increase from $30 million in 2013–14 to $115 million in 2019–20.
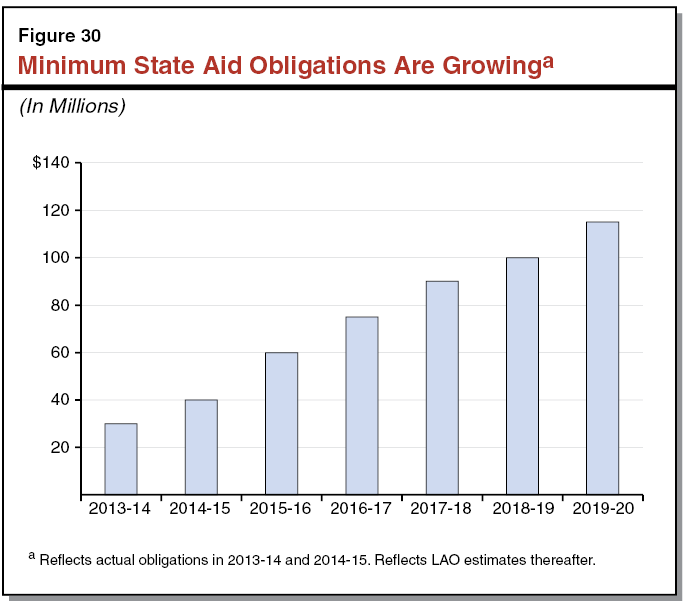
Administration Underestimates Cost. The Governor’s budget underestimates the cost of minimum state aid provision for COEs. Providing 14 COEs minimum state aid supplements cost $40 million in 2014–15. The Governor estimates these costs will continue at the same level in 2015–16 and 2016–17. Our analysis of local property tax growth, however, projects notably higher costs. In 2015–16, we estimate 21 COEs will receive a partial or full minimum state aid supplement, costing around $60 million ($20 million above the Governor’s estimates). In 2016–17, we estimate 22 COEs will receive the supplement at a cost of around $75 million ($35 million above the Governor’s estimates).
Recommendation
Repeal Minimum State Aid Provision for COEs. We recommend the Legislature repeal the minimum state aid provision for COEs. Every COE still would be held harmless relative to its 2012–13 level, ensuring a smooth transition during LCFF implementation without creating any new funding inequities among COEs. We recommend the Legislature act immediately because the cost of the minimum state aid provision is growing quickly and significantly. We also recommend the Legislature act immediately before the minimum state aid supplement becomes more deeply imbedded as a COE funding expectation. This recommendation saves the Legislature tens of millions of dollars every year moving forward.
Back to the TopHigh Speed Network
In this section, we provide background on the K–12 High Speed Network (HSN), describe and assess the Governor’s HSN proposal, and offer associated recommendations.
Background
State Created HSN to Connect COEs to an Internet Backbone. In the early 2000s, the state decided to link COEs to a high speed Internet network, or “backbone,” servicing mostly educational institutions. Years earlier, the University of California and private research universities had formed a joint nonprofit organization called the Corporation for Education Network Initiatives in California (CENIC) to build and maintain this backbone. Beginning in the early 2000s, the state decided to pay for Internet connections from the backbone to all COEs. The state named the connections among the 58 COEs the “K–12 High Speed Network,” or HSN. School district offices and schools then were encouraged to connect to the HSN via their COE network “hubs.” (The California State University, community colleges, and local libraries also are joined to the backbone.)
HSN Intended to Have Several Benefits. The state pays for HSN to lower the cost of Internet connections for COEs and participating schools and improve their Internet service. The HSN lowers the cost of Internet for COEs and schools because (1) the state pays for the portion of their Internet connection that runs through HSN and the backbone, (2) CENIC is supposed to charge lower rates for these connections than for–profit Internet companies, and (3) CENIC applies for state and federal Internet subsidies that COEs and schools might not apply for on their own. The HSN is supposed to improve Internet service for COEs and schools because it can access CENIC’s customer service.
State Authorized a Grantee to Help Coordinate HSN–Related Activities. Upon establishing the COE network, state law required CDE to select a grantee to coordinate COE connections to the HSN. The department was to select the grantee using a competitive selection process. The department selected the Imperial COE as the grantee in 2004 and this COE has served in this role since that time. Originally, the HSN grantee’s primary activities included (1) encouraging COEs and schools to connect to HSN and (2) working with CENIC to connect them. The HSN grantee’s primary activities since that time include (1) overseeing contracts with CENIC to manage the COEs’ connections and claim state and federal Internet subsidies on their behalf, (2) planning and communicating with COEs about Internet upgrades and other requirements for their sites, and (3) coordinating other contracts and serving as a point of contact for COEs’ and schools’ HSN and Internet–related needs. Most recently, the state has charged the HSN grantee with implementing two new initiatives—the Broadband Infrastructure Improvement Grant (BIIG) program and the Technical Assistance and Professional Development Initiative.
HSN Grantee Has Three Main Types of Expenditures. As shown in the top part of Figure 31, the HSN grantee primarily incurs costs for (1) CENIC’s services, (2) salaries and benefits for the HSN grantee’s employees, and (3) equipment purchases. In addition, the HSN grantee has various other types of expenditures, including travel and contracts with entities other than CENIC.
Figure 31
HSN Grantee Budget Summary
(In Millions)
|
2013–14 Actual |
2014–15 Actual |
2015–16 Estimated |
2016–17 Proposed |
|
|
Expenditures |
||||
|
CENIC services |
||||
|
COE connections to backbone |
$5.8 |
$7.1 |
$7.4a |
$7.8a |
|
Backbone |
4.8 |
4.8 |
4.8 |
4.8 |
|
Otherb |
0.7 |
1.0 |
1.0 |
0.8 |
|
Subtotal |
($11.3) |
($12.9) |
($13.2) |
($13.4) |
|
Salaries and benefits |
$1.3 |
$1.4 |
$1.5 |
$1.6 |
|
Equipment |
2.6 |
0.2c |
1.0c |
0.5c |
|
Otherd |
1.1 |
1.7 |
1.9 |
1.6 |
|
Totals |
$16.2 |
$16.1 |
$17.6 |
$17.1 |
|
Revenues |
||||
|
General Fund (Proposition 98) |
$8.3 |
$8.3 |
—e |
$8.0 |
|
E–Rate |
4.0 |
4.7 |
$5.0 |
5.2 |
|
CTF |
3.2 |
3.4 |
3.4 |
3.5 |
|
Other |
0.1 |
0.1 |
8.3f |
0.4f |
|
Totals |
$15.6 |
$16.5 |
$16.7 |
$17.1g |
|
aHSN assumes COE connection costs increase 5 percent in 2015–16 and 2016–17 (based on historical trends from 2010–11 to 2014–15). bIncludes E–Rate management and other services. cSet aside for future expenditures. dIncludes travel, indirect costs, administrative expenses, and contracts with entities other than CENIC. eHSN was authorized to use up to $8.3 million of its reserve in lieu of state General Fund. fReflects draw down of reserve. gThe Governor’s budget includes an additional $2.2 million in expenditure authority for any “unanticipated cost or emergency.” HSN = High Speed Network; CENIC = Corporation for Education Network Initiatives in California; COE = county office of education; and CTF = California Teleconnect Fund. |
||||
HSN Grantee Receives Revenue From Three Main Sources. As shown in the bottom part of Figure 31, the HSN grantee receives nearly all of its revenue from Proposition 98 General Fund and two Internet subsidy programs. The General Fund provided to the grantee by CDE typically comprises about half of its total revenue. The remaining revenue primarily comes from E–Rate and the California Teleconnect Fund (CTF). E–Rate is a federal telecommunications subsidy that provides reimbursements of up to 90 percent for Internet service. The CTF is a state special fund that provides reimbursements of 50 percent for Internet service, after all E–Rate discounts are applied. Both subsidies are funded by telecommunication user surcharges.
State Suspended General Fund Appropriation in 2015–16. As shown in Figure 32, the HSN grantee has a reserve that grew steadily—reaching nearly $15 million in 2014–15. Growth in the reserve level was caused by a steady reduction in the HSN grantee’s expenditures and an increase in CTF revenue, without a corresponding reduction in the state grant amount. In 2015–16, the state suspended the HSN grantee’s General Fund appropriation in recognition of this large reserve. While this suspension forced the HSN grantee to spend down some of its reserve, it still expects to end 2015–16 with a $9.2 million reserve that it would carry forward into 2016–17.
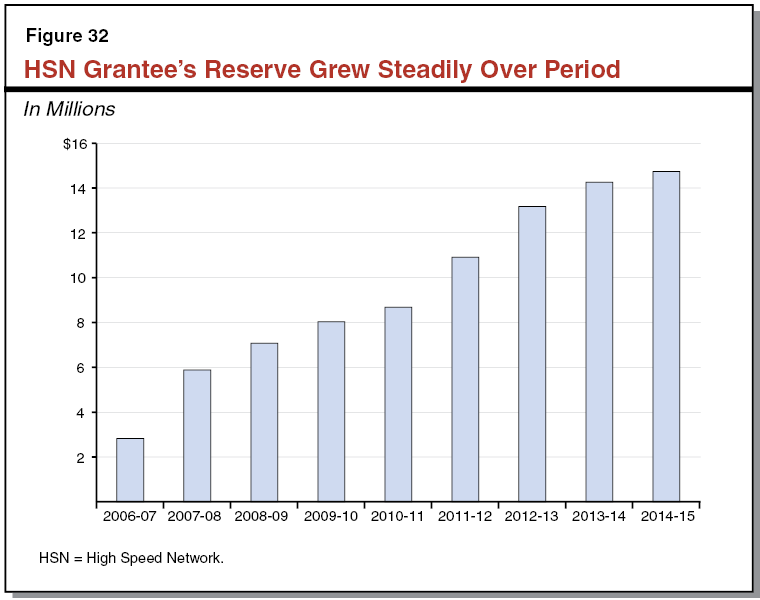
Governor’s Proposal
Governor Authorizes $19.3 Million for HSN Grantee’s Expenditures in 2016–17. As shown in the rightmost column of Figure 31, the HSN grantee indicates that in 2016–17 it will spend (1) $13.4 million on CENIC services, (2) $1.6 million on salaries and benefits, (3) $500,000 to add to its equipment replacement reserve, and (4) $1.6 million on other expenses. This would result in $17.1 million in total expenditures and leave the grantee with $2.2 million in remaining expenditure authority. The administration indicates the HSN grantee could use the excess authority to pay for any “unanticipated cost or emergency.”
Governor Assumes $17.1 Million for HSN Grantee’s Revenues in 2016–17. The rightmost column of Figure 31 also shows the HSN grantee’s revenue streams in 2016–17. The Governor (1) proposes $8 million from Proposition 98 General Fund ($4.5 million in 2016–17 funding and $3.5 million in 2015–16 funding), (2) assumes $5.2 million from E–Rate subsidies, (3) assumes $3.5 million from CTF subsidies, and (4) draws down $383,000 from the HSN grantee’s reserve.
Assessment
Governor’s Proposal Raises Two Main Concerns. First, the proposal allows the HSN grantee to continue to carry a large reserve without adequate justification. Second, the proposal does not provide a plan for “right sizing” the HSN grant but instead simply reinstates an amount similar to the grant’s historical General Fund appropriation. We provide more detail on these concerns below. We have additional concerns with the administration’s lack of a proposal for the HSN grantee’s anticipated cost increases for administering the new BIIG program, which we address in the nearby box.
Administrative Costs for Internet Grant Program
State Established Grant Program to Help Schools Upgrade Internet Infrastructure for Online Testing. The state recently created the Broadband Infrastructure Improvement Grant (BIIG) program to help schools increase their Internet speeds to those required to administer new online assessments. The 2014–15 budget included $26.7 million for an initial round of grants, and the 2015–16 budget provided an additional $50 million for a second round of grants. The budget tasks the High Speed Network (HSN) grantee, in consultation with the California Department of Education and the State Board of Education, with distributing funds to schools and supporting network connectivity. The budget also tasks the HSN grantee with submitting reports to the state about schools’ Internet connections and how the grants were awarded.
HSN Grantee Has Spent $1.4 Million to Date to Administer Initial Round of Grants. The HSN grantee has spent $830,000 for its staff to administer the grant selection process, oversee an external contractor, and directly prepare parts of the required reports. It has spent $600,000 for the external contractor to manage the bulk of the project and prepare significant portions of the required reports. The HSN grantee has paid for these administrative expenditures from its reserve. To date, the HSN grantee indicates that it has awarded $17 million of the $26.7 million available for the initial round of grants.
HSN Grantee Expects Administrative Costs to Increase for Round Two. Though HSN indicates its administrative costs for the second round will be higher than its first–round costs, neither it nor the administration has identified how much more. The 2015–16 budget allows the HSN grantee to spend a portion of the $50 million provided for the program for only certain administrative costs, specifically those associated with reporting requirements.
Recommend Requesting Administration Submit an Expenditure Proposal. We recommend the Legislature ask the administration to submit a proposal as part of the May Revision that identifies (1) the administrative costs associated with the second round of BIIG and (2) proposed fund sources. Similar to a budget change proposal, we recommend the proposal include detailed information on the specific administrative activities entailed, the costs to conduct these activities, and feasible alternatives. With this information, the Legislature would be able to make an informed decision about the expected administrative costs and adjust the HSN grantee’s operating budget accordingly.
Governor’s Proposal Would Leave HSN Grantee With Sizeable Reserve. The reserve would total $8.8 million at the end of 2016–17—an amount larger than the Governor’s proposed General Fund appropriation of $8 million. The HSN grantee has indicated it would like to keep a $7.8 million reserve should the federal government not provide E–Rate subsidies, pay them later than usual, or reclaim formerly disbursed E–Rate subsidies. The HSN grantee has indicated the reserve also could help guard against other unidentified fiscal uncertainties. On top of the $7.8 million, the HSN grantee would like to set aside $1 million for future equipment replacement.
No Major Fluctuations in Annual E–Rate Reimbursements to Justify Such a Large Reserve. On an operating budget of $17.1 million, the HSN grantee would like to reserve $7.8 million (45 percent of annual operating expenses) for uncertainties, particularly uncertainties relating to E–Rate subsidies. The HSN grantee has indicated that the chance of the federal government canceling its E–Rate reimbursements is unlikely and has never before happened. Moreover, the HSN grantee in recent years consistently has received reimbursements from E–Rate that have covered around 70 percent of HSN’s annual Internet service costs, with only minor fluctuations of a few percentage points from year to year. The HSN grantee has managed these minor fluctuations during this time, all the while increasing its reserve. For 2016–17, the HSN grantee projects it will receive reimbursements to cover 67 percent of associated costs—the same percent as in 2014–15 and 2015–16.
Uncommon to Ask Grantee to Save on State’s Behalf. Though saving annually for major equipment replacements is prudent fiscal practice, we are concerned about a grantee creating its own reserve for such a purpose. Rather than allowing the HSN grantee to earmark part of its funding for equipment replacement, the state could earmark funding directly and then authorize the replacement, as scheduled. Given the HSN grant is an annual grant and CDE could rebid the contract any given year depending upon the HSN grantee’s performance, we believe a state earmark for equipment is more appropriate. The state effectively took this approach with HSN’s first equipment replacement, providing funding to the HSN grantee in the year the replacement was needed.
Administrative Costs for HSN Grant Higher Than Similar Grants. The California State Library and the CCC Chancellor’s Office award grants to certain agencies to perform duties similar to those required of the HSN grantee. Administrative costs for these grantees, however, are lower than the $1.5 million spent by the HSN grantee. The California State Library has a $225,000 contract with a nonprofit organization called Califa to reach out to local libraries to get them to connect to the CENIC backbone, coordinate with CENIC, and represent public libraries on the CENIC board of directors. The Chancellor’s Office has a $105,000 contract with Butte Community College to serve as its administrative agent for CENIC activities and participate in CENIC’s governance structure. Though some differences exist between the three entities’ responsibilities, their core responsibility of acting as the liaison between their segment and CENIC is the same.
HSN Grantee’s Staffing Costs Have Grown Considerably Over Time. Although the state has given the HSN grantee a few new activities since its creation in 2004, its staffing costs have grown almost every year during that time, as shown in Figure 33. At some points, growth has been particularly significant. For example, between 2004–05 to 2007–08, the HSN grantee’s personnel costs quadrupled, and, between 2007–08 and 2011–12, the grantee’s personnel costs doubled. Moreover, growth in the HSN grantee’s staff understates its overall administrative growth because the grantee has contracted out many new and ongoing activities to other entities. For instance, the HSN grantee contracted with Butte COE for work on the My Digital Chalkboard website (formerly called Brokers of Expertise).
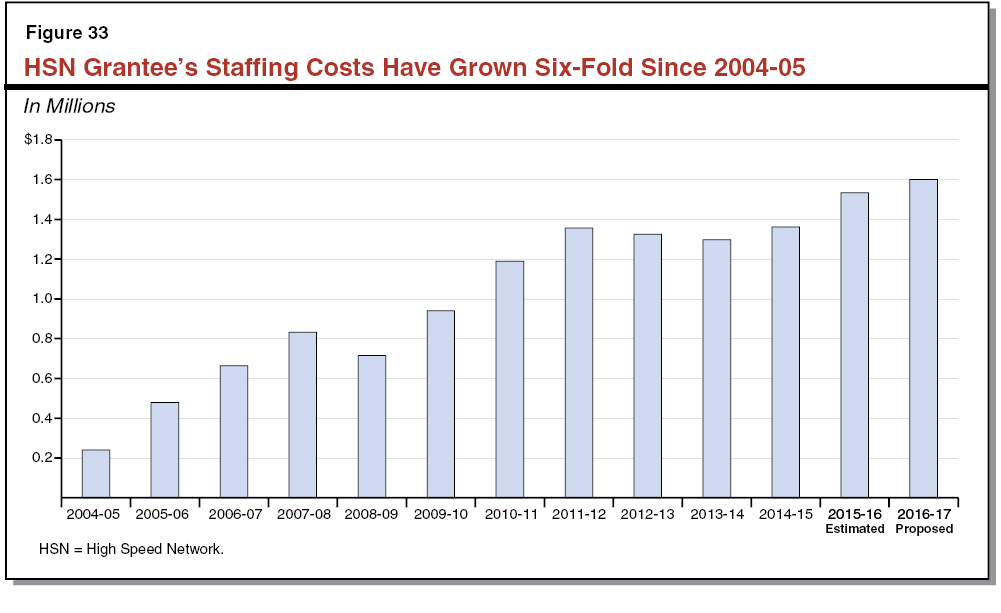
Recommendations
Reject Governor’s Proposed $8 Million Appropriation for HSN in 2016–17. We recommend the Legislature provide no General Fund appropriation in 2016–17 to the HSN grantee and instead authorize it to spend down $7.8 million of the $9.2 million reserve it expects to have remaining at the end of 2015–16. Under this approach, the HSN grantee still would be left with a $1.4 million reserve at the end of 2016–17—more than enough to weather any minor fluctuations in its expenditures and revenue. This recommendation would free up the Governor’s proposed $8 million in General Fund for other Proposition 98 priorities.
Ask CDE to Report on HSN Grant at Spring Budget Hearings. We recommend the Legislature ask CDE to provide testimony at spring budget hearings to help it determine the appropriate size of the HSN grant. Specifically, we recommend the Legislature ask CDE to explain how it reviews and assesses the HSN grantee’s performance and how this has affected decisions to renew or rebid the grant each year. We recommend the Legislature also ask CDE to explain why its grantee’s administrative costs have increased considerably over the last decade and why these administrative costs are larger than the administrative costs for similar grants administered by the California State Library and the CCC Chancellor’s Office. The Legislature could use the information CDE provides to determine whether to adjust the HSN grant objectives and grant amount to be more consistent with the expectations and funding levels of the library and community college equivalents. (Alternatively, the Legislature could use the information to upsize the amounts provided to the libraries and community colleges for their comparable services.) If the Legislature ultimately is not satisfied with the information provided, it could adopt supplemental report language directing CDE to evaluate more formally the performance and cost–effectiveness of the HSN grantee. If the Legislature takes this approach, we recommend it require CDE submit the report in fall 2016 so the Governor and Legislature can consider its findings before the release of the Governor’s 2017–18 budget proposal.
Back to the TopTeacher Workforce Trends
In this section, we begin with a review of recent demand, supply, and turnover trends in the statewide market for teachers in California. We then examine the evidence for shortages in specific areas of the teacher workforce, identify and assess past policy responses to these shortages, and raise some issues for the Legislature to consider when thinking about potentially new policy responses.
Statewide Market for Teachers
The Statewide Market for Teachers Is Driven by Several Important Factors. The statewide market for teachers is affected by demand, supply, and turnover. The demand for teachers is largely driven by changes in the level of state funding, as school districts typically use the bulk of state funding increases for some combination of hiring additional teachers and increasing teacher salaries. Demand also is influenced by class size preferences, as class size reduction policies require additional teachers to staff smaller classes. The supply of teachers is driven by multiple factors, including prospective teachers’ perceptions regarding the availability of jobs, the rate at which California can produce newly credentialed teachers, and districts’ ability to recruit teachers from out of state and attract former teachers back into the profession. The rate at which teachers leave the profession also affects the statewide market, as teachers who voluntarily leave the profession for both non–retirement and retirement reasons must be replaced by new teachers.
Discussion Often Overly Simplified to Focus Only on Supply of New Teachers. Though several factors affect the teacher workforce, sometimes discussions narrowly focus only on the mismatch between the statewide number of newly credentialed teachers and statewide projected hires. As shown in Figure 34, California has had long periods in which the number of new teacher credentials outpaces projected hires and vice versa. For example, from the 2002–03 school year to the 2013–14 school year, California produced thousands more teachers than its schools could hire. This market trend changed in 2013–14, as the number of projected hires began to outpace the number of new credentials issued, and has continued through 2014–15. These trends indicate that these two factors tend to follow cyclical patterns, with mismatches tending to correct themselves gradually over time. These trends, however, do not capture all the other important aspects of teacher demand, supply, and turnover.
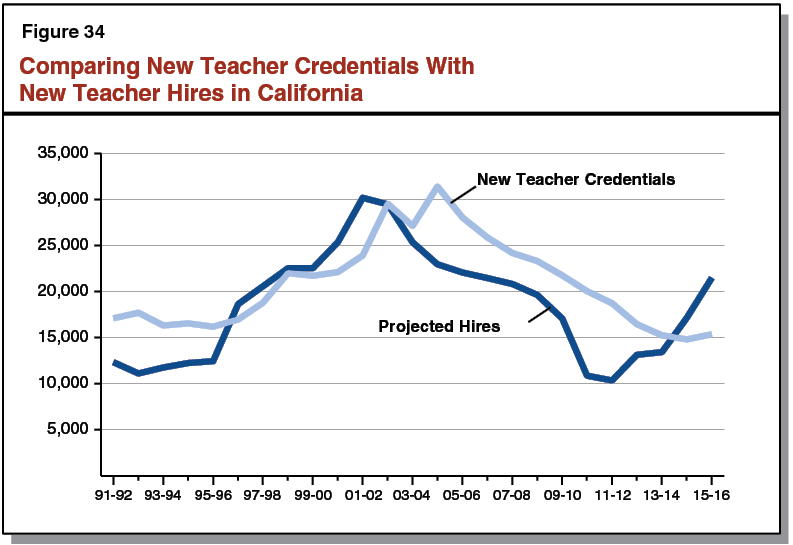
Demand Trends
Demand for New Teachers Fluctuates With Changes in School Funding. Year–over–year changes in the Proposition 98 minimum guarantee are highly correlated with changes in projected teacher hires. Since 1989–90, about 70 percent of the time the guarantee increased, projected hires increased too. About 80 percent of the time the guarantee decreased, projected hires decreased too. As the minimum guarantee is tied to state revenues, it fluctuates notably over time, suggesting that demand for teachers also will fluctuate notably over time. With the increase in the guarantee in recent years, the number of projected hires in 2015–16 (21,483 hires) is nearly double the number of projected hires in 2011–12 (10,361 hires).
State and Local Policies Also Influence Teacher Demand. Policies that aim to reduce student–teacher ratios create incentives for districts to hire more teachers. For example, over the period of 1995–96 to 2001–02, the annual number of projected hires more than doubled, largely driven by class size reduction goals. More recently, over the past few years, the Local Control Funding Formula has been offering fiscal incentives to reduce K–3 class size to 24 students. In recent years, class sizes have been declining, which has caused statewide demand for teachers to increase by an estimated 11,300 teachers. Such policies illustrate how decisions regarding class sizes can interact with other market forces to exacerbate teacher shortages (or potentially eliminate them).
Supply Trends
Supply of Teachers Rebounding After Decreasing During the Recession. The total nationwide stock of teachers was 3.5 percent smaller in 2012–13 compared to 2008–09, while the stock in California was 7 percent smaller. As shown in Figure 35, the number of teachers enrolled in teacher preparation programs declined by 30 percent nationwide and 56 percent in California within this same time frame. Declines in the number of new credentials issued tracked with decreases in teacher preparation enrollment. Declines in the supply of teachers, in turn, tracked declines in the number of jobs available, which decreased by 33 percent in California over this time period. (The larger drops in California compared to the nation likely reflect the greater volatility of California’s tax revenues. This volatility tends to result in California being affected more adversely during recessions and more advantageously during recoveries.) Recent data show a change in supply trends, with the number of new credentials issued in California increasing modestly (4 percent) from 2013–14 to 2014–15. Officials from two of the state’s largest credentialing programs, the California State University and National University, also cite increases in their credentialing program enrollment within the past year and believe higher enrollment is likely to continue at least in the short–term.
Figure 35
Traditional Teacher Supply Pipeline Declined During Recession
|
2008–09 |
2012–13 |
Percent Change |
|
|
California |
|||
|
New credentials issued |
17,407 |
11,080 |
–36% |
|
Teacher preparation enrollment |
44,692 |
19,854 |
–56 |
|
United States |
|||
|
New credentials issued |
232,707 |
192,459 |
–17 |
|
Teacher preparation enrollment |
719,081 |
499,800 |
–30 |
Many Credentialed Teachers Are Not Teaching, Though Some Are Likely to Re–Enter Profession in the Future. We estimate that more than 10,000 teachers in California have active credentials but are not currently teaching. Some of these individuals might not have been able to find jobs during the recession. Some of these teachers, however, are likely to enter or return to the profession in the future. A nationwide longitudinal study by the National Center for Education Statistics found that of those teachers who began teaching in 2007–08 and left the profession within their first five years, 58 percent had either returned or expected to return to teaching in the future. Other nationwide studies have shown that over one–quarter of all teachers hired in a given year have taught at some point in the past.
California Recruits a Significant Share of Teachers From Other States. From 1990–91 to 2014–15, 18 percent of California’s new teaching credentials were issued to those prepared in out–of–state programs. This share has fluctuated significantly over time—from a low of 11 percent in 2003–04 to a high of 33 percent in 1990–91. Out–of–state prepared candidates accounted for nearly 25 percent (3,700) of credentials issued in 2014–15.
Turnover Trends
Reducing Turnover Can Reduce Workforce Pressures. Those who leave their jobs are typically divided into two categories: (1) movers (those who switch to a new teaching job) and (2) leavers (those who leave the profession for retirement or non–retirement reasons). Keeping teachers in their classrooms reduces statewide demand for teachers, which, in turn, reduces district costs to hire and train replacement teachers. (Multiple studies estimate these hiring and training costs to be over $15,000 per teacher.)
Nationwide, About 15 percent of Teachers Vacate Their Jobs Each Year. Based on data, about half of teachers who vacated their jobs in 2011–12 moved to a new school, whereas half left the profession. Of the movers, nearly 40 percent switched to a new public school district, requiring districts to recruit replacement teachers. Of the leavers, nearly 30 remained in education, entering into positions such as teaching coaches or administrators. Teachers most likely to vacate their current teaching jobs include those teaching in city–center schools, schools with a high percentage of low–income students, younger teachers, teachers with less tenure, and special education teachers. Factors associated with teachers vacating their current jobs include lack of support by administrators and parents, lack of control over their work, a high prevalence of student misbehavior or tardiness, and lack of access to a teacher induction program.
Data Indicate No Large Wave of Retirements in the Near Future. Although retirements can create staffing pressures, data suggest that California is not facing an imminent wave of retirements in the near future. A recent study by the Learning Policy Institute found that while California was facing a surge of retirement–eligible teachers in 2006–07, these individuals have since exited the profession, with many districts offering early retirement programs during the recession to avoid layoffs. Looking out a few decades, retirements rates in California likely will experience some ebb and flow. In many cases, the causes of these fluctuations will have been rooted in developments, such as hiring surges due to demographic changes or class size reduction policies, that occurred 25 to 30 years earlier.
Teacher Shortages in Certain Areas
Statewide Teacher Market Appears in Process of Correcting Itself . . . While the number of projected hires statewide in 2015–16 exceeded the number of new credentials issued by roughly 6,000, we think this gap will begin closing over the next few years. Several factors likely will be at work, including a continued increase in teacher preparation enrollment, districts tapping the large supply of potential re–entry teachers, districts increasing their out–of–state recruitment efforts, and districts already having reached their class size reduction goals. These developments suggest the statewide challenge in filling job openings will decrease without direct state action. (Some districts, however, might continue to face localized challenges in filling particular job openings.)
. . . But Longstanding Shortages Exist in Certain Subject Areas and Types of Schools. Although current data suggest the overall teacher market in California is beginning to correct itself, research over many years has found substantial evidence of specific market shortages. The California Department of Education has identified shortages of special education, science, and math nearly every year since 1990–91. (The US Department of Education requires states to report shortages using a federal methodology based largely on the number of vacant positions, missassigned teachers, and teachers on temporary teaching permits.) Such staffing difficulties are consistent with nationwide trends. Though data show persistent, pervasive shortages in all of these areas, the causes and severity of these shortage areas vary by subject, as discussed below.
Special Education Commonly Viewed as Most Acute Shortage Issue. Research has found that special education teachers tend to have higher rates of turnover and these positions tend to take longer to fill than general education positions. Research attributes higher rates of turnover to the additional stress factors faced by special education teachers, such as the increased risk of lawsuits and the large amounts of paperwork associated with each student’s Individualized Education Program (a federal requirement). As one means of addressing these staffing difficulties, districts often hire teachers with internship credentials. Approximately 50 percent of special education credentials issued in California in 2013–14 were internship credentials, compared with 17 percent of single–subject credentials. Within the field of special education, shortages are more acute in certain subareas. For example, four counties currently lack any psychologists and two counties lack any speech/language specialists.
Science and Math Shortages Linked to a Lack of Individuals in the Pipeline. Researchers attribute the nationwide challenge of staffing science and math teachers to a shortage of undergraduates in science, technology, engineering, and math (STEM) majors and the high salaries that these graduates can receive in other professions. In 2014–15, the California State University issued STEM degrees to 13 percent of its graduates. The limited stock of STEM graduates must then choose between careers in teaching and other STEM professions, which can be far more lucrative. The nationwide average salary of STEM occupations is about $90,000, while the nationwide average teacher salary is $58,000 (a 55 percent difference).
Staffing Difficulties More Prevalent in City–Center and Low–Income Schools. Nationwide, teacher turnover tends to be greater in city–center schools (18 percent in 2011–12) and schools with high rates of poverty (22 percent in 2011–12). (For this measure, high poverty is defined as schools where at least 75 percent of students are eligible for free or reduced–price meals.) In California, higher turnover also is reported in these types of schools. On average, staffing vacancies in these types of schools require more time to fill than those in the suburbs or those with lower rates of poverty. To meet immediate staffing needs, city–center and high–poverty schools are more likely to be staffed by underprepared teachers, a further sign of staffing difficulties. In California, the recently enacted Local Control Funding Formula yields higher funding levels for these schools in recognition of their additional challenges and higher costs.
Staffing Difficulties in Rural Schools Are More Nuanced. Rural schools experience different staffing pressures depending on their location and population base. Staffing is most difficult for those rural schools with a declining population base. While administrators suggest that teachers recruited to this type of rural school are unlikely to leave, attracting candidates can be difficult, especially as their small population bases make recruiting locally difficult. Rural schools close to large population centers with a postsecondary school may find attracting new teachers easier than more isolated rural schools, but also experience higher rates of turnover as teachers often leave for urban districts offering higher pay.
Policy Responses
All Levels of Government Have Created Policies to Address Past Teacher Shortages. Similar to private employers, school districts often adapt to changing market conditions by embarking on more aggressive recruitment efforts and offering more attractive compensation packages, such as signing bonuses. In addition to local policies, the state and federal governments have adopted many programs over the years to help improve the teacher workforce. Figure 36 groups all of these policy responses into eight broad categories. Below, we highlight key aspects of each category.
Figure 36
Summary of Policies Designed to Address Teacher Shortages
|
Policy Category |
Overriding Goal of Policy |
Specific Programs |
|
More Flexible Credential Requirements |
Increase the supply of teachers. |
(1) Programs that allow individuals to test or waive out of requirements. (2) Reductions in number or types of requirements. |
|
More Accessible Credentialing Programs |
Increase the supply of teachers. |
(1) Online programs (CalState TEACH). (2) Internship programs. (3) Programs that begin throughout the year. |
|
Recruitment, Advertising, and Outreach |
Increase the supply of teachers. |
(1) Out–of–state recruitment (by districts). (2) CalTeach recruitment centers. (3) Recruit high schoolers (CSU partnerships). (4) Recruit college students to become STEM teachers (UC). (5) Credential reciprocity with other states. |
|
Support Programs |
Reduce turnover and improve quality. |
(1) Beginning Teacher Support and Assessment (BTSA). (2) New teacher induction programs. (3) Peer Assessment and Review Program (PAR). (4) Ongoing professional development. (5) Additional prep periods for certain teachers. |
|
Ongoing Salary Increases |
Increase the supply of teachers, reduce turnover, and improve quality. |
(1) Locally bargained salary increases. (2) Differentiated pay by subject. |
|
Salary Bonuses |
Attract people to teach in longstanding shortage areas and improve quality. |
(1) Bonuses for specific subjects. (2) Bonuses for dual–credential holders to teach specific subjects. (3) Bonuses to teach in hard–to–staff schools. (4) Return–to–workforce bonuses for retired teachers. |
|
Housing Subsidies |
Increase the supply of teachers. |
(1) Subsidized mortgages. (2) Extra–Credit Teacher Home Purchase Program. (3) Rent–controlled units (provided by districts). |
|
Financial Aid for Becoming/Working as a Teacher |
Increase the supply of teachers and attract people to teach in longstanding shortage areas. |
(1) Assumption Program of Loans for Education (APLE). (2) Governor’s Teaching Fellowship Program. (3) Cal Grant T. (4) Federal Teacher Loan Forgiveness Program. (5) Teacher cancellation of federal Perkins loans. |
Eight Categories of Policies
More Flexible Credential Requirements. More flexible credentialing requirements, such as being able to test out of a requirement or use work experience to fulfill a requirement, increase the supply of teachers by reducing the barriers to entry into the profession, such that more individuals are eligible to teach. Experts sometimes cite concerns, however, with reductions in standards due to potential negative consequences that these may have on student learning.
More Accessible Credentialing Programs. The goal of these programs is to increase the supply of teachers by improving the accessibility of the profession to those whose life circumstances would otherwise preclude them from enrolling in a credentialing program. Key examples of these programs include Cal State TEACH (an online California State University credentialing program for those who wish to become elementary school teachers), internship programs (which allow individuals to be teachers of record while simultaneously enrolled in credentialing programs), and programs that operate throughout the year (such as CSU’s recent efforts to enroll more students during the summer).
Recruitment, Advertising, and Outreach. Both California and school districts have a history of recruiting teachers from within the state as well as out of state. For example, the state ran the CalTEACH program from 1997 to 2004. This program funded several regional recruitment centers to attract both in–state and out–of–state candidates. Although the program has since ended, districts currently engage in independent out–of–state recruitment efforts and post open positions on California’s online teacher job board (EdJoin), which can be viewed by out–of–state candidates. In addition, California’s higher education institutions operate a number of recruitment programs, including the University of California’s CalTEACH program (which recruits undergraduates to become STEM teachers) and the CSU’s partnerships with local districts (which encourage high school students to enter the teaching profession and teach in their local schools).
Support Programs. Teacher support programs are designed to reduce turnover and improve the quality of the workforce. California has a long history of funding these types of programs. Among the largest of California’s programs have been the Beginner Teacher Support and Assessment program (an induction program of mentorship and support for new teachers) and Peer Assistance and Review (a peer–based program to help struggling veteran teachers). With the enactment of LCFF, districts now undertake these types of activities using their LCFF allocations. Since the enactment of LCFF, the state, however, still has earmarked some funding specifically for teacher–support activities. Most notably, the state has provided billions of dollars in one–time funding in part to help teachers implement the Common Core State Standards and, in 2015–16, $490 million (one time) for the educator effectiveness block grant, which districts can use for a variety of teacher–related purposes.
Ongoing Salary Increases. School districts use ongoing salary increases as a way of attracting and retaining candidates. California has one of the highest average teacher salaries in the country ($74,000), which can serve to attract candidates from other states. (California also has a higher cost–of–living than many other states.) To address staffing difficulties with certain types of positions, a small subset of school districts offer ongoing salary premiums for certain types of shortage positions. For example, approximately 20 percent of districts within California have locally negotiated annual salary premiums for special education teachers, with a median annual premium of $788 per special education teacher. While a certain percentage of special education premiums are awarded in recognition of additional required working hours, others are offered in recognition that certain specialists are difficult to find and retain (such as speech pathologists).
Salary Bonuses. To attract qualified individuals into longstanding shortage areas, states have offered a variety of bonuses. Hawaii offers a $10,000 bonus spread over three years to entice retired special education teachers to return to the profession. It offers a similarly sized bonus to dual credential holders to return to special education if they are not currently teaching special education. Certain districts within California offer one–time signing bonuses to all new hires.
Housing Subsidies. Some states and districts offer housing subsidy programs as an additional incentive for entering and staying in their schools. Examples of these programs include Connecticut’s Teacher Mortgage Assistance Program (which offers subsidized mortgages for teaching in hard–to–staff schools or in shortage areas), California’s Extra–Credit Teacher Home Purchase Program (which offers zero–interest loans of up to $15,000 to help with down payments and closing costs for teaching in hard–to–staff schools), and rent controlled teacher housing units (operated by certain districts, including the San Francisco Unified School District).
Financial Aid for Student Loans. Financial aid programs offset the cost of teacher preparation programs, thereby reducing the cost of entry into the profession. For individuals who may otherwise be deterred by the cost of a credentialing program, such programs could increase the supply of teachers. In the past, California has offered both upfront aid for covering the cost of teacher preparation and backend loan forgiveness. Examples of California’s former financial aid programs include the Governor’s Teaching Fellowship Program (which provided a $20,000 upfront fellowship for individuals to teach in a hard–to–staff school for four years) and the Assumption Program of Loans for Education (which provided up to $19,000 in loan forgiveness for teaching in shortage areas for four years). In addition to these programs, the federal government runs the Teacher Loan Forgiveness Program, which provides up to $17,500 in loan forgiveness for teaching in hard–to–staff schools for five years. The federal government also cancels up to 100 percent of Federal Perkins Loans debt for individuals teaching in a shortage area for one year.
Issues for Consideration
Below, we combine a high–level review of key findings on the effectiveness of past teacher policies with thoughts for the Legislature to consider when exploring potentially new teacher policies.
Focus on Longstanding Shortage Areas Rather Than Adopting Broad Statewide Policies. Though mismatches between new teaching credentials issued and projected teacher hires arise periodically, these mismatches tend to correct themselves gradually over time. Given these cyclical patterns, with trends changing every few years, state government likely cannot react quickly enough to make much of a difference before the market corrects itself. Moreover, efforts to address statewide market issues tend to result in broad–based policies, such as financial aid for all teacher preparation students, that can be expensive and detract from efforts otherwise focused on the state’s longstanding shortage areas. For these reasons, we encourage the Legislature to avoid broad statewide policies and narrowly tailor any new policies to addressing California’s perennial staffing difficulties in specific subjects areas (special education and STEM) and types of school districts (city–center, low–income, and rural).
New Teacher Support Programs Generally Found Effective . . . Teacher induction programs have repeatedly been shown to significantly increase the retention of new teachers. A recent nationwide study of the 2007–08 cohort of teachers conducted by the U.S. Department of Education found that 80 percent of those teachers who participated in teacher induction programs remained teaching after five years, compared to 64 percent of individuals who did not participate in induction programs. Studies of California’s teacher induction programs have demonstrated similar benefits.
. . . But California Already Supports These Types of Programs. The state has a long history of supporting new teacher induction programs, which it continues to do under the LCFF program. When creating the LCFF, the state integrated existing funding for beginning teacher and veteran teacher support into districts’ allocations. Since its enactment, funding for LCFF has increased significantly. Creating new teacher support programs therefore likely would work counter to and complicate the state’s current approach to school finance. Rather than authorizing new induction programs, the state may wish to explore options for encouraging districts to engage in best practices using their LCFF funding.
Efforts to Support Teachers on Ongoing Basis Found to Reduce Turnover . . . Many teachers who left the profession in 2011–12 cited an improved ability in their new, non–teaching job to balance their personal and work lives, influence their workplace’s policies and practices, and have autonomy and control over their own work. Former teachers have indicated through these surveys the value of being empowered in their professional lives and having control over their schedule and work. These issues of poor workplace culture are often cited as some of the most important reasons why teachers leave the profession.
. . . But These Types of Programs Difficult to Design at State Level. The most effective efforts at supporting veteran teachers on an ongoing basis appear to involve school leaders tailoring professional development opportunities to the interests and challenges facing specific teachers. For example, school leaders seem to be best suited to provide mentorship and guidance to special education teachers involved in stressful meetings relating to students’ Individual Education Programs. By comparison, state interventions generally apply a one–size–fits all solution, which may be inappropriate for many of these types of local workplace issues.
Targeted, Ongoing Salary Increases Likely Most Effective Fiscal Incentive . . . Research generally finds that targeted, ongoing salary increases are the most effective type of financial incentive for attracting highly qualified teachers and keeping them in their jobs. For example, research finds that providing ongoing salary increases targeted to shortage subjects in hard–to–staff schools have helped districts retain higher qualified teachers (such as those with higher SAT scores or those who are National Board Certified Teachers). Targeted, ongoing salary increases tend to be more effective than targeted, one–time salary increases, as bonuses provide no incentive to remain teaching in a shortage area after the bonus has been paid.
. . . But California Faces Challenges in Providing These Types of Fiscal Incentives. Given most school districts collectively bargain teacher salaries and teachers have a longstanding tradition of a single salary schedule, the state presumably has no easy way of encouraging higher pay in its perennial shortage areas. It could try offering a bonus at the state level. Hawaii, a state with a highly centralized school system, offers such bonuses. Such an option might work in California, but it would be costly. For example, providing a $10,000 bonus for every high school science and math teacher would cost $200 million annually.
Financial Aid Has Limited Benefits in Relation to Attracting New Teachers . . . Many studies show that financial aid programs increase the probability that a new teacher will teach in a hard–to–staff school (if aid is contingent on working in a hard–to–staff school), but less is known about these programs’ effectiveness in attracting new entrants into teaching. Researching the behaviors of law school entrants, one Harvard study found that upfront tuition subsidies (similar to the Governor’s Teaching Fellowship) were much more effective in compelling law school students to enter lower–paying, public–sector jobs and remain in these jobs than loan forgiveness programs (similar to APLE). Another shortcoming of loan forgiveness programs is that only about half of graduates in bachelor’s programs in California have student debt, meaning the program draws from a limited subset of potentially interested individuals. Such programs by design are poor at attracting all types of candidates (those with and without student debt) into teaching.
. . . So Urge Caution in Designing Financial Aid Program. Research suggests that upfront tuition subsidies (such as the Governor’s Teaching Fellowship) likely are a more effective recruitment and retention tool than loan forgiveness programs (such as APLE). While the program monitoring costs of upfront tuition subsidies may be larger (as the state needs to monitor individuals longer to ensure that they enter and remain in the profession), the higher retention rates of these teachers make the approach more cost–effective overall. Evidence is limited, however, for both types of financial aid programs in terms of bringing new teachers into the profession. We recommend the Legislature consider a tuition grant program specifically if the goal is to prompt teachers to work in perennial shortage areas.
Consider Outreach to Re–Engage Former Teachers or Recruit Out–of–State Teachers. Both of these strategies are among the most cost–effective for increasing the supply of teachers within California in the short–term. If the state were to spend one–time funds on outreach, we encourage it to focus specifically on recruiting individuals who are trained to teach in perennial shortage areas. Outreach can attract viable teachers much faster and at lower cost than many other shortage policies. Student aid programs, for example, typically cost more than outreach campaigns and take longer (at least one year) to result in additional stocks of teachers. Moreover, other states, such as New York, produce far more teachers than they are able to hire, suggesting that California may be able to recruit from these states.
Significant Drawbacks of Having No California Teacher Database. California does not have an integrated data system that tracks cohorts of teachers over time. Without this type of data system, the state must rely heavily on research from other states as well as periodic survey data collected at the federal level. Both of these alternative sources of information have notable shortcomings. Research from other states almost always assesses the outcomes of an individual policy intervention and does so within those states’ political contexts. These studies also rarely make comparisons across policies. For example, no study we are aware of has compared the cost–effectiveness of funding a teacher induction program compared to a teacher preparation grant program. Moreover, periodic federal survey data tends to be limited to certain types of data that are generalizable enough to be applicable to all states, and California–specific policies can rarely be tracked.
Many Important California–Specific Questions Consequently Left Unanswered. Many questions legislators have cannot, in turn, be answered well or at all. For example, the state does not have reliable data on the retention rates of intern–prepared teachers compared to traditionally prepared teachers, nor does the state have data on the retention rates of its special education teachers relative to STEM teachers or these teachers relative to other teachers. California does not have data on how many credentialed teachers are not working, nor does it have data to examine the effectiveness of pay–based policies in re–engaging fully credentialed special education teachers who have dropped out of the teacher workforce. These are only a few of the many important questions the state cannot answer because it is not strategic about collecting and sharing teacher data among state agencies.
Encourage State Develop a California Teacher Database. The state created the California Longitudinal Teacher Integrated Data Education System (CALTIDES) in statute in 2006. The data system was created “for purposes of developing and reviewing state policy, identifying workforce trends, and identifying future needs regarding the teaching workforce.” It also was “to provide high–quality program evaluations” and “promote the efficient monitoring of teacher assignments as required by state and federal law.” The system would have linked teacher data across several state agencies, and the state had dedicated years of preparation working through linkage and privacy issues among these agencies. At the time, the state had received $6 million in federal funding to create the database. In 2011–12, the Governor eliminated authorization for the project, citing a desire to “avoid the development of a costly technology program that is not critical.” Given the potential benefits to California of having such a system, we encourage the Legislature to consider re–establishing it.
Back to the TopSummary of LAO Recommendations
|
Proposition 98 |
|
|
|
|
|
|
Local Control Funding Formula (LCFF) |
|
|
Preschool Restructuring |
|
|
|
|
Education Mandates |
|
|
|
|
|
|
Special Education |
|
|
|
|
County Offices of Education |
|
|
High Speed Network |
|
|
|
Teacher Workforce |
|
|