
Price inflation has remained modest for both the U.S. and California over the past year. Los Angeles-area prices, however, climbed notably faster than prices in the rest of the nation during the month of July, according to new federal data. The July spike in Southern California gas prices seems to have been a key factor. (As the Los Angeles Times, the Los Angeles Daily News, and others report, area gas prices have dropped well below July highs in recent weeks.) Month-to-month changes in CPI are volatile; increases or decreases of the magnitude reported for Los Angeles in July occur a few times each year.
July Consumer Price Index (CPI) Data Released for U.S. Price inflation continues to be modest in the U.S. According to U.S. Bureau of Labor Statistics (BLS) data released today, the nationwide CPI for all urban consumers increased 0.1% in the month of July on a seasonally-adjusted basis. The nationwide CPI for all items excluding volatile food and energy prices also rose 0.1% in July. "A 0.4% advance in the shelter index [a measure of rents and "owners' equivalent rent" for primary residences] was the main contributor to the increase," BLS reported.
Over the last 12 months, before seasonal adjustments, the nationwide CPI for all items rose 0.2%; over the same period, the nationwide CPI excluding food and energy rose 1.8%. Over the last 12 months, the nationwide index of energy prices has fallen 14.8%, led by a large decline in gasoline prices over the past year.
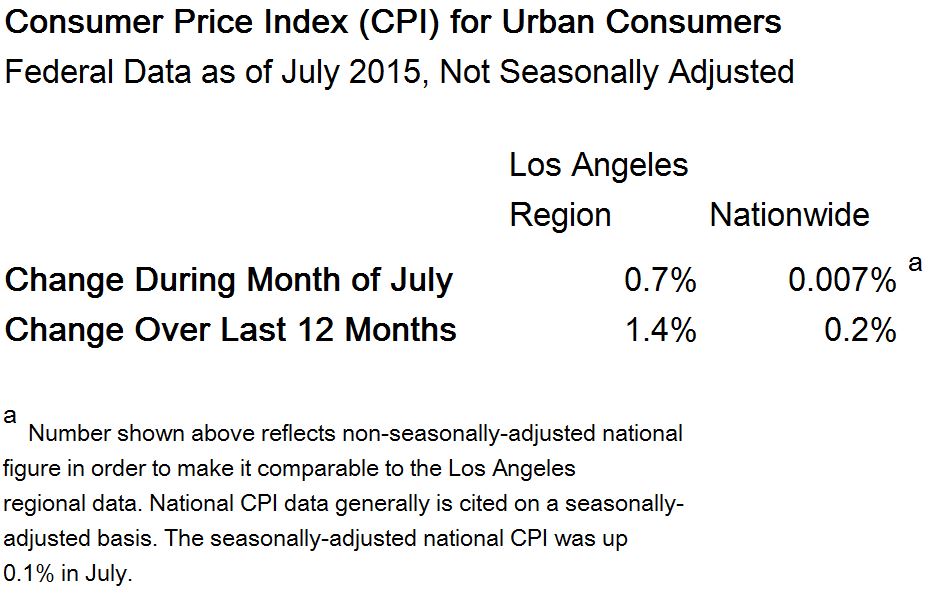
Notable Increase in Los Angeles-Area Prices in July. In conjunction with its CPI data release, BLS also released data on the July CPI for the Los Angeles area today (consisting of Los Angeles, Orange, Riverside, San Bernardino, and Ventura Counties). In July, the non-seasonally adjusted CPI for Los Angeles-area consumers increased by 0.7%, far outpacing the comparable, negligible monthly increase for the nation as a whole.
Key figures from the Los Angeles-area CPI data follow:
- Prices of All CPI Items Combined.
- Up 0.7% for the month of July.
- Up 1.4% over the last 12 months.
- Energy Prices.
- Up 6.7% for the month of July (including a 10.5% gasoline price rise).
- Down 3.6% over the last 12 months (including a 2% drop in gasoline prices).
- Food Prices.
- Up 0.7% for the month of July (including a 1.1% rise for prices for food at home and a 0.2% rise for prices for food away from home).
- Up 1.8% over the last 12 months (including a 1.2% rise for prices for food at home and a 2.6% rise for prices for food away from home).
- Prices of All CPI Items Excluding Food and Energy.
- Up 0.1% in July. (This includes a 0.6% rise during July in medical care prices, a 0.3% rise in shelter costs, a 1.6% drop in apparel costs, and a 0.5% drop in costs for household furnishings and operations.)
- Up 1.8% over the last 12 months. (This includes a 3.6% rise over the last 12 months in shelter costs, a 1.9% increase in medical care costs, a 2.8% decline in apparel costs, and a 2.1% decline in household furnishing and operations costs.)
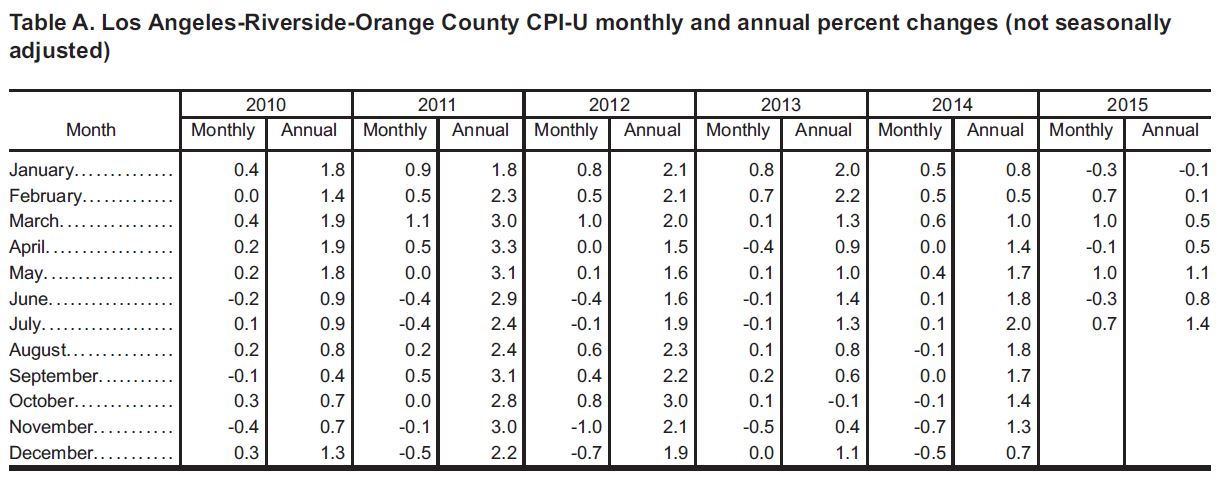
As shown in the BLS table below, monthly increases or decreases of 0.5% or more in Los Angeles-area CPI tend to occur a few times each year. Given the drop in gasoline prices being reported during August, it seems quite possible that August CPI, when it is reported in a few weeks, will decline for the region.
Data for Other California Regions. BLS only reports monthly CPI data for the largest urban regions, including Los Angeles. Today, BLS released San Diego-area CPI data for the first half of 2015. The most recent CPI data release for the Bay Area from BLS (released in July) covered CPI through the month of June.
More on the CPI. The CPI is a measure of inflation experienced by urban consumers (not a cost-of-living index, per se). CPI allows a comparison of what a "fixed market basket of goods and services" costs compared with what the same basket cost a month or a year or multiple years ago.