
As of March 2018, California’s median home price had climbed to nearly $540,000. This is an increase of 9% over the last year. At the same time, median rents grew by only 3% over the last year, reaching $1,900 per month. This recent uptick in home prices comes on the heels of a 60% increase in home prices between 2012 and 2017.
This rapid growth in house prices coupled with more modest growth in rents raises the question of whether California is entering another housing bubble. One common way to gauge whether home prices are getting out of line with underlying demand for housing is the ratio of home prices to rents. Rents are considered to better reflect underlying demand for housing and less prone to increases during periods of speculation than housing prices.
A look at price-to-rent ratios (median home price divided by twelve months of median rent) for California’s major housing markets suggests that home prices in most of the state are in line with underlying demand, but that home prices in some San Francisco Bay Area markets may be getting a little overheated. The graphic below shows the price-to-rent ratios for four Bay Area counties (Marin, San Francisco, San Mateo, and Santa Clara), as well as the rest of the state.
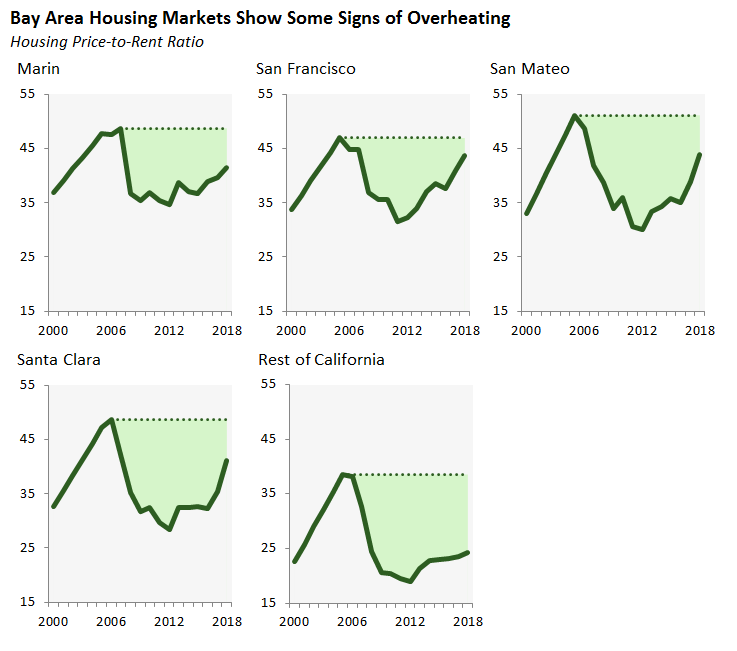
In normal times, California’s statewide price-to-rent ratio tends to hover around 25. During the housing bubble of the mid-2000s, the statewide ratio exceeded 40. Currently, the ratio is 24 for markets outside of the four Bay Area counties listed above. For these four Bay Area counties, the ratio currently is somewhere between 40 and 45. Even in normal times, the ratio tends to be higher in these counties (around 35). Nonetheless, these Bay Area housing markets are exceeding statewide and historic norms and are moving closer to the levels seen during the mid-2000s housing bubble.