
Data on Real Income Growth Trends by Percentile, 1990-2014
September 6, 2016
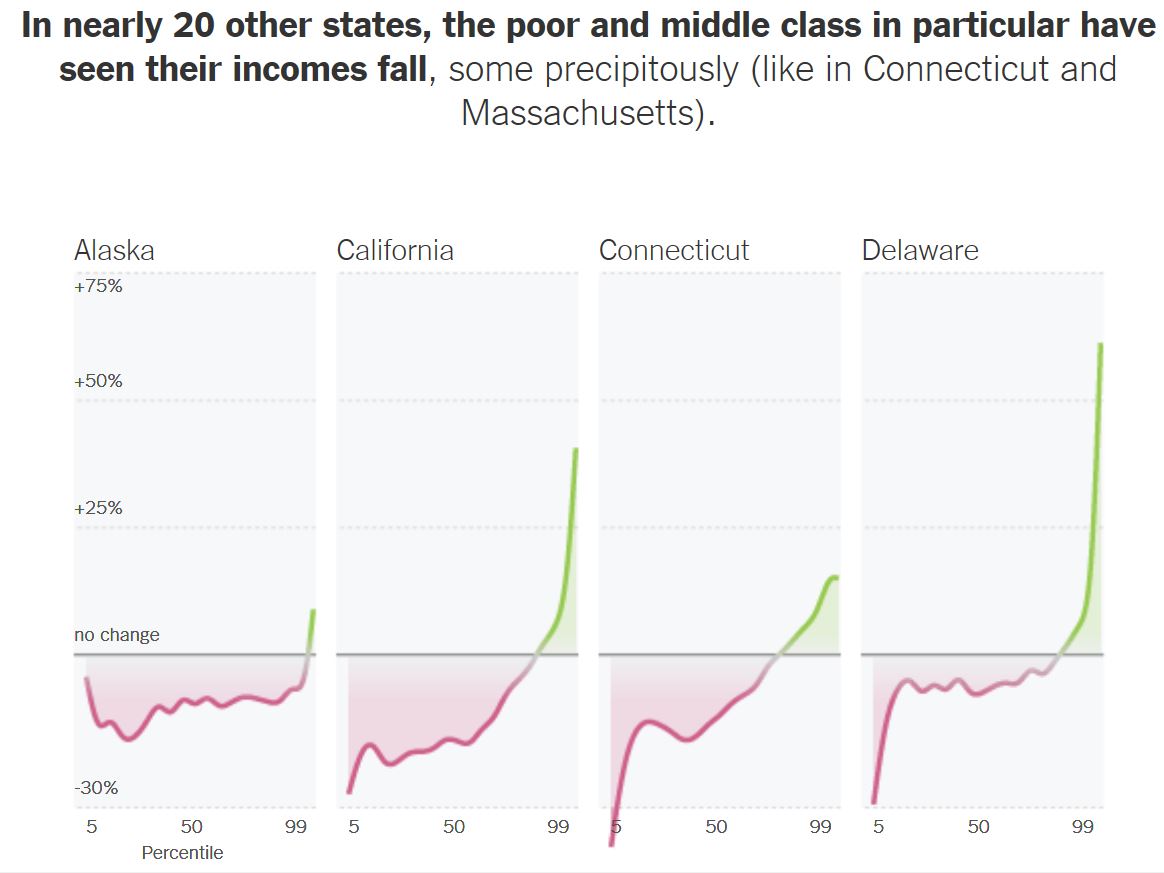
Today, The New York Times—in its online section, Upshot—published a look at Census Bureau data that considers real (inflation-adjusted) income growth by income percentile for each state between 1990 and 2014. That article, written by Quoctrung Bui of The New York Times, is here. Titled "The Geography of U.S. Inequality," the article's subhead promises an answer to the question: "How have the contours of incomes changed, state by state, over the last two decades?"
According to the calculations cited in the article (a graphic from which is excerpted below), California is one of about 20 states in which lower- and middle-income groups (that is, lower- and middle-income percentiles) had lower real incomes in 2014 than they did in 1990.
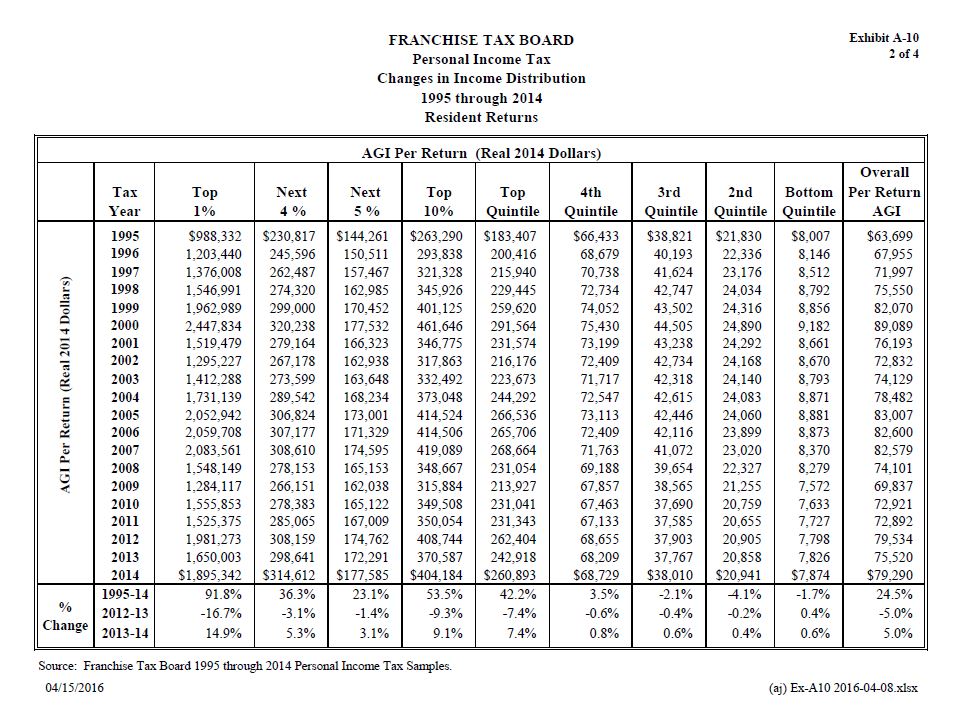
The shift downward in lower- and middle-income Californians' real incomes—coupled with sharp increases at the upper end of the income distribution—is not a surprise. In general terms, this resembles the trend spotted in state tax return data over the last two decades (as summarized in a state Franchise Tax Board table at the end of this note). State tax data, however, lacks good information for many low-income Californians, many of whom do not have to file. State taxable income, with its volatility from high-income Californians' capital gains and losses, also differs from income reported in some other data sources. As noted at the end of the Times piece, no single data source on income is perfect.
The long-term downward shift in lower- and middle-income Californians' real incomes surely can be traced to many causes. As our office notes in the Times article, we suspect that one contributing factor is the lack of supply of new residential housing in some of California's high-wage, high-productivity urban areas in recent decades. (We have discussed some of these issues in prior research, such as our 2015 report, California's High Housing Costs: Causes and Consequences. In that report, see "Housing Costs Influence Where Households Live and Work" on pages 33-34 of the pdf version and "Spillover of Demand to Live on the Coast Affects Housing Costs in Inland California" on page 12.)
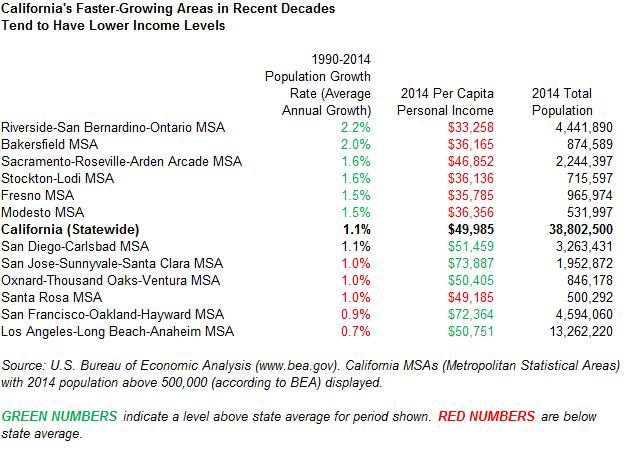
In part, we suspect, due to California's lack of new residential housing supply and resulting high costs in coastal areas, a large portion of California's population growth occurred in areas of the state with incomes below the statewide median since 1990. In 1990, for instance, counties with median income below the state median had about 20% of California's population, but between 1990 and 2014, those counties accounted for 37% of the state's population growth. As shown below, California's faster-growing areas in recent decades tend to have lower income levels.
Other researchers have found a similar pattern when looking at the U.S. as a whole: in recent decades restrictive land use regulations have slowed population flows into high-productivity areas, leading to wider income differences among U.S. states.
While there are many factors underlying these broad societal trends, the data above suggest to us that interstate, intrastate, and international migration played a role in California's income shifts since 1990. To summarize: we suspect that high housing costs in California's economically productive, high-wage coastal areas contributed to more households moving to lower-cost, lower-wage areas of the state. This probably would have caused some parts of the income distribution to drift downward, as The New York Times shows.
Follow @LAOEconTax on Twitter for regular California economy and tax updates.
Below is the state Franchise Tax Board data on adjusted gross income per resident tax return, showing how virtually all real growth over the last two decades occurred in the top quintile of returns. As noted above, state tax data lacks good information for low-income households in particular, as many are not required to file tax returns annually.
Additional information was added to the post on September 7, 2016, following its initial posting on September 6.