
The official unemployment rate has been improving in California and the rest of the nation. In addition to this commonly reported measure of unemployment, there are other measures of "labor underutilization" in the economy, such as the "U-6" measure.
The U-6 Measure. Today, the U.S. Bureau of Labor Statistics (BLS) has updated its "alternative measures of labor underutilization" for states to include data through the first quarter of 2016. One such alternative measure is the U-6 rate, which considers not only the unemployed population in the official "U-3" unemployment rate, but also marginally attached workers and those employed part-time for economic reasons. The U-6 rate is defined by BLS as the "total unemployed, plus all marginally attached workers, plus total employed part time for economic reasons, as a percent of the civilian labor force plus all marginally attached workers." This U-6 measure has been said to measure the "unemployed, underemployed, and those who are not looking but who want a job." (In a prior blog post, we provided additional background on U-6 and other unemployment measures.)
2015 Labor Underutilization Data. California's U-6 rate fell from 15.2% in 2014 to 12.7% in 2015, BLS announced a few weeks ago. As shown below, the 12.7% California U-6 rate remains above the nation's U-6 rate (10.4% in 2015). U-6 has improved markedly for both California and the U.S. since its peak in 2010, as shown in the figure below. Still, especially for California, U-6 remains somewhat above where it was in 2006 prior to the economic downturn. (California's U-6 rate was 9.1% then, compared to 8.2% for the U.S.)
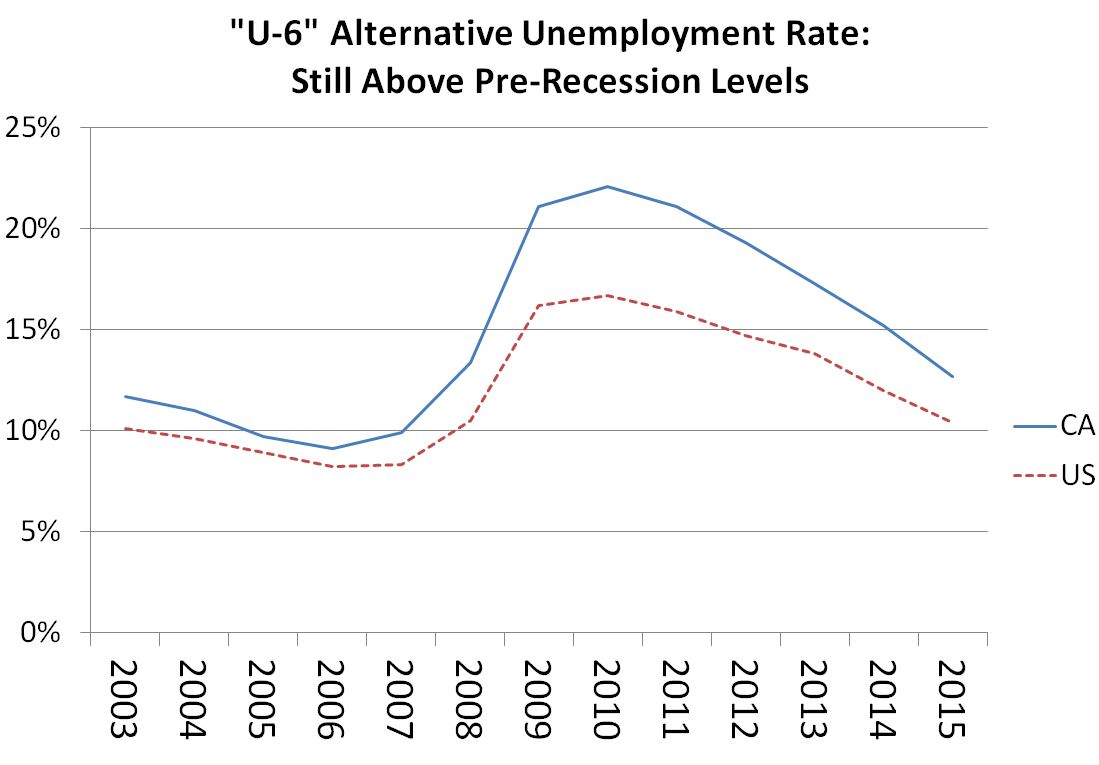
California U-6 Rate Fell in First Quarter of 2016. BLS provides alternative measures like U-6 on a four-quarter moving-average basis for states to increase the reliability of Current Population Survey estimates (which are based on small sample sizes at the state level) and to reduce the effects of seasonality on the measure. According to today's newly updated data (which considers the first quarter of 2016), the current four-quarter moving-average U-6 rate is 12.0% for California and 10.1% for the U.S. as a whole. Only Nevada (13.4%) and New Mexico (12.4%) have higher U-6 rates among the states; Alaska also has a 12.0% U-6 rate in this new update. For Los Angeles County, one of the only substate areas reported in this dataset, the four-quarter U-6 rate is 12.8%.
By its nature, the U-6 rate is higher than the official U-3 unemployment rate. For the last four quarters, on average, the official U-3 rate is reported to have been 5.9% for California, 6.1% for Los Angeles County, and 5.1% for the U.S. as a whole. (BLS notes that survey differences may cause this four-quarter U-3 measure to differ from the commonly reported state unemployment rates over the same period.)
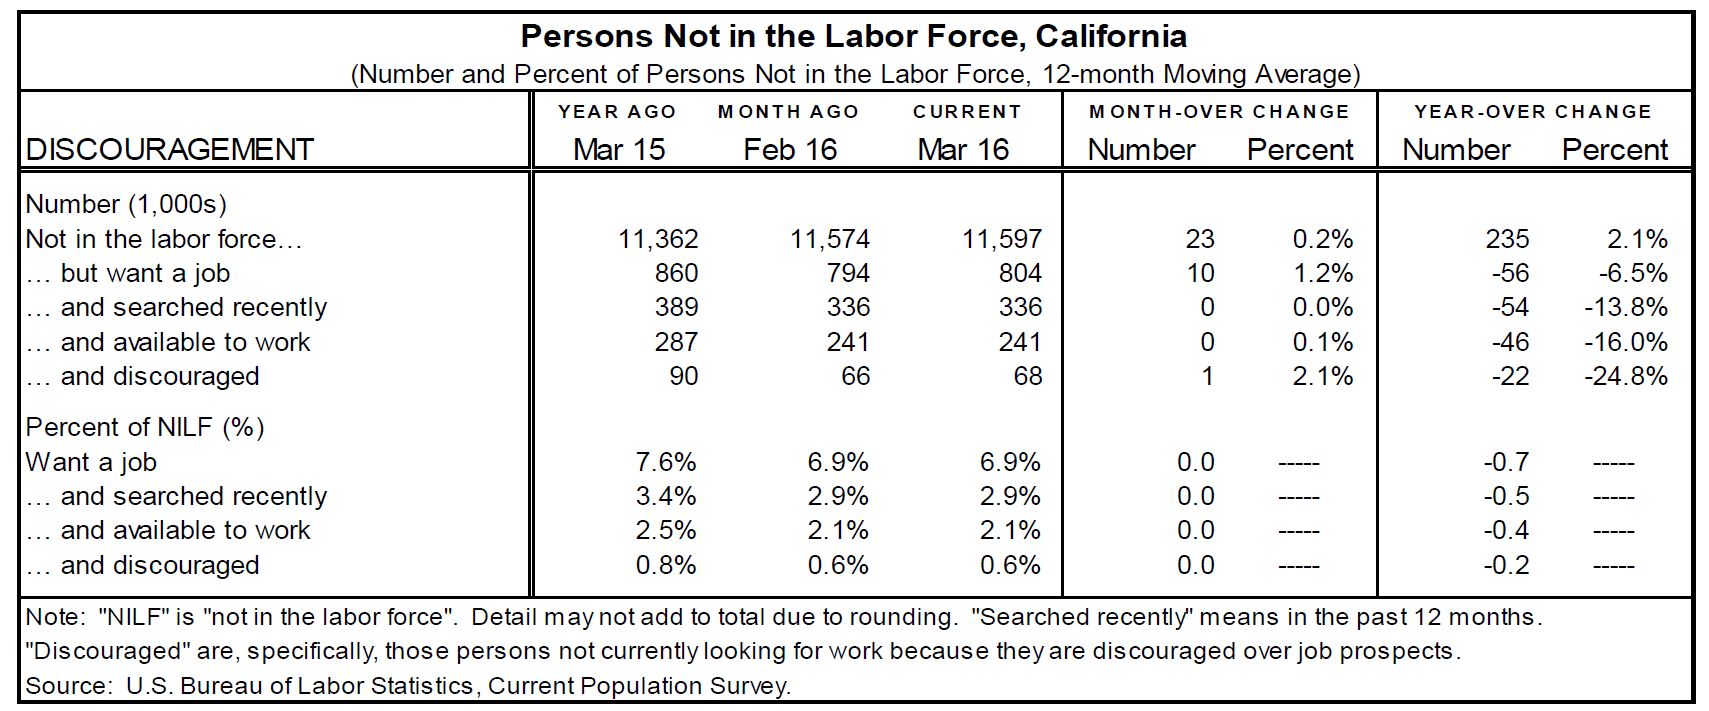
Other Labor Underutilization Data. As illustrated in state Employment Development (EDD) data (summarized in the figure below), the number of Californians "not in the labor force" who also want a job is down 6.5% over the last year. The estimated number of Californians not in the labor force who were "discouraged" workers (those not currently looking for work because they were discouraged over job prospects) fell sharply over the past year by 24.8%.
EDD survey data (summarized below) also indicates that the number of Californians working part time for economic reasons (principally the inability to find full time work) has dropped 19.2% over the past year. The number of "usually full time" workers has increased by 3.6%, while the number of "usually part time" workers has fallen by 1.7%. The data indicates that over 80% of California's workers work "usually full time."
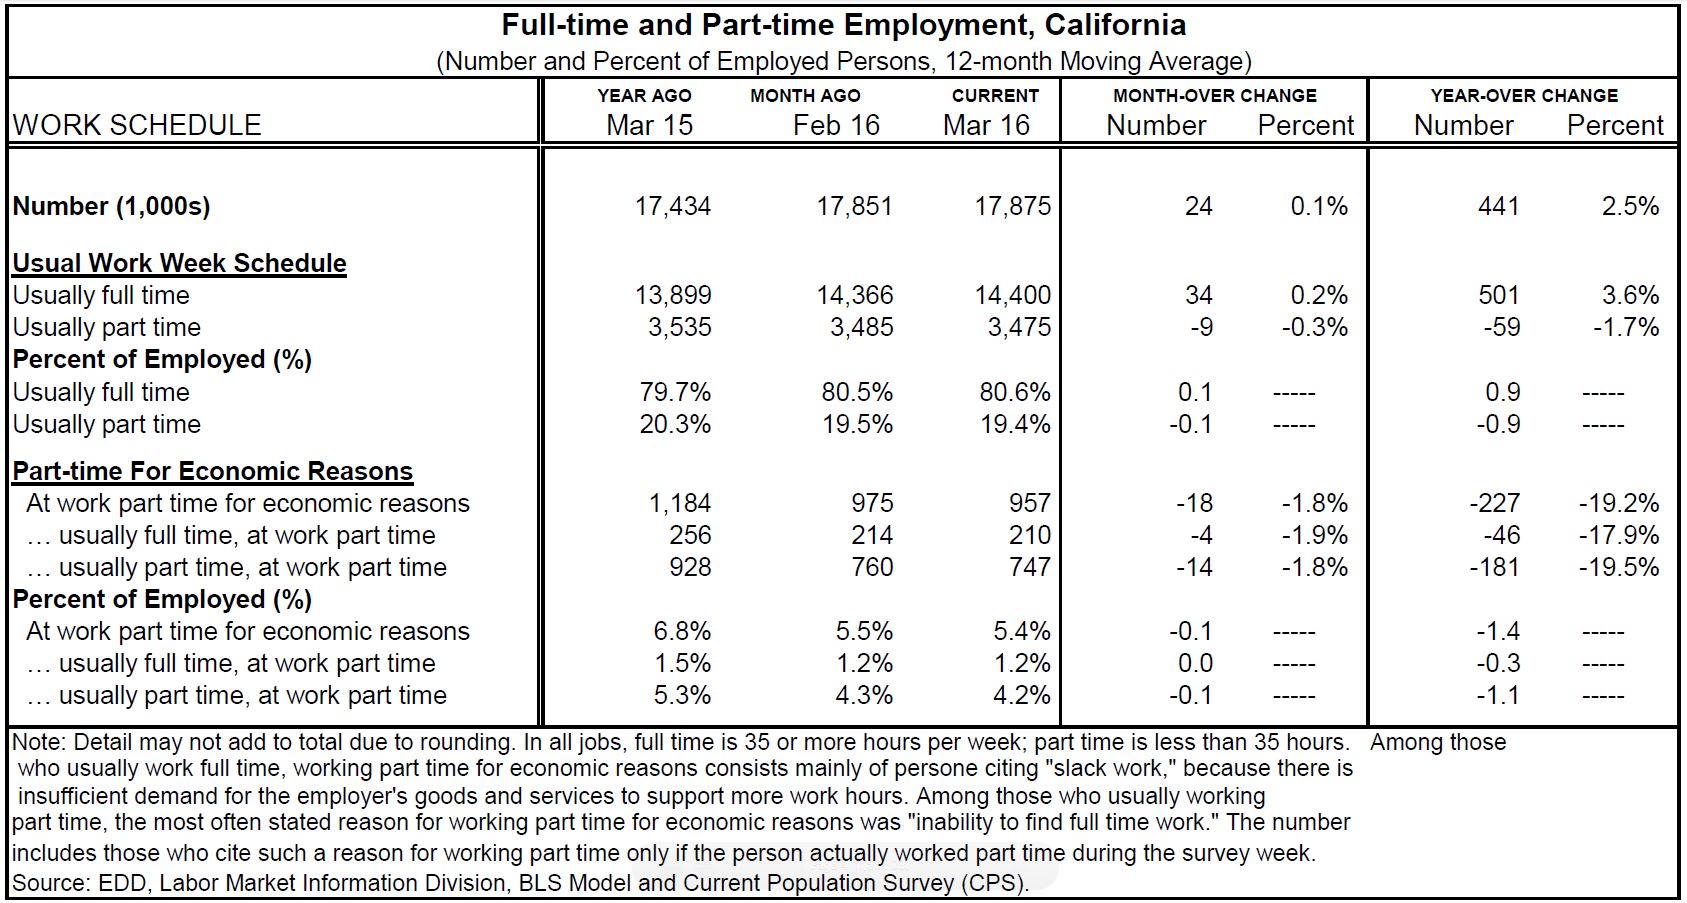
Numbers of Unemployed, Underemployed, and Those Who Want a Job. As of March, using a 12-month moving average, 1.1 million Californians were estimated to be unemployed, which means they are not working, but have looked for a job recently. Over the last 12 months, on average, 957,000 are estimated to be at work part time for economic reasons, while just over 800,000 were not in the labor force, but wanted a job. These numbers suggest that around 2.9 million Californians are unemployed, underemployed, or wanting a job but not looking for one now.
Follow @LAOEconTax on Twitter for regular California economy and tax updates.
This post was updated on April 26, 2016 to clarify that the figure of 1.1 million in the final paragraph was derived from a 12-month moving average of the number of unemployed, as of March. This ensures that the figure is comparable with other numbers in the final paragraph. For the month of March alone, the number of unemployed was just over 1.0 million.