
May 2015 State Jobs Data
California Nonfarm Payroll Jobs Up by 54,200 in May. On June 19, 2015, as our office was focused on the state's 2015-16 budget package, the state's Employment Development Department (EDD) released California's May 2015 jobs report. Nonfarm payroll jobs increased by 54,200 during May, EDD reported, as the official unemployment rate rose slightly to 6.4% due in part to more workers being counted in the state's labor force. As shown below, California's job growth rate over the past 12 month has outpaced the U.S. as a whole in 15 of the 18 nonfarm job sectors we track. In addition, payroll jobs in California's agriculture sector, which are more difficult to track than nonfarm jobs, declined 0.7% over the past year, EDD reported.
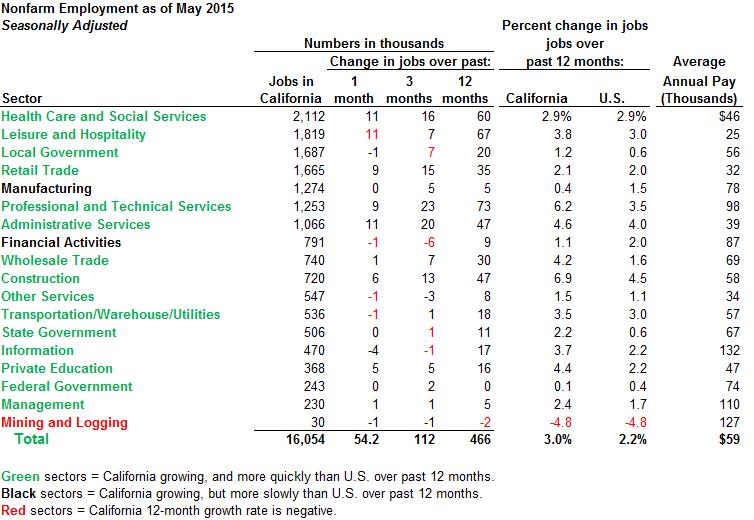
As shown above, California's job picture continues to be one of broad-based growth, led in particular by the construction sector and the high-paying jobs of the professional and technical services sector. Within the latter sector, EDD data shows that the computer systems service category is the one with the largest growth over the past year.
Over Past Year, California Job Growth Ranks in Top Tier of U.S. States. On June 19, the U.S. Bureau of Labor Statistics (BLS) released May jobs data for states around the country too. From May 2014 to May 2015, California's seasonally-adjusted growth rate for nonfarm payroll jobs ranked 7th highest among the 50 states. Utah ranked first with a 3.9% year-over-year job growth rate, followed by Washington (3.6%), Florida (3.4%), Nevada (3.4%), Idaho (3.4%), Oregon (3.1%), and then California (3.0%). Among other large states, Texas ranked 12th by this measure (up 2.5% over the past year), New York ranked 26th (up 1.5%), and Illinois ranked 38th (up 1.1%).
California Official Unemployment Rate Still 8th Worst Among States. At 6.4% in May, California's official unemployment rate ranked 43rd (that is, 8th worst) among the states. Nebraska had the lowest unemployment rate at 2.6%. Among other large states, Texas ranked 13th best with an unemployment rate of 4.3%, Florida and New York were tied for 30th with unemployment rates of 5.7% each, and Illinois tied for 38th (that is, tied for 12th worst among the states) with its 6.0% unemployment rate.
May 2015 Metro Area Jobs Data
San Jose and Inland Empire Rank #1 and #2 Among Large Metros in Job Growth Over Past Year. Today, BLS released May 2015 jobs data for metropolitan regions across the country. Of the 51 metro areas with a population of 1 million or more, the San Jose-Sunnyvale-Santa Clara region (Santa Clara and San Benito Counties) had the highest nonfarm job growth rate over the past year by far at 5.7% (not seasonally adjusted). The Inland Empire region (Riverside and San Bernardino Counties) had the second-highest nonfarm job growth rate among these large metros with 4.05% job growth over the past year, narrowly outpacing the Orlando metro area in Florida with its 3.97% job growth rate. The San Diego region (San Diego County) ranked 10th among the 51 large U.S. metros with 3.15% job growth over the past year. The San Francisco-Oakland-Hayward metropolitan statistical area (MSA) consisting of San Francisco, San Mateo, Alameda, Contra Costa, and Marin Counties ranked 16th with a 3.04% job growth rate. The combined Los Angeles/Orange County MSA and the Sacramento regions ranked near the middle of the 51-area list with 2.6% job growth rates over the past year.
Among all 387 U.S. metro areas tracked by BLS, the San Jose region's 5.7% non-seasonally adjusted job growth rate ranked fifth, trailing Provo-Orem, Utah (6.7%); Odessa, Texas (6.1%); Lake Charles, Louisiana (6.0%), and Midland, Texas (6.0%).
Job Declines Over Past Year in Two California Metro Regions. Nonfarm employment in California's Madera MSA (Madera County) declined 0.3% over the past year, and the El Centro MSA (Imperial County) had a 0.4% drop. These two California MSAs were among the 63 across the country with declines in nonfarm employment over the past year (not seasonally adjusted).
High Unemployment Rates in Various Regions, Compared to Metro Areas in Other States. Mirroring the state data, while job growth here has been strong compared to the rest of the country, unemployment rates in California's metro regions remain high compared to those in other states. Among the 51 large U.S. metro regions, the combined Los Angeles/Orange County MSA is tied with Detroit, Las Vegas, and Memphis for the highest unemployment rate at 6.6%, followed by the Inland Empire at 6.4%. The San Francisco-Oakland-Hayward and San Jose-Sunnyvale-Santa Clara MSAs are tied with Denver for the 9th best unemployment rate among large metros at 4.1%. (All of these unemployment rates are not seasonally adjusted.)
Among all 387 U.S. metros, various California MSAs rank among those with the highest unemployment rates as of May on a non-seasonally adjusted basis. Of the 26 worst metro unemployment rates in May, 11 are those of California MSAs (El Centro 21.3%, Merced 11.1%, Visalia-Porterville 11.0%, Hanford-Corcoran 10.3%, Yuba City 10.1%, Bakersfield 10.0%, Madera 9.8%, Fresno 9.8%, Modesto 9.8%, Stockton-Lodi 8.6%, and Redding 7.5%). The Yuma, Arizona region has the worst unemployment rate of any metro region in the country at 23.1%, followed by the nearby El Centro MSA at 21.3%.
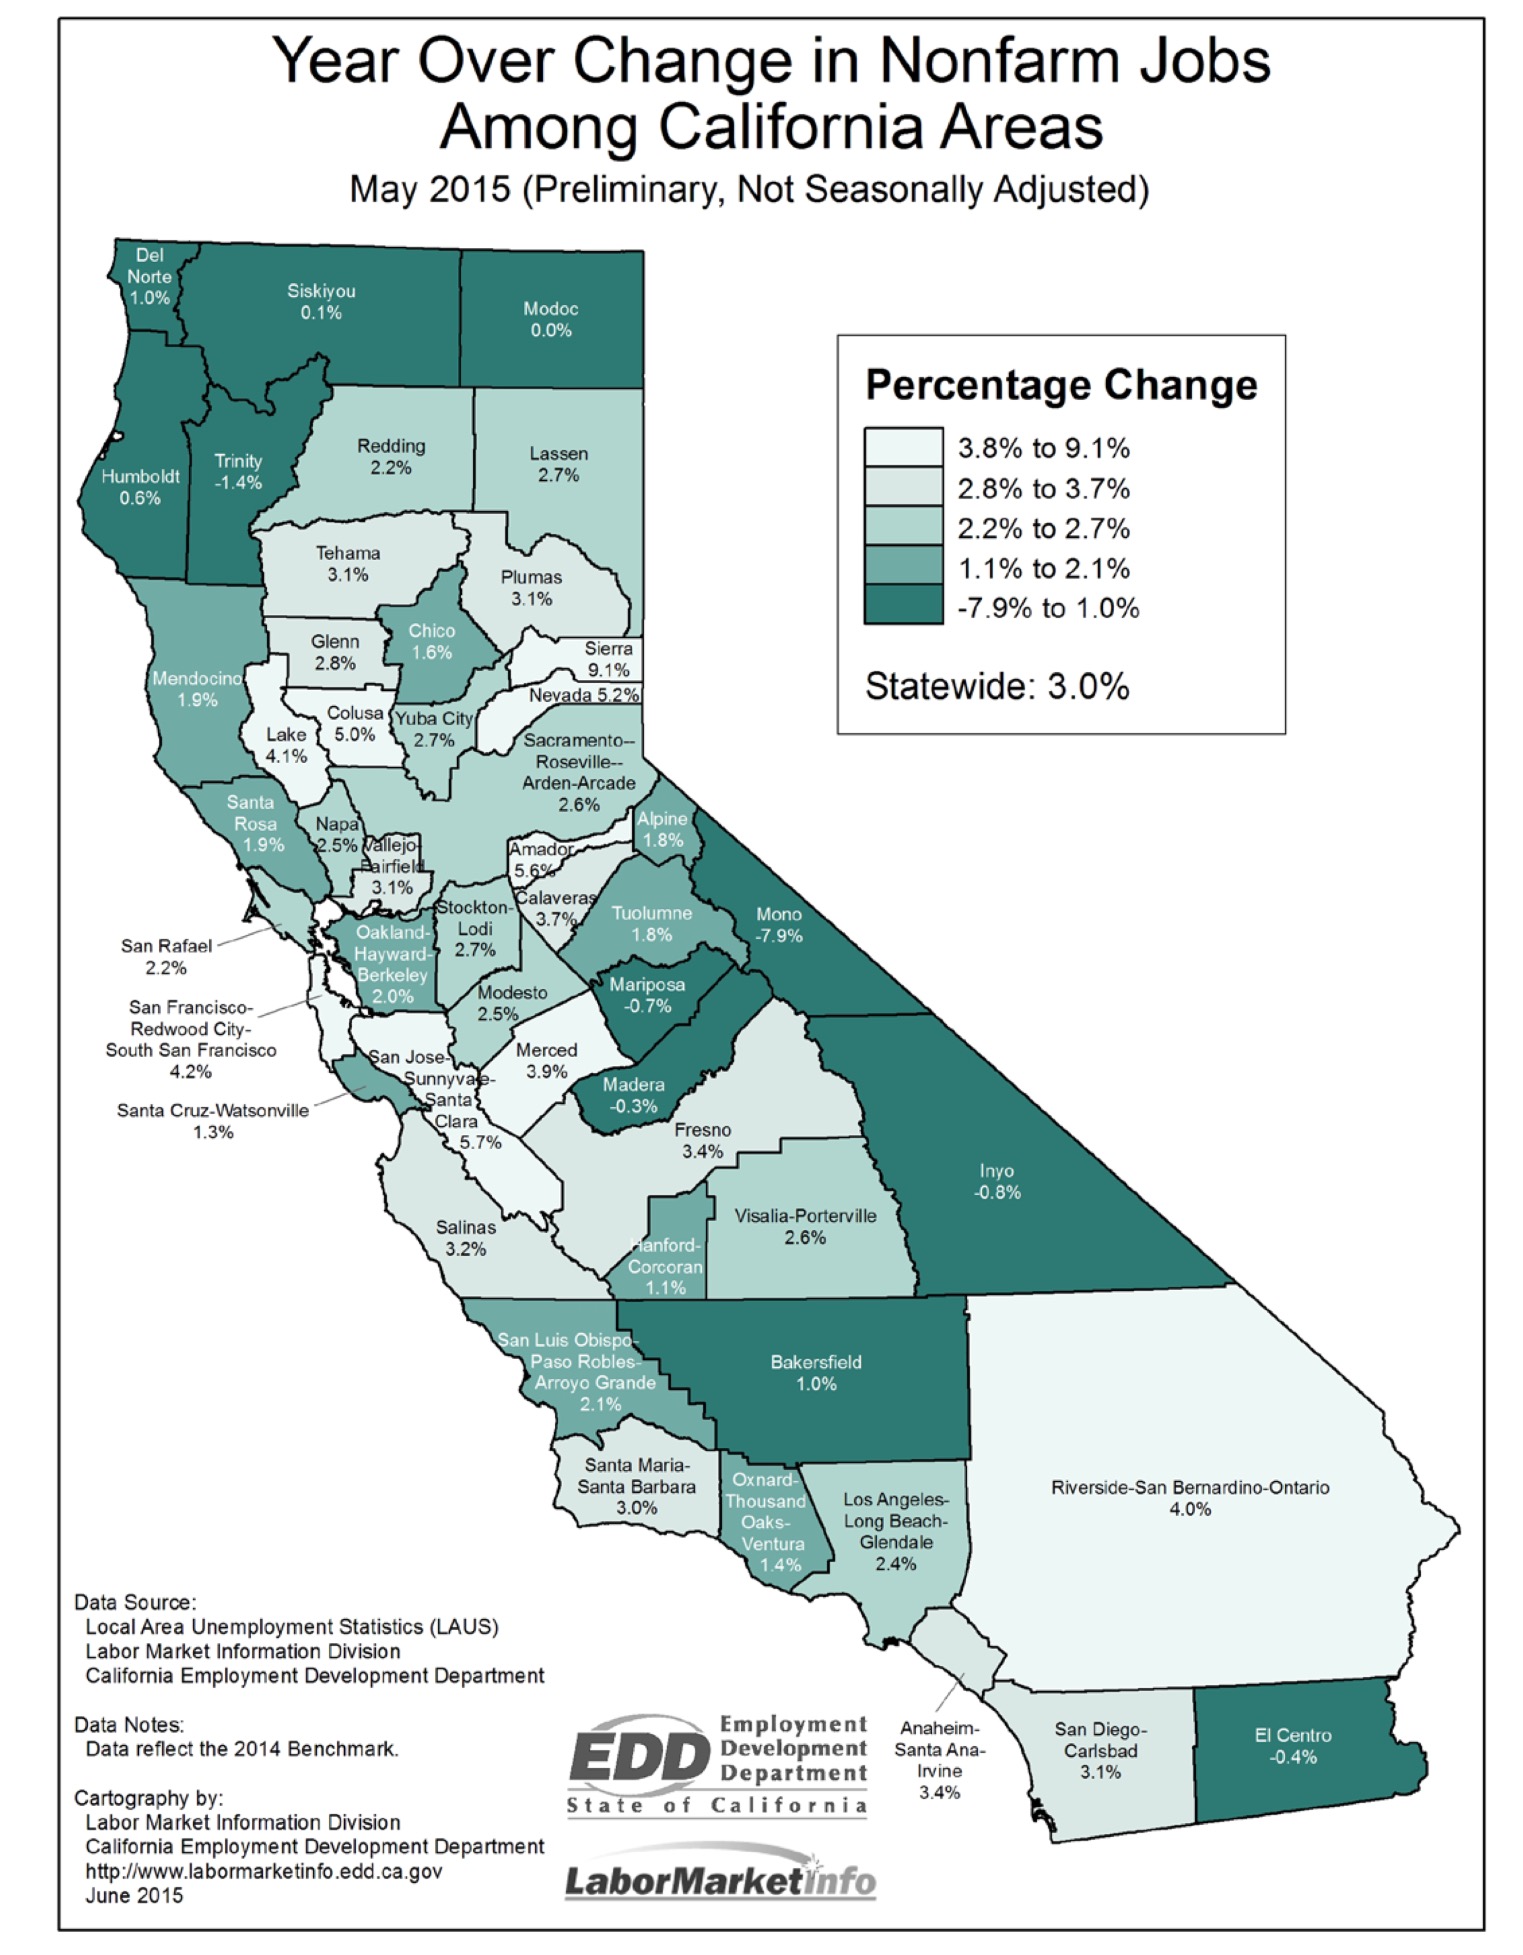
Maps Displaying May Jobs Data by Region. Below is an EDD map comparing job growth rates over the last 12 months by region across California. The lighter the color in the map below, the faster the job growth rate over the past year.
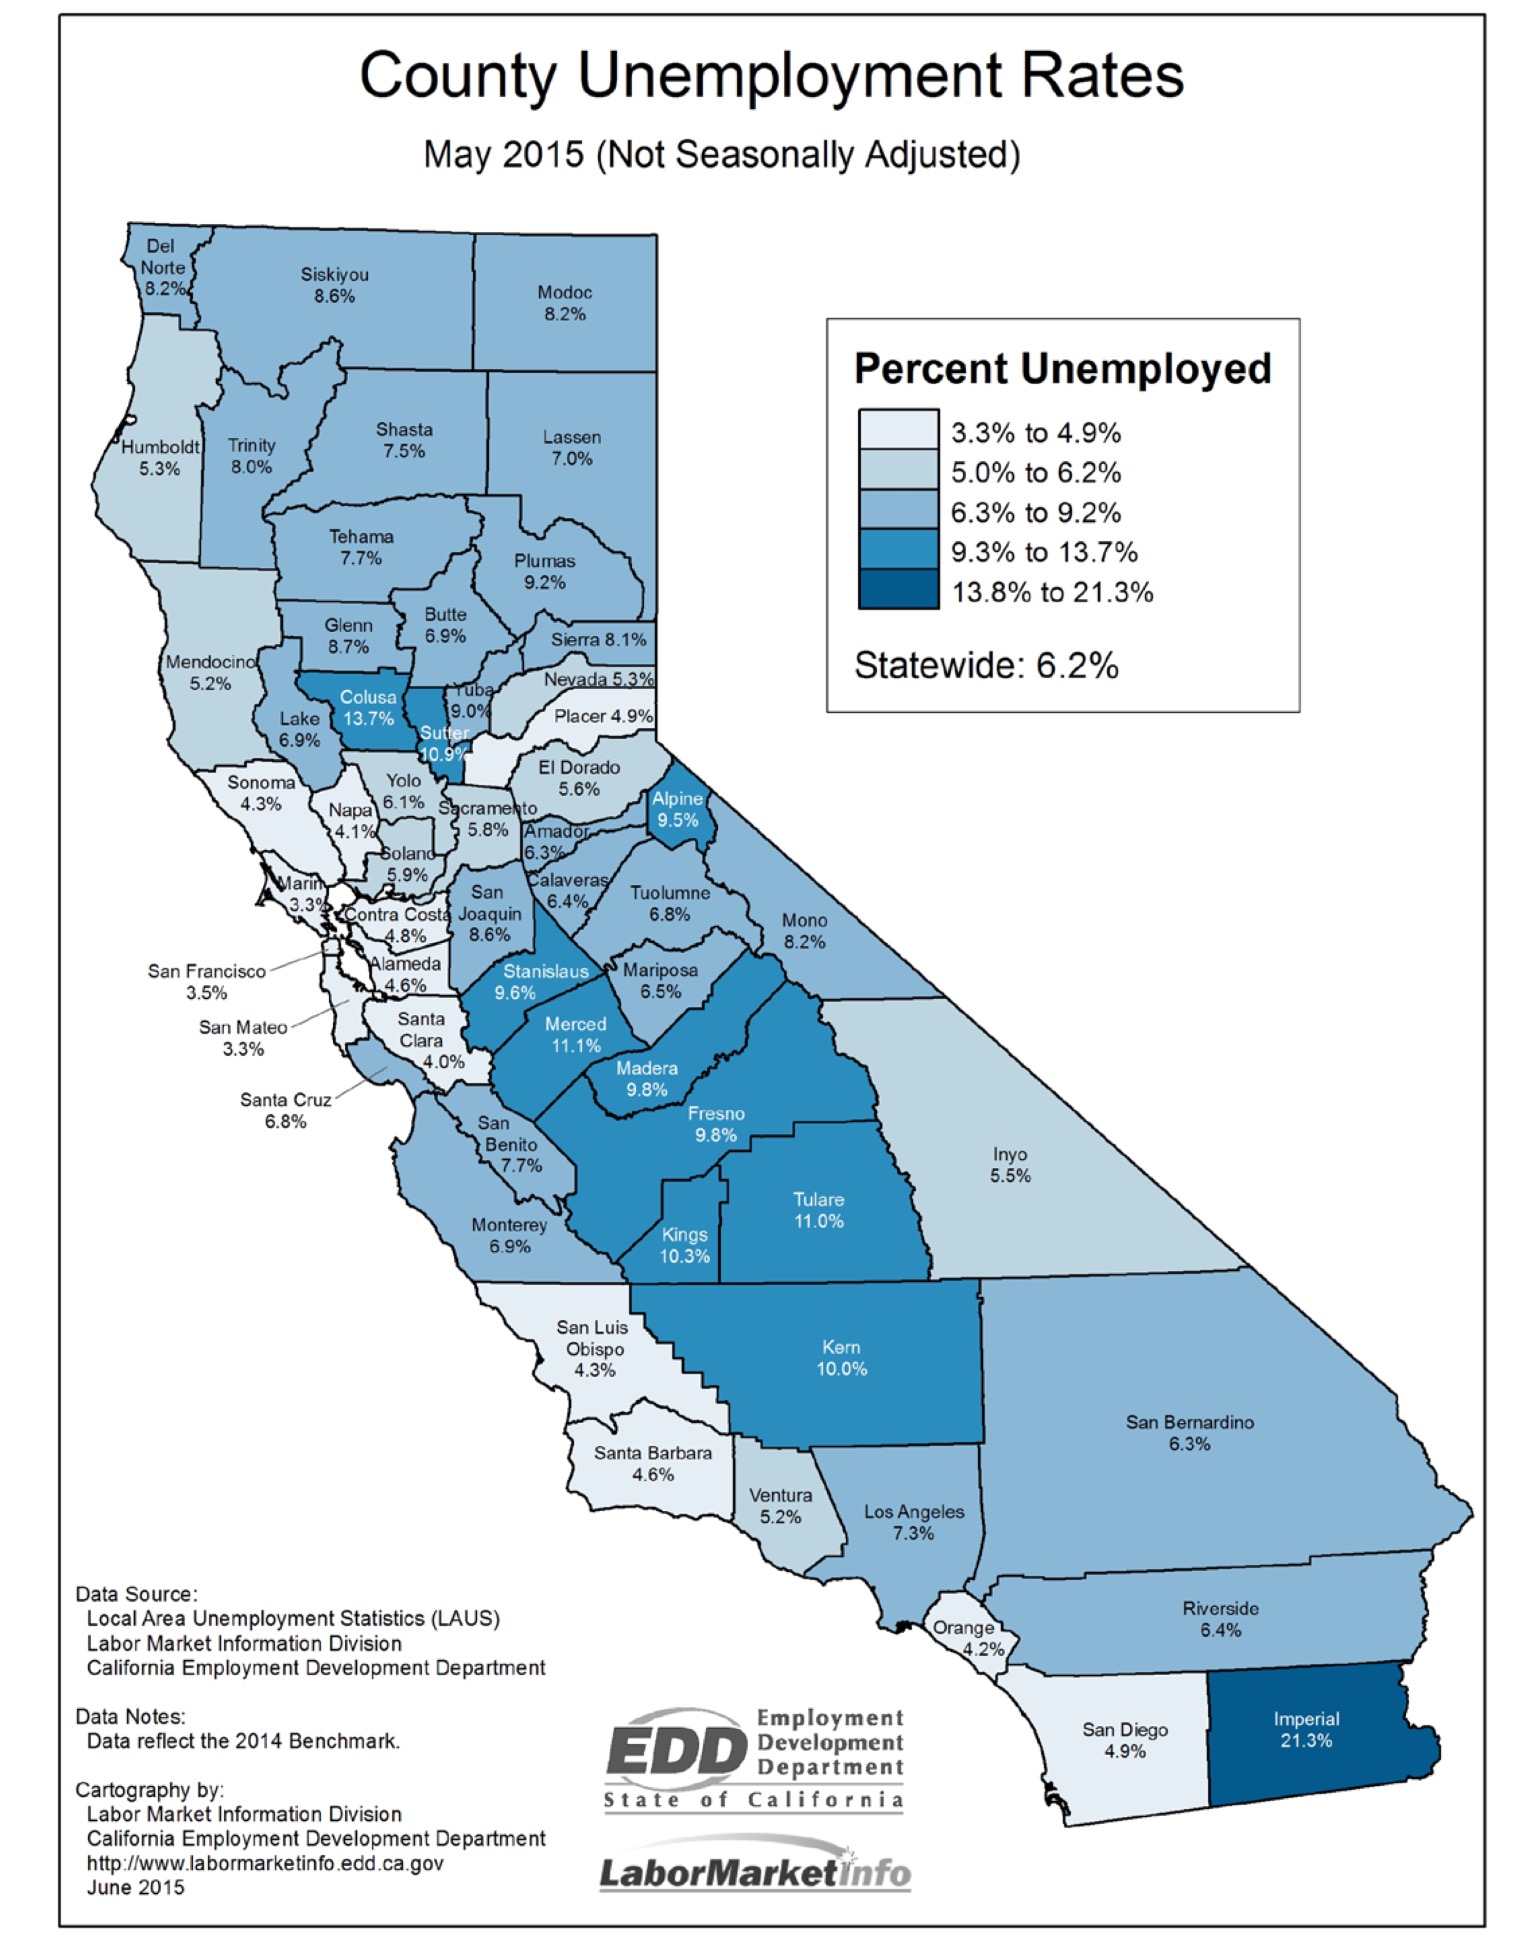
Below is another EDD map that shows the May 2015 non-seasonally-adjusted unemployment rate by region. In the unemployment rate map below, the lighter the color, the lower the unemployment rate. Darker shades indicate a higher unemployment rate.
Seasonally-Adjusted Data: Job Growth by California Metro Area Over Past Year. Below is a table that, with a few exceptions, displays seasonally-adjusted job growth data by California MSA or metropolitan division (a subcomponent of some large MSAs) over the past year. (This data often differs somewhat from the metro data discussed above, which BLS tends to communicate on a non-seasonally adjusted basis.)

Like the maps shown earlier, the table above shows the variety of job growth rates among California metros. Notably, when the combined Los Angeles/Orange County MSA is divided into two metropolitan divisions (Los Angeles County and Orange County, respectively), one can see that the Orange County job growth rate is over 1 percentage point faster than that for Los Angeles County. Similarly, the job growth in San Francisco and San Mateo Counties has outpaced that in the Oakland metropolitan division (consisting of Alameda and Contra Costa Counties) by more than 2 percentage points. For MSA classification purposes, the San Francisco and Oakland metropolitan divisions also are combined.