May Revision: LAO Revenue Outlook
May 16, 2015
For all of our office's responses to the Governor's May Revision, see our May Revision page here.
We have prepared our main scenario outlook for revenues of California's General Fund through 2017-18. The LAO's main scenario revenue outlook is based on our main scenario economic outlook, which we described online on May 15 here.
Our main scenario assumes continuing economic growth and slow growth in stock prices over the next few years. This scenario reflects our current best guess about near-term economic conditions, but no one can reliably predict many of the key variables that affect California finances, especially stock prices (which are unpredictable even in the near term). Therefore, it is important to note that alternative economic scenarios could result in very different outlooks for General Fund revenues.
Revenues: Big Picture
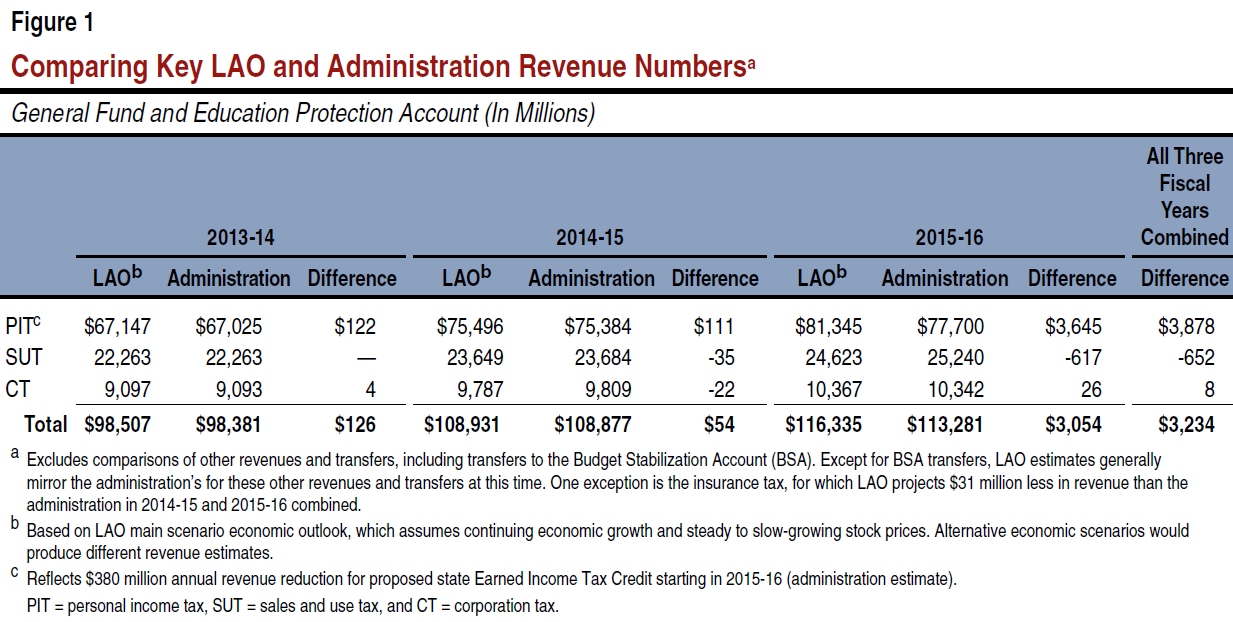
Higher LAO Revenues. As shown below in Figure 1, our main scenario outlook suggests that revenues of the three-largest General Fund taxes will total $3.1 billion more than the administration's new May Revision projections in 2015-16. For the 2013-14, 2014-15, and 2015-16 fiscal years combined, the LAO main scenario indicates a total of $3.2 billion more General Fund revenues from these three taxes compared to the administration's new projections. Over these three years, our personal income tax (PIT) numbers total $3.9 billion more than the administration projects, with nearly all of the difference in 2015-16. Our PIT totals are partially offset by a more than $600 million lower sales and use tax (SUT) estimate for 2015-16. Aside from the "Big Three" taxes shown in Figure 1, we currently have almost no concerns with the administration's other tax, fee, and transfer estimates.
Most of the Higher Revenues Go to Propositions 98 and 2. Our May Revision revenue and expenditure outlooks attempt to incorporate the effects of the Governor's budget proposals, including the proposed revenue reduction from an earned income tax credit. As we noted in our earlier comments on the May Revision, most of our higher estimated revenues will be required to be spent on schools and community colleges and on requirements of Proposition 2, the state's reserve and debt payment mechanism approved by voters last year. Tentatively, it appears some of our higher revenues, if incorporated into the 2015-16 legislative budget plan, would be available to elected leaders to build bigger reserves, pay down more debts, or make new budgetary commitments. (We will release more details—including a summary of our Proposition 2, Proposition 98, and other spending estimates—and a multiyear budget outlook summary within a few days via the LAO website.)
Personal Income Tax
As shown in Figure 1, our PIT estimates are $3.6 billion above the administration’s for 2015-16. Over $2 billion of this difference appears to result from our higher estimates of taxpayers’ capital gains income.
Capital Gains. California taxes capital gains income generated from sales of stocks and other assets, and it taxes high-income individuals receiving most capital gains at higher rates. Capital gains are quite volatile, contributing substantially to the overall volatility of California's tax revenues. The state is now benefiting from a surge in PIT revenue likely related in large part to capital gains of high-income Californians. Below in Figure 2, we show Franchise Tax Board data on net capital gains reported by California residents on tax returns through 2013 (the last year for which good data is available), as well as the new administration and LAO estimates thereafter through 2018. For the 2014 tax year, for which nearly all taxes have already been collected, our current estimate is that California residents' net capital gains on PIT returns totaled $137 billion, compared to $120 billion in the administration's numbers. For 2015, assuming a flat stock market through the rest of this year, our main scenario suggests there will be around $150 billion of net capital gains, compared to $116 billion in the administration's numbers. Thereafter, despite the administration's economic forecast that assumes slowly climbing stock prices (in fact, higher stock prices than our office assumes), the administration's revenue forecast projects less in capital gains than suggested under our office's main scenario outlook through 2018.
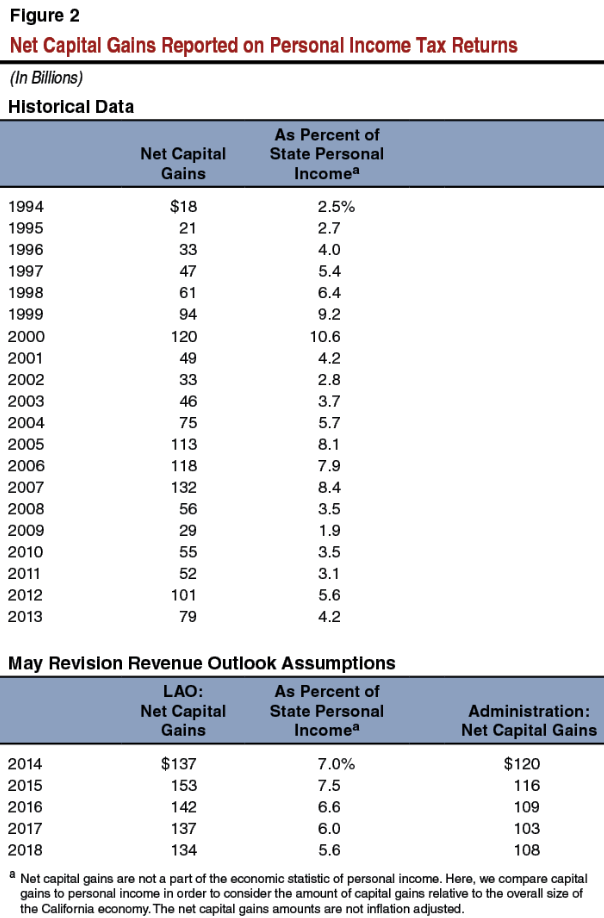
As shown above, the level of capital gains assumed in both the LAO and administration estimates in 2014 and 2015 is quite elevated in nominal terms. The capital gains figures, however, are not adjusted for inflation. Compared to the size of the California economy (measured by total personal income in the state), capital gains were more significant during the dot-com boom and the mid-2000s. Various data seem consistent with our office's 2014 and 2015 capital gains assumptions. For example, the S&P 500 stock index is much higher now than it was in 2007 and about 12 percent higher than it was one year ago. Moreover, April 2015 quarterly estimated PIT payments—largely generated from high-income earners with significant capital gains and business income—were up 17 percent from the year before.
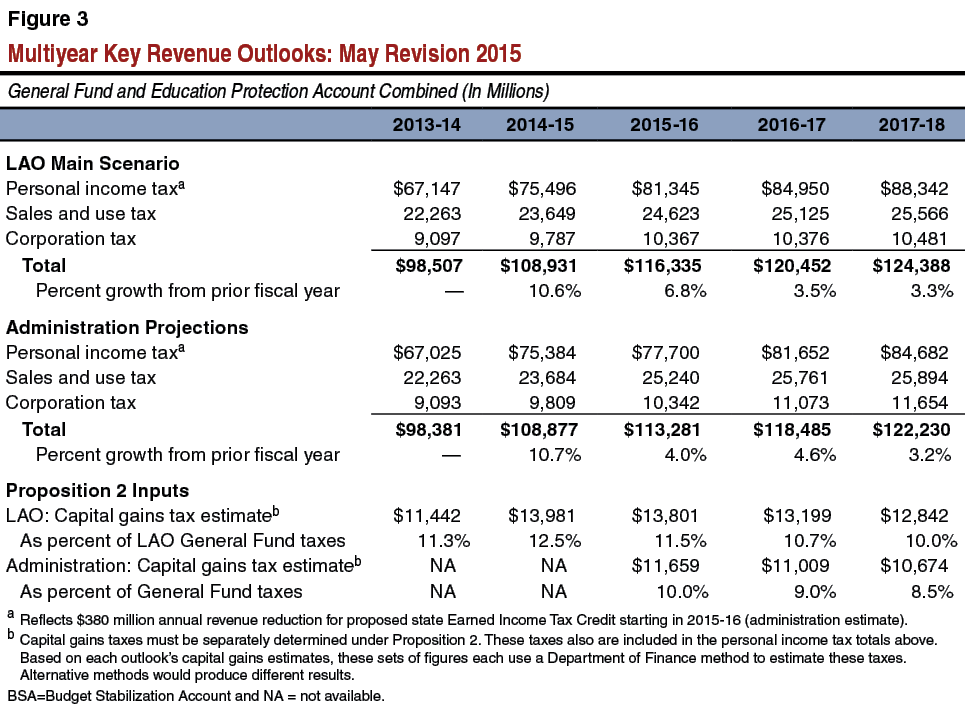
The differing capital gains numbers appear to generate most of the total difference in the two PIT estimates in 2015-16. Under Proposition 2, the state must estimate the amount of PIT resulting from net capital gains each year. Using the Proposition 2 estimating method preferred by the administration, the higher level of capital gains in our outlook generates an estimated $13.8 billion of capital gains taxes (11.5% of all General Fund taxes) in 2015-16, compared to the $11.7 billion (10.0% of all General Fund taxes) in the administration's May Revision projections. Our office's higher numbers for Californians' wage, annuity, and business income, as well as our tax deduction estimates, all contribute to the rest of the PIT estimating differences in 2015-16.
Future Volatility Certain. As we noted in our initial comments concerning the May Revision, we are clearly on the upward slope of the state’s revenue roller coaster. But just as the state's revenue picture has improved significantly over just a few months, it can just as easily reverse course with a stock market or economic downturn. There is little indication that such a downturn will occur soon, but as we discussed in our November Fiscal Outlook, such slumps can occur with little warning. If such a slump materializes before 2018, capital gains may fall sharply below levels suggested in Figure 2, and other tax revenues may fall at the same time. Proposition 2 aims to build a reserve to help address a part of this revenue volatility. The Legislature also can limit the damage to the state budget during these future downturns by treading carefully in authorizing new spending commitments or tax reductions.
Other Taxes
As shown in Figure 1 above, our corporation tax estimates are relatively close to those of the administration through 2015-16, while our sales and use tax estimates are over $600 million lower than the administration for 2015-16. Our main scenario economic outlook assumes a slowdown in retail sales growth next year, very low inflation this year, and stagnant residential building activity.
Uncertainties
Unavoidable Data Lags. There are many uncertainties involved in making estimates of California's revenues, especially the state's income taxes. As noted above, the last year for which good data is available on PIT collections is 2013. While almost all 2014 PIT revenue now has been received by the state, many high-income and other tax filers will not file their 2014 returns until the October 2015 extension deadline, and it will take months thereafter for FTB to report the overall data from millions of 2014 tax returns. For 2014, therefore, both our office and the administration must make informed estimates as to what types of income and what types of taxpayers generated all of the income taxes received to date. Overall, we think the administration's current estimates of 2014 taxable income are too low. This could contribute to some of the differences between the two sets of PIT estimates in 2015-16 and thereafter.
Complex Revenue Accruals. The state's complex revenue accrual protocols shift revenues from the year when they are collected to another year, sometimes changing a fiscal year’s revenues by hundreds of millions of dollars or more from one budget revision to the next. Accrual shifts can be identified two or more years after the ostensible closing date of a fiscal year. We have discussed the complexity and lack of transparency related to these accruals for four years now.
The state's budgeting system is becoming even more complex. The existing method of revenue accruals seems to us a needless additional distraction for the state’s elected legislators, as these changes move revenues up and down for years after passage of a fiscal year's original budget act, thereby compounding the complexity of revenue estimating that already exists due to changes in the stock market and the economy. The current accrual process has implications for school funding formulas too. We have recommended shifting to a much simpler and logical accrual system. Alternatively, we have suggested requiring the executive branch, with each budget revision, to update an “accrual guide” on a website. Such a guide could detail clearly for the Legislature and the public: (1) each accrual category and subcategory, (2) the basis for that accrual, (3) the source of the specific data underlying that accrual, (4) any adjustments to that specific data and the rationale for each adjustment, and (5) a clear listing of how all of these accruals add up to a net increase or decrease in annual budgetary revenue compared to the amount actually collected during the fiscal year. Without that information, our office will continue to be unable to independently verify the administration’s accrual estimates.
Multiyear Revenue Outlook
Below is a summary of both the LAO main scenario and the administration’s multiyear revenue outlooks for the three largest General Fund taxes. Future years’ revenues are subject to considerable uncertainty. Use of a different economic scenario would cause the outlook to be higher or lower, potentially by billions of dollars in any given year. As such, the 2016-17 and 2017-18 revenue totals shown below likely will change considerably in future estimates.