October 22, 2008

California's Water: An LAO Primer


Contents

Introduction
Chapter 1: Overview of California’s Water Governance
Chapter 2: Water Supply, Source, and Delivery
Chapter 3: Demand and Use of Water
Chapter 4: How Do We Finance Water Projects?
Chapter 5: What Drives the Cost of Water?
Chapter 6: Issues for Legislative Consideration
Glossary


Introduction

California’s water delivery system is facing a series of challenges due in part to a combination of increasingly variable weather conditions, legal requirements, and system operation and conveyance constraints. These challenges affect water availability, reliability, and delivery. Recent public and private efforts have sought ways to address these challenges. These measures include proposals to increase water through groundwater storage, surface storage, infrastructure changes, and system operation improvements, among others.

This report provides, through a “quick reference” document relying heavily on charts to present information, a snapshot of water in California. The main components of this report are:

Overview of California’s Water Governance. Chapter 1 provides a description of how California’s water system is governed, including the various roles of the federal, state, and local governments, as well as private and public water districts. This chapter also reviews key moments in history that changed water policy, from the passage of water rights legislation to the voter approval of the State Water Project (SWP).

Water Supply, Source, and Delivery. Chapter 2 provides a picture of where Californians get their water, including the factors affecting water delivery, and what infrastructure—“bricks and mortar”—exist to move water throughout the state. The source of water for Californians varies dramatically from region to region based on whether the state has a wet or dry year, as well as due to legal and other system constraints.

Demand and Use of Water. Chapter 3 highlights water demand and use, and the differences among regions, as well as residential and agricultural users. While we provide a snapshot of future water demand, the picture is highly uncertain and depends on factors ranging from weather to court decisions to the growth in California’s economy over the next several decades.

How Do We Finance Water Projects? Chapter 4 looks at how state, local, and federal entities finance water projects. We highlight the state’s largest water initiative, the SWP, and how it has been funded, as well as take a brief look at federal and local financing of water projects. In California, most water agencies use a “beneficiary pays” approach to funding water projects whereby those who benefit from a project pay for the majority of its costs.

What Drives the Cost of Water? In Chapter 5, we highlight the factors affecting the cost of water, explore what goes into a typical residential water bill, and show the trend toward higher residential water rates. We also identify factors affecting the regional differences for agricultural water prices.

Issues for Legislative Consideration. Change is inevitable in California’s water system. Chapter 6 highlights options policymakers have to make changes to California’s supply and delivery of water. From water storage to conservation, water rights to water transfers, policymakers have a breadth of options available to institute change in California water policies.

This report relies on most recent data available from several federal and state agencies, including the U.S. Geological Survey, U.S. Bureau of Reclamation, California Department of Water Resources, State Water Resources Control Board, the California Department of Fish and Game, California Department of Public Health, the California Energy Commission, Public Policy Institute of California, as well as information from private water entities, including a survey of residential water rates by the firm Black & Veatch.

Finally, there are many unique terms in the water world. Please see the glossary on page 73 for a quick reference to definitions of commonly used terms throughout this report.

Chapter 1

Overview of California’s Water Governance

Many State Agencies Are Involved in Water Management


Responsibilities

Agency

Water
Supply

Water
Quality

Flood
Control

Department of Water Resources

X


X

State Water Resources Control Board

X

X


CALFED Bay-Delta Authority

X

X

X

California Public Utilities Commission

X

X


Colorado River Board

X


Department of Pesticide Regulation


X


Department of Public Health


X


Department of Toxic Substances Control


X


Office of Environmental Health Hazard Assessment


X


  • Many state agencies are involved with water management. While overlap among agencies occurs in terms of the broad objectives addressed, generally, there is not duplication of functions. This is because most agencies focus on a specific subset of water management responsibilities. For example, both the State Water Resources Control Board (SWRCB) and Department of Water Resources (DWR)—the state’s two lead water management agencies—have mandated water supply objectives. However, their practical roles differ greatly—DWR focuses on water delivery, water supply planning, and infrastructure development, while SWRCB is more of a regulatory body, managing water rights and water quality permitting (both of which have an effect on water supply). These roles are complementary and often require the two agencies to work in concert to address water management at the state level.
  • Management of the California water system consists of three key components: water supply, water quality, and flood control. Most agencies involved in one or more of these components also have responsibilities for scientific activities and monitoring and administering financial assistance for local water infrastructure. All of these responsibilities can serve to meet multiple objectives. For example, several financial assistance programs attempt to jointly address water quality and water supply needs at the local level, thereby providing more comprehensive local water supply reliability. Other state agencies not listed may be involved with water management as part of their greater mission (for example, the Department of Conservation manages a state watershed program).

Non–State Entities Play Roles In Water Management


Responsibilities

Entity

Water
 Supply

Water
Quality

Flood
Control

Federal Agencies


Bureau of Reclamation

X


X

Army Corps of Engineers

X


X

Environmental Protection Agency


X


Geological Survey

X

X


Other Entities


Tribal governments

X

X

X

Cities and counties

X

X

X

Special districts

X

X

X

Private water companies

X


  • At the federal level, most agencies have distinct roles—for example, the United States Environmental Protection Agency focuses on water quality, while the United States Bureau of Reclamation focuses on water supply. However, these roles can overlap and potentially duplicate state efforts. For example, both state and federal entities estimate the state‘s water supply resources, although the state has a more comprehensive role though the efforts of DWR.
  • At the local and tribal levels, however, most entities play multiple roles, including both water supply and water quality ones. Local entities can be both regulated and regulatory entities, receiving permits from state agencies for water quality while in turn regulating their constituents to meet those permitting requirements. In some respects, these roles may duplicate those of state or federal efforts. For example, federal, state, and local water agencies may each be independently investigating the development of new water supply sources to potentially serve the same region of the state.
  • The 1,200–plus water districts in California perform a wide range of activities, both water and non–water related. Many districts provide more than one of the three designated water services (water delivery, sanitation, or flood control). Lighting, recreation and park, and street maintenance services are the most common non–water activities performed by the state’s water districts.

Differing Definitions of Water Regions Loom
As Challenges to Bond Fund Allocations

Department of Water Resources Hydrologic Regions

State Water Resources Control Board Regional Boards

    The water regions defined by both DWR and SWRCB, while similar, are not identical. The SWRCB works in conjunction with nine semiautonomous regional boards (each having policy–setting responsibilities) while the DWR divides the state into ten hydrologic regions governed from Sacramento headquarters. Several activities of the DWR and SWRCB require coordination among regions and between the two state agencies, such as the joint SWRCB/DWR allocation of the $1 billion Integrated Regional Water Management bond fund package (discussed further on page 47). The difference in regional governance between SWRCB and DWR will pose a challenge to these agencies as they attempt to coordinate the implementation of this bond program.

Selected Events in State Water Policy History—A Timeline

Selected Events in State Water Policy History, A timeline

Milestones in California’s State Water Project

Milestones in California's State Water Project

The Colorado River—Southern California’s
Eastern Water Source

The Colorado River, Southern California's Eastern Water Source

Legislation and Judicial Action Guide Bay–Delta Activities

Legislation and Judicial Action Guide Bay-Delta Activities


Chapter 2

Water Supply, Source, and Delivery

Where Does Water Come From?
Not All Water Flows Into Supply Stream

Where Does Water Come From? Not All Water Flows Into Supply Stream

  • Water Supply. Between 28 percent and 45 percent of water in the state in any given year is dedicated to water supply for urban, agricultural, and environmental purposes, the percentage generally depending on the level of precipitation in that year.
  • The remaining water does not necessarily go unused. In part, water from wet years replenishes groundwater basins, allows urban users and farmers to use less of dedicated water supplies for irrigation and landscaping, and provides periodic flushing flows to rivers throughout the state.

Factors Affecting Water Available For Delivery

Factors Affecting Water Available for Delivery

  • Four factors determine the availability of water for delivery for urban, agricultural, and environmental purposes: (1) weather and precipitation, (2) environmental factors, (3) system constraints, and (4) availability of groundwater.
  • Weather, including precipitation, is foremost in determining the total amount of water available in any given year for urban, agricultural, and environmental uses. Also, environmental constraints, including the amount of water required to be left in a river system for fish and wildlife purposes and protection of endangered species, determine the amount of water that can be developed for nonenvironmental purposes.
  • The development of water for use inherently involves system constraints. For example, while surface storage is part of the state’s water infrastructure, the movement of this water to its destination (conveyance) is a significant limiting factor. The state’s largest water delivery system, the State Water Project (SWP), serves only a portion of the state, mostly in Southern California, and this water must be moved through the Sacramento–San Joaquin River Delta (the Delta) where environmental requirements are a limiting factor. Local systems also face conveyance constraints, such as challenges to move water to areas higher than the water sources (requiring pumping “uphill”).

Precipitation Varies Widely Year to Year

Precipitation in Inches 1890 through 2006

  • Precipitation is generally measured as rainfall and snowfall. The “Wet Year, Average Year, Dry Year” determinations made by the Department of Water Resources (DWR) are in part based on precipitation levels, but also factor in snow pack, runoff conditions, and previous–year conditions.
  • Wet and Dry Cycles. California has experienced several multiyear periods of wet or dry cycles in the past 100 years. Also, while precipitation has varied year to year, the amount of these annual variations seem to be increasing recently.

Mix of Water Supply Sources Shifts in Dry and Wet Years

Million Acre-feet of Water, by water supply source

  • In drier years, overall water supply available to dedicated uses declines due to a lack of water coming into the system (mostly from rain and snow). Less rainfall and snow pack reduces the amount of water available through local surface water projects, and local water reuse and recycling projects. During such dry years, local groundwater use increases.
  • Some water projects are designed to lessen the negative impact of dry–year conditions. For example, the SWP, federal water projects, and Colorado River Project systems were developed with multiple storage and conveyance facilities (and associated water rights). As a result, these surface water projects are not significantly impacted by single dry–year conditions. The ability to store water from year to year lessens the fluctuation in these systems, though in multiple dry years, the water supply from these systems is reduced.
  • During wet years, as more water is drawn from mainly surface water supplies, groundwater systems “recharge” or fill up (similar to a sponge soaking up water). This water is then available in relatively more abundance during dry years when surface water supply is lower.

Groundwater Is a Major Contributor to State’s Water Supply, More So in Dry Years

Groundwater is a major contributor to state's water supply, more so in dry years

  • Groundwater supplies around 30 percent of California’s overall dedicated water supplies in average precipitation years and up to 40 percent in dry years. Groundwater is both managed and regulated locally in most areas of the state.
  • In some areas where surface supplies are not accessible or economically feasible, groundwater supplies 100 percent of a community’s public water.
  • About 43 percent of Californians obtain at least some of their drinking water from groundwater sources.

Surface Storage Capacity Concentrated in Northern and Central Foothill Areas of the State

Surface Storage capacity concentrated in northern and central foothill areas of the state

  • California’s major water systems, located in the northern, central, and eastern parts of the state, all have large surface storage facilities (mainly dams and reservoirs). Counties with the highest capacity of surface storage (Shasta, Butte, and Tuolumne) also host three of the largest reservoirs in the state. In California, the DWR Division of Dam Safety regulates 1,200 dams with around 21 million acre–feet (MAF) of combined storage capacity, with the remaining about 17 MAF of capacity under federal jurisdiction.
  • Most dams in California were built before 1975. However, since that time, local surface storage development has continued, with notable developments including the 800,000 acre–foot Diamond Valley Reservoir serving the Metropolitan Water District of Southern California in Riverside County completed in 1999.
  • Most of the largest reservoirs in the state are owned by the federal government with the balance owned by the state, local government, or private entities.

California’s Largest Surface Storage Owner
Is the Federal Government

Owners with reservoir capacity totaling over 500,000 acre-feet

  • The federal government has developed the most surface storage capacity in the state with over 17 MAF of capacity in ten reservoirs on multiple river systems. These reservoirs generally are part of the federal Central Valley Project (CVP), which serves about 3.1 million people, and provides irrigation water to over 2.6 million acres of land. The largest reservoir in the system is Shasta Lake with 4.6 MAF of capacity.
  • The state, as part of the development of SWP, built Oroville Dam and reservoir on the Feather River system with a capacity of 3.5 MAF. The SWP provides all or part of the drinking water supply for 23 million people and provides irrigation water to about 755,000 acres of land.

Delta Is at the Heart of The California Water System

Delta is at the heart of the california water system

  • Water flowing through the Delta is the main source of supply for two major California water delivery projects, the SWP and the federal CVP. From these projects, a majority of Californians rely on water flowing through the Delta for all or part of their drinking water. In addition, approximately one–third of the state’s cropland uses water flowing through the Delta.
  • The state has spent over $3 billion since 2000 in the CALFED Bay–Delta Program (CALFED) to help protect and restore the Delta. The objectives of the program—which involves 25 state and federal resource agencies—are to (1) provide good water quality for all uses, (2) improve fish and wildlife habitat, (3) reduce the gap between water supplies and projected demand, and (4) reduce the risks from deteriorating levees. A number of current and ongoing planning efforts, including the “Delta Vision” process, could fundamentally redefine CALFED’s future and the state’s funding and policy priorities for the Delta.

State Water Project Moves Water,
Mainly From North to South

State water project moves water, mainly from north to south

  • Disconnect Between Water Supply and Water Demand. Water supply in California does not naturally occur where demand is highest. Much of California’s rainfall occurs in the north, while much of the demand for water is in the south. As a result, the SWP has been developed as a complex system for storing and transporting water through much of the state, as shown on the map.
  • Storing and Transporting Water. The need to store and transport large quantities of water creates its own challenges to formulating statewide water policy. For example, water transported south from SWP facilities must first make its way through the Delta, which creates environmental and land–use pressures. Proposals to bypass the Delta with either a Peripheral Canal or other conveyance system have been proposed over the years, and such alternative conveyance systems continue to be evaluated today.
  • SWP Extensions. The SWP continues to evolve with recent extensions approved, including the Coastal Aqueduct to serve coastal areas down to Santa Barbara and the East Branch Extension serving areas near Riverside.

Population Centers Rely Heavily on Water Imported From Other Regions of the State

Population centers rely heavily on water imported from other regions of the state

  • Four of the state's ten water basins depend significantly on water imported from other regions of the state. These four basins, which are largely urbanized and/or agricultural regions in the central and coastal parts of the state, account for almost one–half of urban and agricultural water use statewide.
  • Surface Water Storage. As the state’s water supply largely originates in its northern region, extensive surface water projects (dams, reservoirs, and aqueducts) have been built, supplying about 68 percent of statewide urban and agricultural water use.

Who Are California’s Top Five Water Rights Holders?

Federal Government Is the Top Water Rights Holder in California

Permitted water rights, in million acre-feet

  • A water right is legal permission to use a specified amount of water for a beneficial purpose such as drinking, fishing, irrigation, farming, or industry. The State Water Resources Control Board regulates water rights for those taking water from lakes, rivers, streams, and creeks. It does not regulate the rights to use underground water supplies, which are primarily regulated by a patchwork of local laws.
  • The federal government, through the Bureau of Reclamation, holds the most (in volume) water rights in the state with over 112 MAF of water held, mainly for delivery through the federal CVP. Second to this are the water rights held by the Imperial Irrigation District (44 MAF), serving mainly farms in the Colorado River region. Two private gas and electric companies hold rights to over 41 MAF of water collectively, mainly for hydroelectric power. The state, through DWR, holds rights to about 31 MAF of water.

Most Water Rights Held by Federal Government, Irrigation Districts, and Utilities (a)

Percent of water rights held

    Of the top 25 water rights holders (generally those with rights to use over about 1 MAF of water), the federal government holds much of the water rights, while irrigation districts and utilities make up much of the rest of the water rights holders. State and urban local agencies hold less than 20 percent of the water available to the top 25 water rights holders.

    Chapter 3

    Demand and Use Of Water

Use of Water Changes Significantly From Wet to Dry Years

Use of water changes significantly from wet to dry years

  • The total amount of water supply available in any given year for dedicated uses varies greatly depending on precipitation levels—from about 65 million acre–feet (MAF) in a dry year to about 95 MAF in a wet year. In addition, the allocation of water among urban, agricultural, and environmental uses also varies greatly between wet and dry years.
  • Water dedicated for environmental uses, including instream flows, wild and scenic flows, required Sacramento–San Joaquin River Delta (the Delta) outflow, and managed wetlands use, declines substantially between wet and dry years—a 62 percent reduction.
  • Available water supplied to agricultural and urban users actually increases in dry years. From wet to dry years, urban use increases by 10 percent and agricultural use increases by 20 percent. The main reason for this increase is the need in dry years for more developed water for agricultural irrigation and residential landscaping.
  • Agricultural and urban uses draw their water from California’s “developed water supply.” This supply is the amount of precipitation, surface water, or groundwater made available for use, generally through construction of storage or delivery systems. By contrast, environmental uses depend mostly on non–developed water supply, such as instream flows.

Water Use Growing More Slowly Than Population

Water use growing more slowly than population

  • Water used for urban and agricultural purposes has generally remained stable, and has even declined at times, even though population has increased. Since the 1980s, the state has enacted multiple conservation measures to assist local entities, mainly cities where the majority of the population lives, in reducing water consumption. These measures have included low–flow toilets, showerheads, and landscape irrigation improvements, and have resulted in decreases in per capita water use in some areas.
  • Agricultural water use has also remained relatively stable, as has the amount of acreage used for agriculture, over the last several decades. However, it is anticipated that agricultural water use will decline in future years for a variety of reasons, as discussed on the next page.

Future Agricultural Water Use Likely to Drop, While Urban Use Remains Uncertain

Million acre-feet

  • California is likely to see a drop in agricultural water use in the future, under most forecasts produced by the Department of Water Resources (DWR). This is due to increases in agricultural water efficiency, changes in the use of farmland requiring less water (in some cases the conversion of land for other uses, or shift to higher valued crops using less water), and the likely increase of transfers from agricultural areas to cities to meet growing urban water supply needs.
  • Future changes in the urban use of water, including residential and commercial, is more dependent on the state’s policy priorities for water use efficiency and environmental protection. For example, the “more water intensive economy” scenario developed by DWR for the year 2030 envisions relatively higher use of water in agricultural and industrial sectors, with no more water being dedicated for environmental purposes and less emphasis on water use efficiency than currently. Alternatively, if water use efficiency and the environment take greater precedence in state priorities, DWR’s scenarios envision less water being used in cities and towns in 2030 than currently.
  • Changes in water policy and legal rulings will have major impacts on how these scenarios change over time. Examples include the Governor’s recent proposal to reduce per capita water use in urban areas by 20 percent, the SWRCB’s statewide water recycling regulations, and judicial determinations on the amount of water that can be delivered from the Delta due to endangered species laws.

Urban Inland Water Use Higher Than Coastal and Statewide Average

Gallons per capita per day of urban water use

  • Per capita water use among urban users varies substantially between inland and coastal areas of the state. In general, urban per capita water use recently has been declining overall in California, with coastal areas generally following this trend. However, inland areas, where hotter climates tend to occur, have increased per capita water use in recent years in part due to increased use of water–rich landscaping.
  • Overall Decline Due to Conservation. Various conservation programs over the years, mainly state bond funded and locally funded, have contributed to the decline in overall per capita water use in California’s urban areas.

Same Crop, but Different Water Use by Region

Acre-feet of water for each acre of crop land per year

  • Agricultural Use of Water Significant. California agriculture uses roughly 30 MAF of water a year on 9.6 million acres. California’s vast water infrastructure—including the development of the State Water Project, Central Valley Project, and Colorado River, as well as local and regional groundwater supply projects—was developed to provide water for irrigation (among other purposes), with agriculture using about 80 percent of California’s developed water supply.
  • Same Crops, but Different Water Use by Region. On average, the same crop will use different amounts of water depending on the region the crop is grown in. For example, tomatoes grown in the Central Coast use less than one–half the water as in the Colorado River region.
  • Agricultural Use of Water Affected by Multiple Factors. The amount of water used to grow a particular crop varies widely by region. While business decisions for agricultural water use largely focus on climate conditions (hot, dry weather would require more water), there are a number of other factors that influence the amount of water used to grow a particular crop. These include: (1) soil type, (2) water supply source (groundwater to be pumped or surface water delivered), (3) the amount of water rights held by the farmer (water rights in California have a “use it or lose it” clause as described on page 68), and (4) the particular use of other inputs needed to grow a crop (for example, some fertilizers or pesticides require more water to apply).

    Amount and Use of Water Varies
    Among Water Basins(a)

    Million acre-feet

    • Water Basin Variation. There is substantial variation among the state’s water basins in the amount of water used for urban, agricultural, and environmental uses. In general, urban areas use less water than agricultural areas. Environmental water use, or water that is generally required to maintain fish and wildlife habitat, tends to be higher in the northern part of the state.
    • Future Water Use. Overall, DWR projects statewide water demand to remain the same or decline slightly between 2000 and 2030 under current conditions. However, urban and environmental uses are projected to increase, while agricultural uses are projected to decline.

Chapter 4

How Do We Finance Water Projects

Various Approaches Available to Finance Water Infrastructure

Three Financing Approaches. Generally speaking, there are three main approaches available for public agencies to finance the acquisition and/or use of capital infrastructure. (These approaches are distinct from the separate issue of what funding source[s] will ultimately be used to pay for the infrastructure.) These approaches include:

  • Pay–As–You–Go. With this approach, infrastructure projects are paid for directly from current revenues. Typically, a portion of a local water project is financed using a pay–as–you–go financing mechanism. The state has also used a pay–as–you–go approach for capital investment in some flood control projects.
  • Renting and Leasing. This can sometimes be feasible where privately owned infrastructure (such as a privately owned desalination or wastewater treatment plant) is available for public use. In these cases, the governmental entity makes rent or lease payments to the private owner of the particular infrastructure. Somewhat rare in the water world, this approach may be increasingly used by public agencies as private investment in water infrastructure increases.
  • Bond Financing. By far the most common form of infrastructure financing, this approach typically involves the governmental entity borrowing money to be paid off over time to build or acquire long–lived capital facilities that generate services over many years.

Bonds Are the Major State Financing Approach for Water Infrastructure

    Two Types of Bonds. The state has traditionally used two major types of bonds to finance water infrastructure. The key difference between the two types of bonds is the source of funds to pay back this debt.

    General Fund-Supported Bonds

    Revenue Bonds

    •    These are paid off from the state’s General Fund, which is largely supported by tax revenues. The majority of these are general obligation (GO) bonds. These bonds must be approved by voters and their repayment is guaranteed by the state’s general taxing power.

    In the case of the State Water Project (SWP), however, GO bonds were paid back mainly by user fees, while remaining guaranteed by the state’s general taxing power


    •    The second type is lease-revenue bonds, which are authorized by the Legislature. These are paid off from lease payments (primarily financed from the
    General Fund) made by state agencies using the facilities they finance. These bonds do not
    require voter approval and are not guaranteed. As a result, they have somewhat higher interest costs than GO bonds.

    •    These also finance capital projects but are not supported by the General Fund. Rather, they are paid off from a designated revenue stream—usually generated by the projects they finance—such as water user assessments. These bonds also do not require voter approval.

Authorized Amount of Water–Related Bonds

1970 through 2006, in billions

    Total Water Bonds Authorized. Since 1970, the state’s voters have authorized over $23.4 billion in water–related general obligation (GO) bonds, mainly for water quality and drinking water purposes (see next page). (Typically, these bond measures also included funding for other resource–related purposes as well, such as land conservation and habitat protection.) However, 84 percent of this amount (about $19.6 billion) was authorized since 2000. This included the single largest water bond ($5.4 billion) in California history in 2006. (Not all of these bonds have been issued yet.) A major change in 2006 was the inclusion of flood control as a major purpose in a statewide bond. A complete listing of water–related bonds is shown on the following page.

Water-Related Bonds

1970-2006
(In Millions)

Year

General Obligation Bond

 Amount Authorized

1970

Clean Water Bond Law of 1970

$250

1974

Clean Water Bond Law of 1974

250

1976

California Safe Drinking Water Bond Law of 1976

175

1978

Clean Water and Water Conservation Bond Law of 1978

375

1982

Lake Tahoe Acquisitions Bond Act

85

1984

California Safe Drinking Water Bond Law of 1984

75

1984

Clean Water Bond Law of 1984

325

1984

Fish and Wildlife Habitat Enhancement Act of 1984

85

1986

California Safe Drinking Water Bond Law of 1986

100

1986

Water Conservation and Water Quality Bond Law of 1986

150

1988

California Safe Drinking Water Bond Law of 1988

75

1988

California Wildlife, Coastal, and Park Land
Conservation Act

776

1988

Clean Water and Water Reclamation Bond Law of 1988

65

1988

Water Conservation Bond Law of 1988

60

1996

Safe, Clean, Reliable Water Supply Act

995

2000

Safe Drinking Water, Clean Water, Watershed
Protection, and Flood Protection Act

1,970

2000

Safe Neighborhood Parks, Clean Water, Clean Air, and Coastal Protection Bond Act of 2000

2,100

2002

California Clean Water, Clean Air, Safe Neighborhood Parks, and Coastal Protection Act of 2002

2,600

2002

Water Security, Clean Drinking Water, Coastal and Beach Protection Act of 2002

3,440

2006

Disaster Preparedness and Flood Protection Bond Act of 2006

4,090

2006

Safe Drinking Water, Water Quality and Supply, Flood Control, River and Coastal Protection Bond Act of 2006

5,388


   Total

$23,429


State Water Project: Mainly Bond Financed,
Paid Back by Users

In Billions

  • From 1952 to 2007, funding to build the State Water Project (SWP) totaled about $6.4 billion, mainly from revenue bonds and GO bonds.
  • When the revenue and GO bonds are paid off, it is estimated that those entities who receive the water from the SWP (“contractors”) will have paid for about 96 percent of the cost of building the project. The remainder is paid by the state, to cover fish, wildlife, and recreation enhancements associated with SWP, and the federal government, primarily for flood control benefits.

Recent Voter–Approved Water Bonds Shifting Focus to Water Management

Recent Voter-Approved water bonds shifting focus to water management

  • Since 1996, voters have approved over $14 billion in GO bonds for water–related purposes. Prior to 2006, water bond funds were allocated among the CALFED Bay–Delta Program (CALFED) (largely focused on the San Francisco Bay/Sacramento–San Joaquin Delta estuary), water quality, and water management activities.
  • Recent bonds have not provided funding explicitly for CALFED. They have instead funded water quality and placed an increased focus on water management. The latter category addresses water supply, flood control, and water conservation/recycling requirements.
  • The increased emphasis on water management is also reflected in bond funding through local assistance to the Integrated Regional Water Management Program (IRWM). Under IRWM, locals submit to the state a regional water management plan addressing issues including water supply reliability, water use efficiency, stormwater, and flood control, among others in order to become eligible for bond funds for projects identified in the regional plan. The program is jointly managed by the Department of Water Resources and the State Water Resources Control Board.

“Beneficiary Pays”— A Reasonable Funding Policy

Beneficiaries of water projects or programs can include

  • Beneficiary Pays Principle. On a number of occasions, the Legislature and state water program administrators have stated their intent that the costs of state water programs and projects should be paid by those who benefit from them. This is referred to as the “beneficiary pays” funding principle. A water program or project may benefit a clearly defined subset of the state’s population (for example, individual water users receiving deliveries from a water project), the public as a whole (for example, from fish and wildlife habitat enhancements), or reflect a combination of private and public benefits.
  • At the state level, current examples of the application of the beneficiary pays principle are found in most water programs, including the financing of CALFED, SWP, flood control projects, and water quality and water rights regulation. For example:
    • Flood Control Projects. The nonfederal share of costs for a federally authorized flood control project are split between the state and the local governments that benefit directly from the project.
    • The SWP. Capital and operational costs of the SWP are generally paid for by water agencies receiving SWP water deliveries. However, fish, wildlife, and public recreational enhancements benefiting the general public are paid from the state’s general–purpose funds.
    • Surface Storage Water Projects. Beneficiaries of surface water storage projects that proceed to construction are required to reimburse all prior planning expenditures made from the state’s General Fund.

Users Pay a Significant Portion of Federal Central Valley Project Costs

Users pay a significant portion of federal central valley project costs

  • The federal Central Valley Project (CVP) is a network of dams, canals, pumps, and other facilities solely in California providing water for agriculture and other uses, similar to SWP. However, unlike SWP that provides the bulk of its water to urban users, CVP provides the majority of its water to agriculture.
  • Irrigation water users pay about 55 percent of CVP reimbursable costs ($1.6 billion), while municipal and industrial water users are responsible for the remaining 45 percent (or about $1.3 billion). These reimbursements are paid through long–term contracts with water agencies.
  • The total capital cost to construct the CVP as of September 30, 2006, is about $3.4 billion. The federal Bureau of Reclamation calculates how much of the capital construction cost is reimbursable from water users. Currently, users pay about 85 percent of total costs. In contrast, more than 95 percent of SWP’s costs are reimbursable from water users. The costs assigned to such CVP purposes as flood control, navigation, and fish and wildlife needs are not reimbursable and are paid by the federal government.

Local Water Projects Use Multiple Funding Sources

Local water projects use multiple funding sources

  • Revenue Bonds Mainly Used. While local agencies generally have funding sources similar to the state and federal governments, they mainly use revenue bonds supported by fees paid by local water users. General obligation (GO) bonds backed by property taxes have also been used by local governments. Local agencies also are able to access state revolving loan programs mainly for water quality infrastructure (such as wastewater treatment plant improvements or to meet safe drinking water standards), as well as state–local assistance grants from statewide bond funds. In many cases, these state programs require a local match or share of cost.
  • Cash Versus Revenue Bonds: Size of Project Affects Local Financing Approach. Many local entities have long–term capital plans which fund at least part of a project with cash reserve.
    • When project costs go beyond cash availability, revenue bonds are generally used to make up the difference. For example: The Diamond Valley Reservoir—a $2 billion, 800,000 acre–foot reservoir developed by the Metropolitan Water District of Southern California (MWD)—was funded approximately 80 percent from revenue bonds and 20 percent in cash from MWD’s current revenues (user fee revenues and investment income).
    • In contrast, a smaller project, the City of Santa Cruz Bay Street Reservoir Reconstruction Project—a $20 million, 107 acre–foot reservoir reconstruction—was fully funded by cash on a pay–as–you–go basis with 80 percent funded by water rates and 20 percent from connection fees (paid by developers for construction projects).

    Local Financing—Special Water Districts Largely Turn to Beneficiaries for Funding

    Local Financing: Special Water Districts Largely Turn to Beneficiaries for Funding

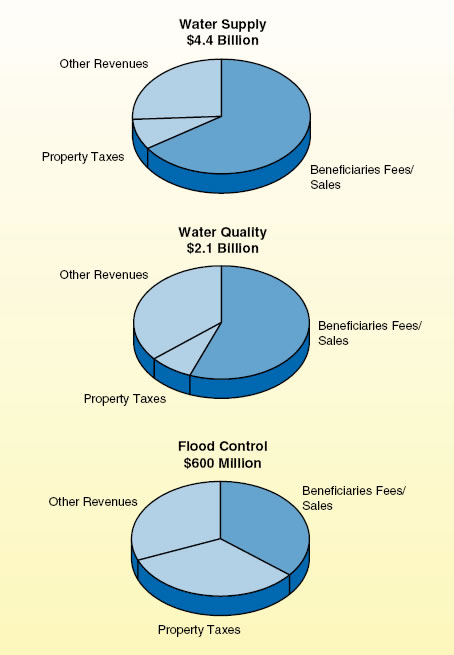
    • The Role of Water Districts and User Fees. Although many cities and counties provide water services, special districts also provide these functions. Special districts provide a number of water services including water delivery, waste disposal (sanitation), and flood control. User fees—customer charges for the cost of the services they use—represent the largest source of revenues for these activities (more than 60 percent). These fees can be used to repay bonds, or for pay–as–you–go, renting, or leasing payments.
    • The Use of Property Taxes. Depending largely on historical decisions, some water special districts receive an allocation of property taxes to support their operations. In order to support large capital projects, some special water districts seek voter authorization (two–thirds vote required) for local GO bonds backed by property tax levies.
    • Flood Control Funding. Property taxes provide about one–third of flood control district revenues. Other major sources of revenues include development fees, benefit assessments, and intergovernmental aid.
    • Other Revenues. These revenues include interest earnings, various taxes and assessments, and grants from government agencies.

    How Does Proposition 218 Affect Local Authority to Finance Water Programs?

    Background. Proposition 218, approved by the state’s voters in 1996, restricts local governments’ authority to raise property owner fees, taxes, and assessments. The measure also permits residents to use the initiative process to repeal or reduce local fees, taxes, and assessments. The provisions of Proposition 218 affect the financing of water programs, including water supply delivery, flood control, and stormwater services, as discussed below.

    Water Supply Delivery Service

    Many local governments charge property owners user fees for water delivery. Prior to increasing these fees, a government must notify fee payers, hold a hearing, and reject the increase if a majority of the fee payers submit written protests. In some cases, Proposition 218 does not allow governments to charge property owners user fees. For example, government may not impose fees to finance the future expansion of a water system. To raise revenues for these purposes, government may impose taxes, assessments, or fees on developers. (We discuss Proposition 218’s requirements regarding these other revenue sources below.)

    Stormwater Services

    Local governments finance stormwater clean–up services from revenues raised from a variety of fees and, less frequently, through taxes. Property owner fees for stormwater services typically require approval by two–thirds of the voters, or a majority of property owners. Developer fees and fees imposed on businesses that contribute to urban runoff, in contrast, are not restricted by Proposition 218 and may be approved by a vote of the governing body. Taxes for stormwater services require approval by two–thirds of the electorate.

    Flood Control Programs

    Local governments sometimes impose assessments on property owners to pay for flood protection programs. Under Proposition 218, the dollar amount of each property owner’s assessment reflects the owner’s relative benefit from the program and improvements financed by the assessment. A majority of property owners must approve new assessments, with each vote weighted in proportion to the property owner’s assessment liability. Governments may only impose assessments for programs and improvements that provide a distinct benefit to land or buildings. Programs and improvements that benefit the public at large (such as a regional recreational facility) may be financed with taxes, approved by a two–thirds vote of the electorate.

    Chapter 5

    What Drives the Cost of Water?

    Factors Affecting the Cost of Water Delivery—From the Water Supplier’s Perspective

    Factors affecting the cost of water delivery: from the water supplier's perspective

    Rising Energy Costs a Major Driver In State Water Project Cost Increases

    Cost Drivers

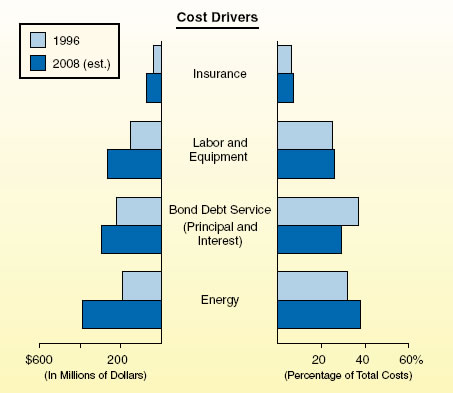
      Annual State Water Project (SWP) costs have increased from $600 million in 1996 to about $1 billion in 2008. While bond–related costs for capital projects have increased by about 34 percent, the majority of the increase is for operations and maintenance of the system. Over this period, labor and equipment costs have increased $116 million—a 77 percent increase. Energy costs to run the system have more than doubled—from $192 million to $389 million.

    Residential Water Rates Going Up, and Vary by Region

    Residential Montly Water Charge Comparisons

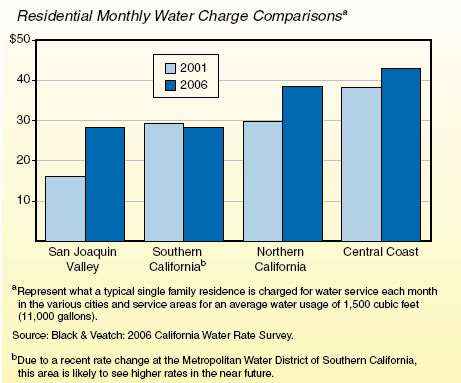
      Residential water rates vary regionally, although not as much as agricultural rates (see page 62). Coastal regions (including the Central Coast) pay the highest residential water rates, mostly due to the cost of transporting and treating surface water delivered from other regions (such as from the SWP or Colorado River). In other regions, the combination of available clean groundwater and surface water reduces the consumer price by diversifying the sources of water supply in wet and dry years.

    What a Water Bill Pays For

    Sample Nonagricultural water bill

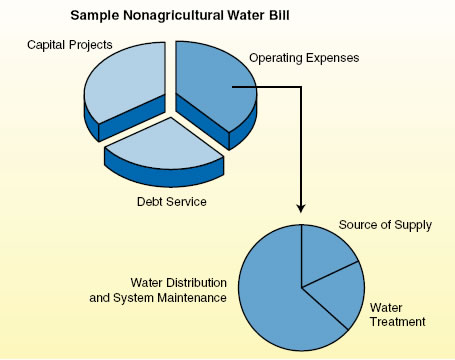
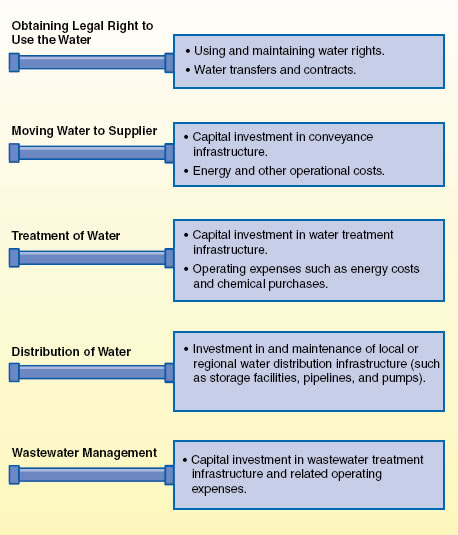
    • Many factors affect the rates paid by most nonagricultural water users statewide. In a typical urban water agency, the budget is split between operating and capital/debt service expenditures. Most often, capital and debt service are as high or higher than operating expenditures given the cost of developing capital infrastructure. The relative share of these costs varies greatly among water agencies depending on the need for capital infrastructure.
    • Within operating costs, most agencies have ongoing costs for purchasing water (such as from the SWP or other water rights holders), distribution costs (including energy payments, labor, and maintenance), and water treatment (including chemical purchases, labor, and facility operations).

    Agricultural Price of Surface Water: Central and South Coast Farmers Pay Much More

    Agricultural Price of Surface Water: Cost per acre-foot

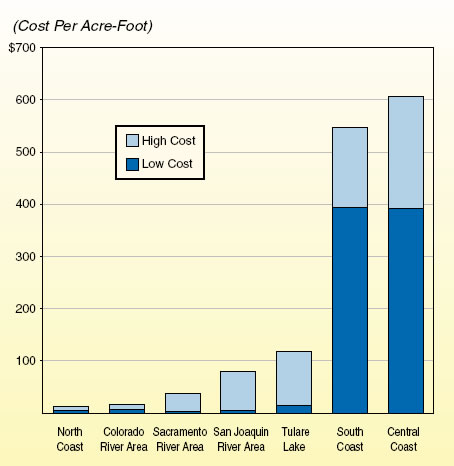
    • The cost of surface water delivered to agricultural consumers varies widely between two coastal areas and the rest of the state. In the Central Coast and South Coast hydrologic regions, most agricultural consumers are charged prices closer to residential rates, reflecting the high cost of the water delivery systems bringing water from other regions of the state (mainly the SWP). Lower prices in other regions can be attributed to a number of factors, including more abundant local surface water supplies, capital storage and delivery systems that are largely paid off, and lower–cost contracts for water.
    • The cost of agricultural water, among other factors, is related to the type of crops grown. For example, the South Coast and Central Coast regions are well known for specialty crops, such as artichokes, strawberries, avocados, and citrus, which are also supported by the types of soil and climate conditions in these areas. The relatively high value of these crops helps support the relatively high cost of water required to grow them. In areas where water costs are less, row crops (such as cotton, wheat, corn, and tomatoes) are more likely to be found. This is due to a number of factors, with the abundance of low–priced water being one factor among many.
    • Potential for Lower Costs in Coastal Areas. In some coastal regions, agricultural users contract with their water suppliers for lower prices in exchange for an agreement to take less water during dry seasons. In these cases, farmers would take higher reductions in water deliveries than their urban counterparts in dry years in exchange for lower rates over time.

    Chapter 6

    Issues for Legislative Consideration

    Key Considerations for Water Policy Decisions

    Throughout this primer, we have shown the many dimensions of water in California, from who uses it, to its cost, to legal provisions governing its management. A few themes arise from these pages, including the complexity of the water supply system; the challenges of conveying water to those who need it, particularly through the Delta region, and to those with limited access to regional water supply; and the importance of having a reliable and sufficiently high–quality water supply to meet average demand.

    In this section, we address several key water policy issues that legislators will likely face in both the short term and long term and make recommendations for legislative action. Given competing demands for funding, it is important for the state to focus on cost–effective solutions and to ensure that its water supply and water quality programs are coordinated and administered efficiently and effectively. The overarching theme of our recommendations is to improve the management of water within the state—both in terms of how currently available water is allocated among uses and the level of flexibility of water delivery systems to meet demand as conditions (such as extended dry periods) change in the future.

    Future Water Supply Reliability Requires Focus on Cost–Beneficial Solutions

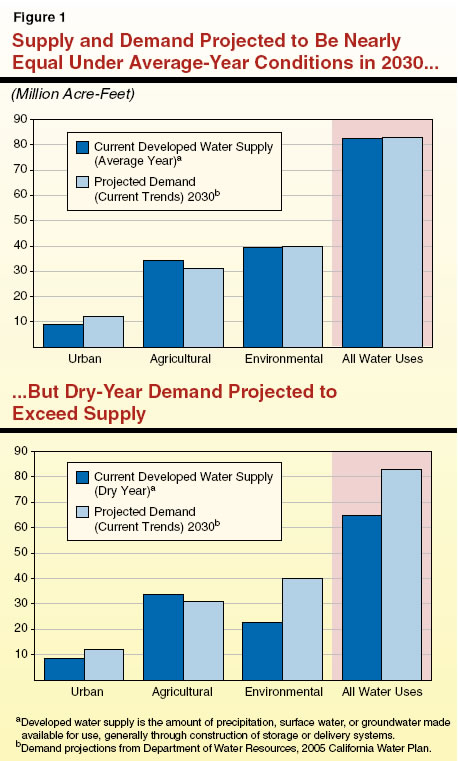
    Projections show that the state is likely to have adequate water supply in the aggregate to meet its water demands in average precipitation years under current trends as seen in Figure 1. However, in dry years, projected demand by category of use will exceed supply in 2030 in most cases.

    Supply and demand projected to be nearly equal under average-year conditions in 2030...but dry-year demand projected to exceed supply

    Options for Addressing Water Supply Reliability. There are several options available to the state to ensure that, during the driest years, disruptions from water shortages are minimized on a statewide basis. These options generally fall into two categories—short term and long term—depending on the length of time required to implement them. While short–term options may produce benefits sooner, they can also have long–term benefits if adopted and sustained.

    As shown in Figure 2 , the Department of Water Resources (DWR) has analyzed a number of short– and long–term options to strengthen water supply reliability throughout the state. (The surface storage–related option in Figure 2 reflects only specific CALFED Bay–Delta Program [CALFED]–proposed projects and does not include locally implemented projects.) The options presented in the figure generally involve reducing water demand or increasing water supplies. They also vary in their potential to produce additional water and in their per–unit cost to do so. For example, according to DWR estimates, urban water use efficiency (a shorter–term solution) costs about $1,000 to achieve one acre–foot of water savings per year. The DWR also determined that annually about 2 million acre–feet of additional water could result from this water management strategy. According to DWR’s estimates, this makes urban water use efficiency both the most cost–beneficial and the highest potential water producer of all of the solutions evaluated.

    Options for additional water supply: benefits and costs

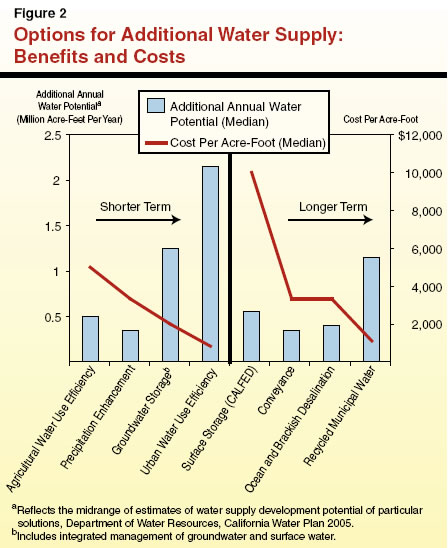
    On the other hand, according to DWR estimates, CALFED surface storage (a longer–term solution) costs about $10,000 to achieve one acre–foot of water savings per year. This estimate is based on three specific CALFED–proposed projects: (1) Sites Reservoir, (2) Temperance Flat Reservoir, and (3) Los Vaqueros expansion. The DWR also determined that in the range of 500,000 acre–feet of additional water annually could result from this water management strategy.

    In evaluating options for additional water supply, the Legislature should not only consider the cost–benefit of each but how they work together as a comprehensive package of tools. Each of the options presented in Figure 2 would contribute to needed flexibility in the management of the water system and therefore all may have a role to play.

    Using the criterion of “least cost, highest gain,” short–term options (including those that would have a greater short–term impact and, if sustained, a long–term impact as well) should be directed first toward urban water use efficiency and groundwater storage, and second to agricultural water use efficiency and other options. For long–term options, investing in the long–term solution of recycled municipal water would be the first funding priority, with improvements to conveyance, desalination, and the proposed CALFED surface storage projects as secondary options.

    Fundamental Changes Needed in Water Rights System

    “Reasonable Use” Requirement Should Better Reflect Scarcity of Resources. The development of California’s water rights system is steeped in tradition, and has roots in the State Constitution, but its implementation is based on outdated policy that is in need of reform. Article X of the Constitution requires that water be put to beneficial use and that waste of water or unreasonable use be prevented. At first glance, such principles seem reasonable. However, their implementation has had counter–productive results in some instances. The reasonable use requirement for surface water has generally been implemented as a “use it or lose it” policy, which itself resulted from a policy of “first in time, first in right.” Under the latter policy, the first individual to claim a water right gains the water right so long as they can demonstrate the continued use of water. The combination of these longstanding policies can lead to inefficient uses of water.

    Water Rights Realignment Necessary. It is in the interest of the state to undertake a concerted effort to realign the water rights system to better reflect modern needs and circumstances. For example, this could be done by accounting for the potential for water conservation and water use efficiency in managing water rights. Thus, where water is required for agricultural purposes, the water right should mirror only the amount of water needed to grow a crop using available water efficiency technology. Similarly, urban water rights should reflect the use of cost–effective water conservation and efficiency measures. By realigning water conservation and efficiency efforts with water rights, overuse of water simply to maintain a water right could be reduced and that water would be available for other purposes within the region or state. This modernization of the water rights system could start to be accomplished by the enactment of legislation to provide an updated, comprehensive definition of the “reasonable use” of water to be used in the water rights permitting process. This definition would encompass the potential for the water rights holders to avail themselves of water conservation and water use efficiency measures discussed above.

    Reevaluate How Groundwater Is Regulated And Managed

    Groundwater Important to Water Supply. The potential to use groundwater to increase water supply, by introducing water from another source into the ground as a storage basin, or encouraging the natural refilling of groundwater basins, is a significant option to address water supply needs. However, successful implementation of this solution is hampered because groundwater use is generally not regulated or monitored at the state level (in contrast to surface water). In addition, local groundwater management does not take into account statewide water needs. Finally, groundwater quality is not protected under state regulation as comprehensively as surface water quality. When contaminated, groundwater loses its potential to serve as a water supply source.

    Recommend Statewide Groundwater Rights and Quality Permitting System. For the reasons stated above, we recommend that the Legislature establish a state–administered water rights system for groundwater. In addition, we recommend that the water quality permitting processes of the state and regional water boards be restructured to protect groundwater to the same extent as surface water. While moving in these directions would increase state administrative costs to establish and implement new programs, in the long term there would be cost savings to public and private entities across the state. This is because these efforts would decrease the need for costly water rights adjudications, cleanup of degraded groundwater, and treatment of groundwater for use in water supply. As with the regulation of surface water use and quality, we believe a strong case can be made for groundwater beneficiaries and polluters of groundwater to pay for the bulk of the costs of state groundwater regulatory programs.

    Addressing the Role of the Delta: Coming to Terms With Trade–Offs

    Over $5 billion has been spent through the CALFED effort to address issues related to water flows in and through the Sacramento–San Joaquin River Delta (the Delta). The issues primarily revolve around the problem of balancing environmental objectives with urban and agricultural water supply requirements.

    The state’s Delta–focused water system—the SWP—provides a portion of the water supply to two–thirds of Californians (mainly in Southern California, the Bay Area, and coastal cities) and irrigation water to over one–third of the state’s cropland. After years of research and study, there is generally common agreement among policy experts that the current approach to managing the Delta must change to meet the state’s water supply reliability and environmental objectives—in other words, the state needs to abandon the “business as usual” model. A culmination of this research is seen in the soon to be released Delta Vision “strategic plan” as well as the recently released Public Policy Institute of California (PPIC) report evaluating various alternatives for managing the Delta. Both of these reports focus on specific proposals to change how water is conveyed through the Delta, and lay out trade–offs that will need to be made in meeting economic and environmental objectives under any of the alternatives.

    At present, water exports are being reduced from the Delta to meet fish and wildlife needs, as required by federal court–order. It is unlikely that the state will be able to achieve all the water supply and environmental benefits that are currently being demanded of the Delta under current law and practice (see pages 25 and 26 for a discussion of the role of the Delta). Trade–offs will need to be made, and these will likely have negative impacts on certain segments of the state’s population, economy, and environment. The Legislature will need to evaluate the specific projects recommended in the Delta Vision and PPIC reports, as well as other reports, to determine the acceptable level of trade–offs of continued export of water from the Delta, and enact legislation that reflects the Legislature’s policy on the appropriate choice for future water conveyance and management in the Delta. Additionally, the Legislature should give particular consideration to the role that water rights and water transfers can play in strengthening water supply reliability for competing uses of water. The Legislature also needs to set clear policy for who will pay for the implementation of its Delta policy, and we recommend this be based on the application of the beneficiary pays funding principle.

    Conveyance Through the Delta Must Be Addressed—and Soon. Recommendations to strengthen water supply reliability, facilitate water transfers, increase surface water storage outside of the Delta, and generally improve the efficiency and flexibility of California’s water system all hinge on addressing current problems with conveyance of water through the Delta. The Delta Vision task force as well as the PPIC have found that an alternative to the current system of conveyance is necessary if environmental and economic objectives for the Delta are to be met.

    There are three basic alternatives to the current through–Delta conveyance system that have been evaluated—(1) an isolated peripheral facility such as a canal or pipeline isolated from the Delta, (2) combining through–Delta conveyance with an isolated peripheral facility (“dual–conveyance”), and (3) ending water exports from the Delta to the south. While the PPIC report recommends the Peripheral Canal as the long–term solution, the draft Delta Vision strategic plan recommends the dual–conveyance approach. To this end, we recommend that it be a priority for the state to select an alternative to the business–as–usual conveyance approach. This would be done after considering each alternative’s costs, inherent trade–offs (including environmental and land use impacts), and benefits.

    Glossary

    Acre–Foot—The volume of water required to cover one acre of land to a depth of one foot.

    Assessment—A charge levied on property to pay for a public improvement or service that benefits that property and therefore the property owner. Assessments are usually collected on the regular property tax bill.

    Beneficiary Pays Principle—According to this principle, those who benefit from the provision of a good or service should be responsible for paying its cost.

    Conjunctive Use—The integrated management of surface and groundwater supplies to improve water supply reliability, such as pumping surface water into groundwater basins for storage.

    Conveyance—Water transport through a pipe, canal, ditch, or natural system (such as a river or groundwater).

    Dam—A physical structure designed to hold water back in a reservoir.

    Desalination—The removal of salts from water to convert to fresh water.

    Developed Water Supply—The amount of precipitation, surface water, or groundwater made available for use, generally through construction of storage or delivery systems.

    Distribution System—A network of pipes or other means of conveyance leading to the user of water, such as pipes leading from a treatment plant to a customer’s plumbing system.

    Fee—A charge imposed on an individual or business for a service, such as water right permitting or water delivery, used by that individual or business.

    Groundwater—Waters beneath the land surface in underground basins (aquifers), underground streams, and underground flows of a surface stream.

    Groundwater Recharge—Inflow of water to a groundwater reservoir from the surface. Precipitation moving to the water table is one form of natural recharge.

    Irrigation—The controlled application of water through manmade systems to supply water requirements not satisfied by precipitation.

    Levee—A natural or manmade earthen barrier along the edge of a stream, lake, or river, protecting adjacent lands from flooding.

    Per Capita Water Use—The average amount of water used per person during a standard time period, generally per day.

    Polluter Pays Principle—According to this principle, private individuals or businesses that use or degrade a public resource (such as air, water, or wildlife habitat) should pay for the social cost imposed by their use of the resource.

    Precipitation—Rain, snow, hail, sleet, dew, and frost.

    Reasonable and Beneficial Use Doctrine—A state constitutional requirement (Article X, Section 2) that all water resources must be put to beneficial use, preventing waste or unreasonable use or unreasonable method of use.

    Recycled Water—Wastewater that is treated so that it can be reused before it passes back into the natural hydrologic system.

    Reservoir—A pond, lake, or basin, either natural or artificial, for the management of water, such as storage.

    Runoff—That part of precipitation, snow melt, or irrigation water that finds its way to surface streams, rivers, lakes, drains, sewers, or the ocean.

    Subsidence—A dropping of the land surface occurring as a result of a number of factors, including as a result of large amounts of groundwater being pumped. Cracks and fissures can appear in the land.

    Surface Water—Water that is on the earth’s surface, such as in a stream, river, lake, or reservoir.

    Urban Water Use—Water used for commercial, industrial, or domestic household purposes, such as for business needs, drinking, food preparation, washing, and watering lawns and gardens.

    Wastewater—Water that has been used in homes, industries, businesses, and agriculture that is not available for reuse unless it is treated.

    Water Quality—Description of the chemical, physical, and biological characteristics of water, usually in respect to its suitability for a particular purpose.

    Water Right—The legal right to use water from a particular water source, such as a stream or river.

    Water Supply—Water withdrawn (for example, from streams or groundwater) that is delivered to users.

    Water Use—Water that is used for a specific purpose, such as withdrawals for domestic use, irrigation, and industrial processing, and instream uses such as for hydroelectric power production and environmental–related flows.


    Acknowledgments

    This report was prepared by Catherine Freeman and reviewed by Mark Newton . The Legislative Analyst's Office (LAO) is a nonpartisan office which provides fiscal and policy information and advice to the Legislature.

    LAO Publications

    To request publications call (916) 445-4656. This report and others, as well as an E-mail subscription service, are available on the LAO's Internet site at www.lao.ca.gov. The LAO is located at 925 L Street, Suite 1000, Sacramento, CA 95814.


    Return to LAO Home Page