(Elizabeth Hill's Webcast Describing the Fiscal Outlook)
November 14, 2007
California's Fiscal Outlook:
LAO Projections 2007-08 Through 2012-13
Summary
Deterioration of the 2007–08 Budget
At the time the 2007–08 Budget Act was enacted in August 2007, the budget plan focused on closing the gap between General Fund revenues and expenditures for the fiscal year and maintaining a $4.1 billion reserve. Since that time, the 2007–08 budget situation has deteriorated by almost $6 billion. Under our forecast, absent corrective action, the state would end the current fiscal year with a $1.9 billion deficit. The state’s dimming fiscal outlook is due to:
- Continued softness in the state’s economy lowering the forecast of revenues.
- Lower property taxes, driving state General Fund spending on K–14 education upwards.
- A likely delay in the sale of EdFund and a reduction in anticipated revenues.
- Delayed implementation of new tribal gambling compacts.
- A court–ordered payment to the state’s teacher retirement system.
State Also Faces $8 Billion Shortfall in 2008–09
In addition to a negative carry–in balance from 2007–08, we project the state will face an $8 billion operating shortfall in 2008–09. Revenues are projected to grow by 4.6 percent, hampered by the ongoing effects of the weakened economy. On the expenditure side, spending is projected to grow by 7 percent—reflecting both cost increases in most state programs and the end of many 2007–08 one–time budget solutions.
Multibillion Dollar Shortfalls Through 2012–13
Like in 2008–09, we project state costs will exceed revenues by $8 billion in 2009–10. After that, the shortfall will drop to the range of $3 billion each year. The primary factor responsible for this drop between 2009–10 and 2010–11 is that $11.3 billion in previously issued deficit–financing borrowing would be fully paid off in the spring of 2010. This will free up over $3 billion in annual debt service payments beginning in 2010–11.
LAO Bottom Line
In order to balance the 2008–09 budget, the state will have to adopt nearly $10 billion in solutions. Addressing the state’s current budget problem is even more urgent because we forecast a continuing gap between revenues and expenditures. A plan to permanently address the state’s fiscal troubles must involve a substantial portion of ongoing solutions. This is not only because of the persistent operating deficits projected throughout the forecast, but also because of the downside risks inherent with the economy, General Fund revenue volatility, and a wide range of budgetary uncertainties. Making tough choices now will allow the state to move closer to putting its fiscal woes in the past.
Table of Contents
Chapter 1
The Budget Outlook
This report provides our projections of the state’s General Fund revenues and expenditures for 2007–08 through 2012–13. Our fiscal projections primarily reflect current–law spending requirements and tax provisions, while relying on our independent assessment of the outlook for California’s economy, demographics, revenues, and expenditures. The report aims to assist the Legislature with its fiscal planning as it begins to consider the 2008–09 budget. The basis of our assumptions is described in the box below.
Basis for Our Estimates
Our revenue and expenditure forecasts are based primarily on the requirements of current law, including constitutional requirements (such as Proposition 98) and statutory requirements (such as cost–of–living adjustments [COLAs]). In other cases, the estimates incorporate effects of projected changes in caseloads, prices, federal requirements, court orders, and other factors affecting program costs.
What Is Not Included? We have not included funding to cover the Governor’s “compact” with higher education, as the Legislature has taken no statutory action to implement such an agreement during this multiyear period. Rather, our estimates for higher education are based on projected enrollment and inflation–related increases. For instance, in 2008–09, fully funding the compact would require added expenditures of nearly $200 million beyond those we are projecting. Similarly, our projections do not account for any fiscal effects from proposed health care reforms. In the social services area, our projections do not include the costs of providing COLAs for the foster care program or county welfare administration costs. Based on recent experience, the Legislature has considered these latter costs on an annual basis.
Projections, Not Predictions. Our estimates are not predictions of what the Legislature and Governor will adopt as policies and funding levels in future budgets. Rather, our estimates are intended to be a reasonable baseline projection of what would happen if current–law policies were allowed to operate in the future. In this regard, we believe that our forecast provides a meaningful starting point for legislative deliberations involving the state’s budget so that corrective actions can be taken to ensure that the state’s fiscal house is in order. |
Update on the 2007–08 Budget
The Budget as Adopted Had $4 Billion Reserve
At the time the 2007–08 Budget Act was enacted in August 2007, the budget plan focused on closing the gap between General Fund revenues and expenditures for the fiscal year. State revenues and expenditures were both projected to be $102.3 billion. The plan also had a $4.1 billion reserve. The budget closed the state’s ongoing gap between revenues and expenditures using largely one–time solutions. Consequently, the state was expected to once again face multibillion budget shortfalls beginning in 2008–09.
Negative Factors Will Deplete the Reserve and Leave a Year–End Deficit
We have updated our forecast of the 2007–08 General Fund condition to reflect (1) key changes that have occurred since August and (2) updated revenue and expenditure forecasts. Almost all of these factors have been negative. As described in more detail below, the deterioration of the state’s budget outlook is due to a combination of a worsening economic and revenue picture, delayed benefits from budget solutions, and higher costs. We project that the state’s 2007–08 budget has deteriorated by a total of almost $6 billion. Consequently, rather than having a $4.1 billion reserve, the state faces a 2007–08 year–end deficit of $1.9 billion. Figure 1 summarizes the decline in the state’s budget outlook.
Figure 1
What Happened to the $4 Billion Reserve? |
(In Millions) |
|
Reserve as of June 30, 2008 |
2007-08 Budget Act (August 2007) |
$4,070 |
Revenues on the Decline |
|
Lower 2006‑07 major tax revenues |
-$604 |
Receipt of 2006‑07 Medi-Cal quality assurance fee revenues |
180 |
Lower 2007‑08 tax forecast |
-2,082 |
Lower property taxes (Proposition 98) |
|
2006‑07 |
-356 |
2007‑08 |
-686 |
EdFund sale not achievable in 2007‑08 |
-1,000 |
Delayed implementation of tribal compacts |
-210 |
Delayed child support penalty rebate |
-198 |
Expenditures on the Rise |
|
CalSTRS payment |
-$500 |
Correctional officer pay increase |
-258 |
Unallocated reductions not achievable |
-240 |
Higher firefighting costs |
-174 |
Other (net savings) |
184 |
LAO Revised Reserve (November 2007) |
-$1,874 |
Revenues on the Way Down…
2006–07 Revenues Adjusted Down. Based on the 2007 May Revision revenue estimates, the budget assumed that the state received $96 billion in 2006–07. However, revenues collected for the months of May and June were significantly below projections. Due to some uncertainty regarding the final 2006–07 amounts at the time of the budget’s enactment, the 2006–07 revenue total was not adjusted in the budget plan. Tax revenues for 2006–07 have now been revised and were about $600 million below the budget’s forecast. Somewhat offsetting this decline was the receipt of $180 million in Medi–Cal quality assurance fee revenues.
Slower Growth in Revenues. Since the enactment of the budget, the state’s economy has shown continuing signs of weakness—particularly with the depressed real estate market and high energy and gasoline prices. In addition, year–to–date cash receipts for tax revenues have been falling considerably short of budget estimates. As described in depth in Chapters 2 and 3, these factors have resulted in our forecast reducing expected 2007–08 tax revenues by more than $2 billion.
Property Taxes Declining. Combined over 2006–07 and 2007–08, our forecast of property tax revenues for school districts is lower than the enacted budget assumptions by more than $1 billion. Because the property tax revenues received by school districts generally offset the state’s General Fund Proposition 98 expenditures on a dollar–for–dollar basis, this means that state General Fund costs are now projected to be $1 billion higher. This decline is due to two issues:
- Lower Base From 2005–06. The 2007 May Revision recognized a roughly $300 million reduction in actual 2005–06 property tax receipts compared to earlier projections. The enacted budget assumed that this was a one–time decline and that 2006–07 revenues would rebound to a higher level. The budget authorized the State Controller’s Office (SCO) to conduct an audit of receipts to determine the reason for the drop in revenues. Earlier this month, SCO released its audit which found no reason to expect 2006–07 revenues to significantly rebound. Consequently, our property tax forecast assumes the lower 2005–06 base—raising General Fund Proposition 98 expenditures by more than $350 million for 2006–07 and 2007–08.
- Lower Growth in Revenues. The enacted 2007–08 budget assumed that property taxes generally would grow at a rate of 10 percent. Due to the slumping real estate market, our forecast of property tax revenues is somewhat lower—at 8.7 percent. This raises General Fund Proposition 98 expenditures by roughly an additional $300 million in 2007–08.
EdFund Sale Likely Delayed and Downsized. One of the budget plan’s major solutions was authorizing the Director of the Department of Finance (DOF) to sell EdFund, the state’s nonprofit agency that administers federal student loan guarantee programs. The budget assumed $1 billion in one–time 2007–08 revenues from the sale. Since the budget’s enactment, federal changes to the loan guarantee programs reduced the financial attractiveness of such businesses. In addition, it is less likely that the complicated sale could be finalized by the end of the current fiscal year. Consequently, our projections now assume that the state will receive $500 million from EdFund’s sale—but not until 2008–09.
Child Support Automation Rebate Delayed. In recent years, the state has paid hundreds of millions of dollars in federal penalties due to delays in implementing a child support automation system. Due to expected federal certification of the state’s new system, the enacted budget assumed the receipt in 2007–08 of $198 million in rebated penalties. We now expect that certification to be delayed and the receipt of the funds in 2008–09.
Lower Indian Gambling Revenues. Measures passed by the Legislature in 2007 ratify amended compacts between the state and five Southern California Indian tribes and authorize those tribes to expand their casino operations with up to 22,500 new slot machines on a combined basis. Based primarily on a DOF analysis submitted to the Legislature with the May Revision, the budget package assumed that the state would receive $293 million in new General Fund revenues in 2007–08 as a result of the five new compacts. While the measures were passed on a majority–vote basis (meaning that they would take effect on January 1, 2008), the DOF analysis assumed that the compacts would be ratified on an urgency basis (to take effect on or about July 1, 2007). Subsequent to the Legislature’s actions on the compacts in June, referenda petitioners submitted signatures of registered voters to place the legislative measures ratifying four of the compacts on the February 2008 statewide ballot. (Final federal approval of the compacts also would be required.) As a result of these delays, we project that 2007–08 General Fund revenues from tribal compacts will be more than $200 million lower than the budget assumed.
…While Expenditures Are on the Way Up
State Lost Teachers’ Retirement Lawsuit. In 2003–04, as a budget balancing solution, the state reduced by $500 million, on a one–time basis, an annual appropriation to the purchasing power protection program of the California State Teachers’ Retirement System. In September 2007, the Third District Court of Appeal ruled that the reduction unconstitutionally violated the contractual rights of system members. Consequently, the administration repaid the $500 million. The amount of interest owed on the payment is being appealed by the administration and will require a future appropriation to be paid. The interest owed could total in the range of $200 million. (Our estimates assume that the interest payment occurs in 2008–09.)
Correctional Officer Pay. Following an impasse in negotiations with the union representing state correctional officers, the administration began implementation in September 2007 of its final offer to the union. That offer included a current–year salary increase of 5 percent at a General Fund cost of $258 million. Although the Legislature has not yet acted on this proposal, we have included the costs in our forecast. These costs could be lower or higher depending on legislative action.
Unallocated Reductions Unlikely to Meet Targets. The enacted budget assumed that the administration would reduce expenditures by $258 million during the fiscal year through unallocated reductions. The budget provision intended to achieve $100 million of this amount has traditionally failed to generate new savings and instead counts savings elsewhere in the budget which occur on the natural from, for example, reduced caseload. Of the remaining amount, the California Department of Corrections and Rehabilitation was expected to cover $106 million in reductions—despite the department’s history of budget shortfalls. As a result, our forecast assumes that only a minimal amount of the assumed savings will be achieved.
Southern California Wildfires. The 2007–08 budget includes $82 million for statewide emergency firefighting costs. Our forecast assumes the state will spend $174 million more in firefighting costs than the budgeted amount over the course of the year. Most of this increase—$140 million—results from the recent Southern California wildfires. (However, it is likely that the federal government will reimburse the state for a substantial portion of this cost in future years.)
Bigger Problems in 2008–09 As Well
Figure 2 shows our updated projection of the General Fund condition through 2008–09. As a result of the factors described above, we project that 2008–09 will begin the year with a negative reserve of $1.9 billion. In 2008–09, we project revenues will climb to $103.5 billion, an increase of 4.6 percent from the current year. We project expenditures will total $111.4 billion, an increase of 7 percent. Consequently, under our current–law projections, the General Fund would be left with a 2008–09 year–end deficit of $9.8 billion absent corrective actions. The box below helps explain our use of “year–end deficit” and other terms associated with the state’s budget problems.
Our forecast of an $8 billion gap between 2008–09 revenues and expenditures is worse than our earlier projections. This is largely the result of the ongoing impact of our reduced revenue forecast. Partially offsetting this decline in revenues is the shift in our forecast of revenues from 2007–08 to 2008–09 for the sale of EdFund and the receipt of the federal child support automation rebate.
Figure 2
LAO Projections of General Fund Condition |
2006-07 Through 2008-09
(In Millions) |
|
2006-07 |
2007-08 |
2008-09 |
Prior-year fund balance |
$10,435 |
$4,114 |
-$1,129 |
Revenues and transfers |
95,578 |
98,916 |
103,512 |
Total resources available |
$106,013 |
$103,030 |
$102,383 |
Expenditures |
$101,899 |
$104,159 |
$111,428 |
Ending fund balance |
$4,114 |
-$1,129 |
-$9,045 |
Encumbrances |
$745 |
$745 |
$745 |
Reserve |
$3,369 |
-$1,874 |
-$9,790 |
Budget Stabilization Account |
$472 |
—a |
—a |
Special Fund for Economic Uncertainties |
$2,897 |
—a |
—a |
|
a Under current law, the General Fund will deposit $1 billion in 2007-08 and $1.6 billion in 2008-09
into the Budget Stabilization Account for use as a budgetary reserve. Due to the projected budget shortfalls, however, these funds and any funds in the Special Fund for Economic Uncertainties are
assumed to be used to partially address the shortfalls. |
Definitions of a Budget Problem
In recent years, a number of different terms have been used to describe the state’s fiscal woes. At times, these terms have been used interchangeably—even though they often have significantly different meanings. In other words, the magnitude or meaning of the state’s “budget problem” may be very different depending on which term is being used.
Operating Shortfall/Operating Deficit. These terms focus on the difference between revenues and expenditures in a single budget year. For instance, under our forecast, the operating shortfall for 2008–09 is $7.9 billion ($111.4 billion in expenditures less $103.5 billion in revenues). In better financial times, an operating surplus is the opposite—when the state receives more money than it spends in a single budget year.
Strictly looking at an operating shortfall makes sense when evaluating the future. If expenditures are expected to exceed revenues for the foreseeable future, then the state should take actions to bring these two trend lines into balance. The term “structural budget deficit” may be used to describe this type of chronic operating shortfall.
Budget Deficit/Year–End Deficit. These terms are similar to operating shortfall but make the key addition of considering the state’s carry–in reserve from the end of the prior fiscal year. Budget deficit and year–end deficit have more relevance in the short term when considering an upcoming budget. That is because the most immediate task for the Legislature is passing a “balanced budget”—by eliminating any year–end deficit and ensuring a reserve at the end of the year. Thus, the state could adopt a balanced budget even when it has an operating deficit because of a positive carry–in reserve. If a carry–in reserve is negative, however, the upcoming budget must have more revenues than expenditures to avoid a year–end deficit. The Legislature faces this situation with the 2008–09 budget. Revenues in 2008–09 must exceed expenditures by $1.9 billion to make up for the projected negative carry–in reserve.
Net Operating Deficit. This is a term developed by the administration in presenting its budget in January 2007. It attempts to account for any one–time revenues and/or expenditures within an operating shortfall. By stripping out these one–time factors, net operating deficit can help identify the state’s underlying budget problem. In addressing an immediate budget problem, however, the concept is less helpful. That is because, regardless of how they are characterized, one–time costs remain obligations of the state that must be paid. |
Longer–Term Forecast
Our longer–term revenue and expenditure forecasts are detailed in Chapter 3 and Chapter 4, respectively. Based on these forecasts, Figure 3 shows that the state’s budget woes are projected to continue through 2012–13. In 2009–10, the state would once again face an operating shortfall of $8 billion. After that, the annual operating shortfall would drop to the range of $3 billion each year. The primary factor responsible for this decline in the shortfall after 2009–10 is that the $11.3 billion in previously issued deficit–financing bonds would be fully paid off in the spring of 2010. This will free up over $3 billion in annual debt service payments beginning in 2010–11. Another key factor in 2010–11 is improved revenue growth, in part due to the renewed effect of the estate tax.
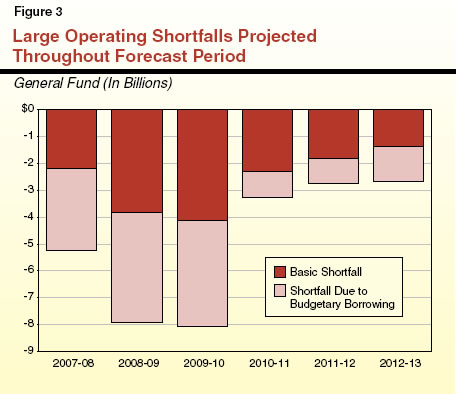
The Impact of Prior Borrowing and Debt. Figure 3 breaks the state’s projected operating shortfalls into two components:
- Basic. The portion due to each year’s difference between current–law spending and revenues.
- Budgetary Borrowing. The portion due to the state’s obligations from past borrowing to address budget problems.
At the start of 2008–09, we project the state will have about a $20 billion balance on its budgetary borrowing. The state is scheduled to make $4 billion payments towards this amount in both 2008–09 and 2009–10. In these years, the portion of the shortfall due to past borrowing is about one–half of the state’s problem. Once the deficit–financing bonds are paid off, the share due to borrowing falls somewhat—to about one–third of the annual problem for the following two years. While the past borrowing helped the state get from one fiscal year to the next, it has created additional spending pressures each year to pay for past rather than current services.
Additional Risks, Uncertainties, and Cost Pressures
Our forecast captures our best estimates at this time regarding the state’s fiscal condition. Yet, the state faces a number of other risks, uncertainties, and cost pressures not accounted for in our forecast as discussed below.
Legal Issues. The state faces a number of court cases with sizable fiscal liabilities.
- Use of Transportation Funds. The largest such lawsuit challenges the 2007–08 budget’s use of transportation funds for the General Fund’s benefit. On September 6, 2007, the state was sued by public transit advocates arguing that the budget’s redirection of $1.3 billion in transportation funds for various purposes benefiting the General Fund is illegal. The case is expected to be heard at the end of November. If the state is unable to defend its various actions, the 2007–08 budget would be up to $1.3 billion in further deficit. In addition, a portion of the redirection is intended to be ongoing. Our estimates assume more than $400 million in General Fund savings each year throughout the forecast period. Those savings are at risk as well.
- Correctional Issues. The state continues to deal with a variety of federal lawsuits related to the correctional health care system. While our forecast includes many costs associated with these lawsuits, the potential for additional costs remains. On the other hand, if the federal courts imposed a correctional population cap (currently under review), state prison costs would be hundreds of millions of dollars lower each year due to fewer inmates being in the state’s system.
- Other Legal Issues. During its 2007 session, the Legislature enacted measures to reduce the financial risk in cases involving limited liability companies’ tax obligations and the state’s unclaimed property program. However, some potential liabilities remain in these areas until the pending cases are ultimately resolved.
Estate Tax. California’s estate tax—which is tied to the federal estate tax—is not presently in effect. Under current federal law, California’s estate tax would once again collect revenues beginning in 2011. If this were to occur, California’s tax would raise roughly $900 million in 2010–11 (a half–year effect) and $1.9 billion in 2011–12 and thereafter. These revenues are included in our forecast. Should the scheduled changes in the tax at the federal level be modified, these revenues would need to be adjusted downward.
Taking Steps to Balance the Budget
In each year since 2001–02, the state has faced budget problems of varying magnitudes. Once again, the Legislature will face a major challenge in bringing the 2008–09 budget into balance. It will need to develop a budget plan that provides almost $10 billion in solutions. Addressing the state’s current budget problem is even more urgent because we forecast a continuing gap between revenues and expenditures. Without permanent budget solutions, the state will continue to face annual budget problems. A plan to permanently address the state’s fiscal troubles must involve ongoing solutions.
In past years, the Legislature has been concerned that in addressing a current budget problem, it not “overcorrect” by adopting permanent solutions—such as deep cuts in programs—that would not be necessary in the out–years. For instance, permanent spending reductions of $10 billion to address the 2008–09 budget problem would be more than needed by 2010–11 (see Figure 3). While this is a valid concern, we believe a substantial portion of the current budget problem needs to be addressed through ongoing solutions. This is not only because of the persistent operating deficits over the life of the forecast, but also because of the downside risks inherent with the economy, General Fund revenue volatility, and the various budgetary uncertainties described in the previous section. Even with such an approach, the state would still need to come up with billions of dollars in additional solutions of a more limited duration to get through the worst of the upcoming budget years—2008–09 and 2009–10.
Budget Savings and Revenue Increases. In order to achieve ongoing budget solutions, there are numerous options available, though almost all of them involve making tough policy choices.
- Slowing program growth by reducing or eliminating cost–of–living adjustments (COLAs).
- Rolling back recent program expansions or reducing the level of program benefits.
- Eliminating duplicative or ineffective programs and restructuring program delivery methods.
- Shifting costs to special funds or to user fees.
- Eliminating tax credits and tax expenditure programs.
- Increasing efforts to enforce existing tax laws and ensure compliance.
- Raising tax rates.
Current–Year Solutions? Under our forecast, the state will end the current fiscal year with a deficit of $1.9 billion. While the state is not required by law to take action to bring the 2007–08 budget into balance, the Legislature should strongly consider doing so. By taking action now, the Legislature in some cases can “double up” its savings from any enacted solutions. That is, by acting this year, a program reduction can generate savings in 2007–08 which will then carryover into 2008–09. For instance, as we discuss in Chapter 4, reducing Proposition 98 spending to the minimum guarantee in 2007–08 would result in about $400 million in savings that year and allow roughly the same amount of savings to be achieved in 2008–09. In other cases, solutions may need early action in order to get a full year’s worth of savings in 2008–09. This would often be the case in program reforms or restructurings. Similarly, if the Legislature wished to delay or suspend COLAs, it may require action prior to July 1, 2008. For example, the 2007–08 Supplemental Security Income/State Supplementary Program COLA is due to go into effect on June 1, 2008, and the Legislature would need to act this spring if it wished to suspend it and generate $250 million in ongoing savings beginning in 2008–09. In the end, any improvement that the state can make in its 2007–08 year–end balance will make it that much easier to balance the 2008–09 budget.
Suspend the Budget Stabilization Account (BSA) Transfer? As we discuss in the box below, under current law, the General Fund would transfer $3.1 billion to the BSA in 2008–09. One–half of this amount would go towards supplementing the “triple flip’s” pay off of the state’s deficit–financing bonds, and the other one–half would be held as a reserve. The Governor has the authority to suspend this transfer through an executive order by June 1, 2008. If he did so, this would reduce 2008–09 expenditures by $1.6 billion (by not making the supplemental deficit–financing bonds payment). The triple flip would continue to make its $1.5 billion in 2008–09 bond payments. While paying off budgetary borrowing improves the state’s long–term fiscal outlook, the state’s current repayment schedule is particularly heavy in 2008–09 and 2009–10. If the Governor were to suspend the transfer, the costs of repaying past budgetary borrowing would be extended.
Budget Stabilization Account, Deficit–Financing Bonds, And the Budget Outlook
At the March 2004 election, the state’s voters approved Propositions 57 and 58. The propositions, which amended the State Constitution, implemented a number of key changes that will factor into the development of the 2008–09 budget.
Balanced Budget Requirement. While previously the Governor was required to propose a balanced budget, Proposition 58 requires the Legislature to enact a balanced budget. At the same time, nothing in the measures prohibit the state from ending a fiscal year with a deficit (as would occur under our forecast for 2007–08). Yet, the next year’s enacted budget would have to make up this carry–in deficit to meet the balanced budget requirement. The Governor is also authorized to declare a fiscal emergency and call a special session of the Legislature to address it.
$15 Billion in Deficit–Financing Bonds. The voters authorized the issuance of up to $15 billion in deficit–financing bonds. In essence, the voters allowed the state to borrow money to pay off a portion of the state’s budget debts (as of the end of 2003–04). After the passage of the measures, the state raised $11.3 billion from these bonds—leaving up to $3.7 billion in additional funds that could be raised.
The “Triple Flip.” In a complex financing mechanism that is known as the triple flip, the voters established a mechanism to pay off the debt from the deficit–financing bonds. One quarter of a cent of the local sales tax is diverted to pay off the bonds. While there is outstanding debt, local government sales tax revenues are replaced on a dollar–for–dollar basis with property taxes shifted from K–14 school districts. In turn, K–14 school losses are offset by increased state General Fund spending through Proposition 98. The triple flip is expected to pay $1.5 billion towards bond debt in 2007–08 and another $1.5 billion in 2008–09.
The Budget Stabilization Account (BSA). Proposition 58 established a new General Fund budget reserve, called the BSA. The measure requires that annual transfers be made to this account totaling 1 percent of revenues in 2006–07 (equivalent to $944 million), 2 percent in 2007–08 (equivalent to $2 billion), and 3 percent thereafter ($3.1 billion in 2008–09) until the balance of the account reaches either $8 billion or 5 percent of General Fund revenues, whichever is greater.
- Bond Payoff. One–half of the annual transfers is allocated to a subaccount to make supplemental payments on the outstanding deficit–financing bonds until they are paid off. This amount was $1 billion in 2007–08 and will be $1.6 billion in 2008–09.
- Budget Reserve. The other one–half is held in reserve and available to support General Fund expenditures (as is the case for the state’s other reserve, called the Special Fund for Economic Uncertainties). Due to the budget shortfall under our forecast, we expect the entire reserve balance of the BSA to be transferred back to the General Fund in 2007–08 (the $1 billion transferred in 2007–08, plus the $472 million carried over from 2006–07), as allowed under the 2007–08 Budget Act. Similarly, $1.6 billion of the reserve would be immediately used in 2008–09 for budget balancing—leaving a zero balance in the BSA.
The Governor has the authority to suspend the annual transfer through an executive order issued by June 1 of the preceding fiscal year. (Our forecast assumes that the transfers are not suspended.)
Outstanding Balance of Deficit–Financing Bonds. By the start of the 2008–09 fiscal year, we expect roughly one–half of the $11.3 billion in deficit–financing borrowing to be paid off. If the Governor does not suspend the BSA transfers in 2008–09 and 2009–10, the remaining $6 billion in outstanding bonds would be paid off by the spring of 2010.
Difference From Department of Finance (DOF). Our display of the BSA in our General Fund condition statement (Figure 2) differs somewhat from DOF. On the revenue side, we include all funds that will be transferred to the BSA (3 percent of revenues in 2008–09). In contrast, DOF only shows one–half of this amount (1.5 percent in 2008–09) as revenues. The DOF excludes the amount of revenues dedicated to the BSA reserve. We believe our display better captures the total level of resources available for General Fund obligations. On the expenditure side, there is no difference. We and DOF both show the portion of the BSA being used to pay off the deficit–financing bonds as a General Fund expenditure. The remaining one–half of the BSA is not shown as an expenditure since the funds are being held in reserve and are not being spent for a specific purpose. Our different treatments of revenues, however, does not affect the bottom–line reserve. In other words, for a particular level of General Fund revenues and expenditures, we and DOF would show the same number in the reserve line of a General Fund condition statement. Yet, DOF’s reporting of an operating shortfall would tend to be higher since its revenue total is lower. |
More Borrowing? Since its budget problems began at the start of the decade, the state has relied on numerous forms of borrowing and deferrals to help balance its books. This has included raising $11.3 billion from deficit–financing bonds, accelerating the receipt of two decades’ worth of tobacco settlement payments through securitization, borrowing funds from state special funds (particularly transportation), and shifting costs into the future. With the Governor and the Legislature unable to agree on major program reductions and/or a broad–based tax increase, these techniques have tended to be the “path of least resistance.” At this point, the state has $20 billion in outstanding borrowing from its previous budget problems. We therefore believe that additional borrowing or deferring more costs into the future should be considered only as a last resort.
Issue the Remaining Deficit–Financing Bonds? Given the magnitude of the state’s 2008–09 budget problem, however, we recognize that additional borrowing may be explored. One option in this regard would be to raise the remaining $3.7 billion from deficit–financing bonds as authorized by voters in 2004. If the Legislature wanted to pursue this option, there would be some legal and technical issues to explore to ensure the issuance meets constitutional restrictions and could provide immediate budgetary benefit to the General Fund. Such an approach would not be without its costs. The state’s debt payments through the triple flip and BSA would be extended into the future—making it harder to balance future budgets and incurring additional interest costs.
Leasing the Lottery? In May, the administration first suggested the notion of leasing the state Lottery to a private vendor on a long–term basis—in exchange for payments to the state. The underlying basis for the proposal is that a private vendor could enhance the performance of the Lottery. Although the administration has since suggested using a lease to help finance its health care proposal, it would be possible to reorient the concept back towards benefiting the General Fund. While changes to the Lottery are worth considering, the Legislature should approach using the Lottery as a budget solution with caution.
- Unknown Value. The administration has received estimates that the lease of a Lottery could yield between $14 billion and $37 billion in a one–time payment to the state. The amount the private sector would pay is not known and would depend largely on the “strings attached” to the deal by the Legislature and the state’s voters. If the proceeds were first used to hold education entities “harmless” (currently about $1 billion annually), then any net revenues available to the General Fund would be greatly reduced from the above estimates.
- Use of a One–Time Payment. Taking a one–time payment could offer a large influx of revenues that could be used to address the state’s near–term budget problem. The downside is that the availability of a lump sum could result in the state not taking the steps needed now to solve its longer–term budget problem.
- Difficult to Rely on in a 2008–09 Budget Plan. If the Legislature decided it wanted to pursue a Lottery lease as a budget solution, it would be difficult to build any benefit into the 2008–09 budget plan. This is because of its unknown value, as well as the time it would take to go to the state’s voters for authorization and process a lease agreement. Due to the uncertainty, we think the Legislature should recognize a realistic implementation time line and be wary of adopting an overly optimistic fiscal estimate of a Lottery lease.
Long–Term Perspective Needed. The magnitude of the 2008–09 budget problem makes it difficult to focus on the fiscal problems that loom in 2009–10 and beyond. Yet, the state’s structural budget problem will only be fully addressed once ongoing revenues and expenditures are brought into line and budgetary borrowing is repaid. In crafting its 2008–09 budget, therefore, the Legislature should keep an eye on improving the state’s long–term fiscal health through the adoption of as many ongoing solutions as possible. Making tough choices now will allow the state to move closer to putting its fiscal woes in the past.
Chapter 2
Economic and Demographic Projections
Economic and demographic developments are important determinants of California’s fiscal condition, primarily through their impacts on state revenues and expenditures in such areas as education, health, social services, corrections, and transportation. This chapter presents our economic and demographic projections for calendar years 2007 through 2013, which will affect California’s budgetary condition during the period 2007–08 through 2012–13.
The Economic Outlook
We expect both the national and state economic expansions to continue during the forecast period, although growth will likely remain subdued through 2008.
Figure 1 summarizes our forecasts for key economic variables for both the nation and California. In the subsequent sections, we discuss our forecasts in more detail and the major factors underlying our outlook.
Figure 1
The LAO’s Economic Forecast |
Percentage Change (Unless Otherwise Indicated) |
|
2007 |
2008 |
2009 |
2010 |
2011 |
2012 |
2013 |
United States |
|
|
|
|
|
|
|
Real gross domestic product |
2.1 |
1.9 |
2.9 |
2.9 |
2.8 |
2.7 |
2.4 |
Personal income |
6.5 |
4.7 |
5.1 |
5.4 |
5.2 |
5.2 |
4.9 |
Wage and salary jobs |
1.3 |
0.7 |
1.2 |
1.3 |
1.2 |
1.1 |
0.8 |
Consumer Price Index |
2.7 |
2.2 |
1.9 |
2.0 |
1.8 |
1.8 |
1.9 |
Unemployment rate (%) |
4.6 |
5.0 |
4.9 |
4.8 |
4.6 |
4.5 |
4.5 |
Housing starts (000) |
1,344 |
1,102 |
1,389 |
1,577 |
1,705 |
1,711 |
1,699 |
California |
|
|
|
|
|
|
|
Personal income |
5.3 |
4.9 |
5.3 |
5.6 |
5.6 |
5.7 |
5.6 |
Wage and salary jobs |
1.1 |
1.0 |
1.3 |
1.7 |
1.6 |
1.7 |
1.6 |
Taxable sales |
3.2 |
3.8 |
4.7 |
6.0 |
5.9 |
5.8 |
5.7 |
Consumer Price Index |
3.3 |
2.7 |
2.2 |
2.2 |
2.0 |
1.9 |
1.9 |
Unemployment rate (%) |
5.3 |
5.7 |
5.6 |
5.4 |
5.3 |
5.2 |
5.1 |
Housing permits (000) |
121 |
125 |
149 |
159 |
167 |
172 |
175 |
The U.S. Economy
Recent Developments
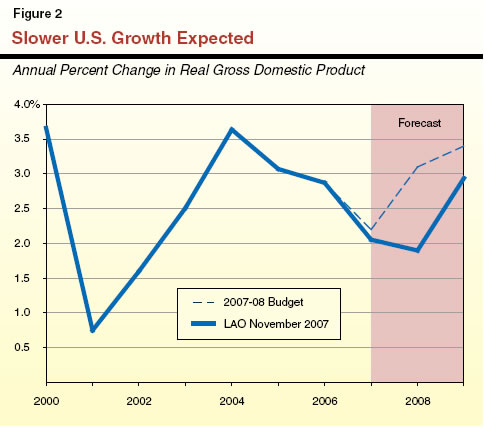
Economy Has Generally Been Slowing. Figure 2 shows that after expanding by 3.6 percent in 2004, U.S. gross domestic product (GDP) growth slowed to 3.1 percent in 2005 and a bit more to 2.9 percent in 2006. For 2007, based on performance thus far, it is expected to slow further in the fourth quarter and show a sharp decline to 2.1 percent for the year as a whole.
Within the context of this pattern of overall economic slowing since 2004, however, the quarter–to–quarter growth pattern has been quite choppy, which has given mixed signals and made it difficult at times to clearly discern exactly what the underlying trends in the economy are and where it is heading.
But Haven’t Recent Developments Been More Positive? Recently released preliminary estimates are that real GDP growth in the third quarter was an unexpectedly strong 3.9 percent, buoyed particularly by exports and surprisingly by consumer spending, and well above the sub 3 percent pace anticipated by most economists. In addition, growth in payroll employment in October was surprisingly strong, the unemployment rate held steady, and productivity growth was good. Despite these recent positive reports, however, most economists believe that the economy is currently in a slowing mode. It was in recognition of this that the Federal Reserve recently reduced its key interest rate by three–quarters of a percent. A variety of data show underlying economic softness in a number of areas. For example:
- Despite October’s good payroll jobs report, the number of new jobs created over the past three months averaged only 60 percent of what occurred a year ago.
- An alternative jobs measure—the employment survey of households—showed a loss in October of 250,000 workers, its third decline in the last four months.
- The manufacturing sector was barely growing in October, seen by some as evidence that the impact of the slowdown in the housing and financial sectors has started spilling over into manufacturing.
- Real spending and real disposable incomes both slowed in September.
- Core inflation in September was holding steady at a modest 1.8 percent 12–month increase, consistent with slack conditions in the labor and product markets.
The Bottom Line—Softness Despite Uncertainties and Mixed Signals. Given such factors, most economists expect a significant slowing to occur in the fourth quarter. In addition, considerable uncertainty exists, as evidenced in some of the recent large daily stock market swings and gold price movements.
A number of factors appear to have been contributing to the current economic slowing, such as overextended consumer balance sheets caused both by past high levels of borrowing and low savings rates. The most important, however, is the continuing and deepening turmoil in the housing and mortgage credit markets, followed by recent significant increases in crude oil prices.
The Forecast—Subdued Growth in 2008 With Some Rebound in 2009
Led by continuing problems in the housing sector and high oil prices, we expect the overall economy to be depressed in 2008 with GDP growth below 2 percent through much of the year. Figures 1 and 2 earlier show that, for 2008 as a whole, real GDP growth is forecast to be only 1.9 percent, before rebounding to 2.9 percent in 2009 and ranging between 2.4 percent and 2.9 percent for the rest of the forecast period. The economy is expected to be particularly weak in the first half of 2008, largely due to intensification of the housing correction currently underway. Figure 2 also shows that our projected growth has been reduced significantly from what was assumed in the 2007–08 Budget Act. The main components of our forecast are as follows:
- Real consumer spending growth will slow from 2.9 percent in 2007 to 2 percent in 2008, before partially rebounding to an average annual pace of around 2.8 percent during the balance of the forecast period.
- New vehicle sales will be soft, reflecting both subdued income and job growth as well as high gasoline prices. We forecast that unit sales of new light vehicles (automobiles and light trucks) will drop in 2008 to 15.9 million, their third straight annual decline.
- Residential construction spending adjusted for inflation, following a nearly 17 percent drop in 2007, is forecast to fall by another 19 percent in 2008, before rising by a modest 5.9 percent in 2009. Thereafter, growth is forecast to stabilize at around 10 percent annually. The greatest volatility over the forecast period will be associated with the single–family portion of the market.
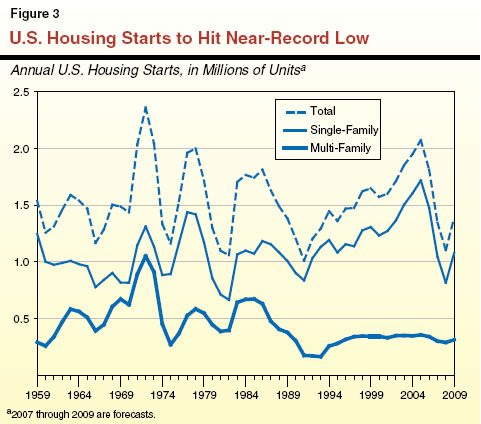
- Housing starts themselves are predicted to drop to only 1.1 million units in 2008. This is down from the reduced level of 1.3 million units in 2007 and the nearly 2 million average level of the three years before that. They will then rebound partially to 1.4 million units in 2009 and settle–in at about 1.7 million units for the following several years. As shown in Figure 3, the 2008 level will be a near–record low, primarily reflecting the sharp fall–off in single–family units.
- Nonresidential construction is expected to take up at least some of the slack caused by the housing slump and partially offset the weakness in residential construction, despite the weaker economy and soft corporate profits. This has already been occurring, in part reflecting the freeing–up of construction resources due to the housing downturn.
- Real business investment growth will continue to slow further to 2.2 percent in 2008, from 3.8 percent in 2007, and 6.6 percent in 2006. After this, it should stabilize at close to 4 percent for the remainder of the forecast period. Of special note is that real spending on information technology equipment and software is expected to remain healthy—a plus for California which has a large number of firms and workers which design and produce computer and software products.
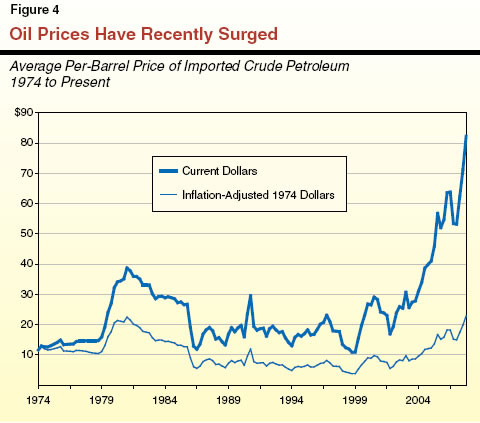
- Oil prices experienced a sharp rise during 2007 and recently reached record highs. As shown in Figure 4, the inflation–adjusted average price of imported oil (which applies to most of the oil we use) is currently at its all–time quarterly peak that was reached more than 25 years ago. We anticipate oil prices to continue to experience quarterly volatility but remain high throughout the forecast period, averaging roughly $80 per barrel. Given the oil–price outlook, gasoline prices also are expected to remain high during the forecast period. While gasoline prices are expected to continue to follow traditional seasonal volatility patterns, their annual summertime peaks are forecast to remain in the range of $3 per gallon. The high oil and gasoline prices we are forecasting will clearly be a drag on the rate of overall economic growth, but are not expected to derail the expansion.
- Inflation is one of the positive elements in the outlook, as it is predicted to be relatively modest despite high oil and gasoline prices. After steadily dropping in the past several years—from 3.4 percent in 2005 to 3.2 percent in 2006, and an estimated 2.7 percent in 2007—growth in the Consumer Price Index is predicted to settle–in at about 2 percent for the forecast period. Despite some pressure from selected areas like energy and medical costs, core inflation (which excludes energy and food costs) will be held down by such factors as soft housing cost increases and slack in the nation’s product and labor markets caused by subdued economic growth and the housing correction.
- Interest rates are projected to dip modestly in 2008 as economic growth and inflation eases, but then firm back up in 2009 and increase slightly thereafter as the economy strengthens.
The California Economy
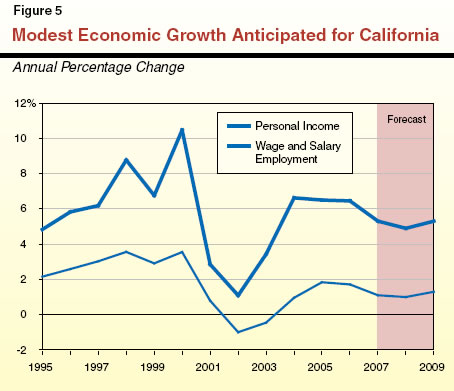
The current economic situation and outlook for California are generally similar to the nation as a whole, although the turmoil in the state’s housing and mortgage markets has been more pronounced than nationally, making its outlook a bit more sluggish. Economic growth in 2008 is expected to be slow, especially in the first half of the year, with recovery beginning later in the year and continuing into 2009. Figure 1 earlier shows our forecast for selected California economic variables, while Figure 5 shows our growth pattern for the forecast period and earlier years for two key variables—personal income and wage and salary employment.
Recent Evidence of Slowing
After healthy gains in 2004 through 2006, a variety of economic indicators suggest that economic growth slowed for the state as 2007 progressed. For example, growth in both wage and salary employment and taxable sales declined, the unemployment rate rose, and new residential building permits dropped.
Key Factors Behind Slowdown—Real Estate and Energy
The key forces behind the economic slowdown that is being experienced in California are the same as for the nation—namely, sharply declining real estate markets and, to a somewhat lesser though still–important degree, high energy and gasoline prices. In fact, the adverse effects of these negative forces tend to be even greater in California than for the rest of the country, reflecting (1) the state’s growth–oriented and highly cyclical real estate sector, which generally has expanded more in boom years and fallen further than the rest of the country during downturns, and (2) its higher–than–average gasoline prices and gasoline consumption.
While both of these factors are expected to negatively impact California’s economic performance in 2008 and 2009, this is especially true for the real estate sector. As discussed in the nearby box, a major real estate correction is currently underway that is expected to get worse before it runs its full course. Although its initial major adverse effects appear to be primarily falling on homeowners, housing–related industries, and financial institutions directly involved, there will undoubtedly also be various eventual negative spillover effects on the economy at large.
The Real Estate Situation
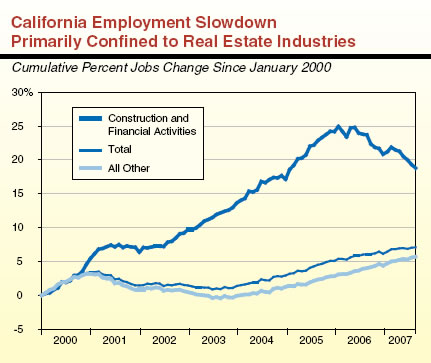
California’s real estate–related industries—which include developers, contractors, real estate brokers, financial institutions, title companies, and insurers—have in recent years accounted for roughly 15 percent to 20 percent of the state’s private sector economy. Changes in real estate asset values and mortgage refinancing activity can also have substantial indirect impacts on other sectors of the economy, such as consumer spending.
Major Real Estate Correction Underway
California is now in the midst of a major real estate correction, in part due to the state’s overheated housing market and in part to the sub–prime mortgage market crisis that followed the early 2000s’ housing boom.
Record Upswing. . . The state experienced an unprecedented boom in its real estate markets between 2001 and 2005, fueled not only by basic demand for housing by California’s growing population, but also speculation by real estate investors and increased use of sub–prime mortgage loans and risky lending standards to facilitate home buying by marginally qualified purchasers. During this period, inflation–adjusted home prices doubled, sales reached all time highs, and new construction registered its highest levels in nearly 15 years. As shown in the figure, these increases dramatically boosted employment during this period (and as a result of this, incomes and spending), both in those sectors most closely tied to real estate–related activities and California’s economy generally.
. . .Then the Bubble Burst. California’s real estate market peaked in mid–2005, however, and since then, home sales and new construction activity have fallen sharply and by proportionally more than for the rest of the nation. The growing number of mortgage delinquencies, outright foreclosures, rising unsold home inventories, and regions experiencing flat or declining home prices, indicate that further intensification of the housing correction and related softness in building activity are in store. This is particularly true because many of the mortgage loans written near the peak of the boom with temporarily favorable interest rates will have their rates reset at higher levels in the near future. Equally important, many homeowners who were recently approved loans without the long–term ability to realistically afford them, due to relaxed lending standards, will be finding it increasingly difficult to make their payments. Exacerbating the problem is the softness in housing prices, which has precluded many distressed owners from refinancing or having access to home equity. All of these factors will be putting increased financial pressures on the homeowners and financial institutions involved.
How Will the Economy Be Affected?
These problems involving the real estate industry and related financial sector will have major adverse impacts in a number of ways. For example, many realtors, developers, contractors, and real estate lenders in California will lose income for at least the next couple of years, and the profits of certain financial firms will be negatively impacted. Likewise, reductions in home values will adversely affect the financial condition of many households, which will likely slow consumer spending. Adverse economic effects will also result from the casualties of the meltdown in the sub–prime mortgage market, including displaced homeowners and financial investors having lost money. Among the industries most vulnerable are home–related financials, producers of home furnishings and appliances, and manufacturing operations related to home construction—such as wood products, cement, steel fabrication, and furniture.
So Far, However, Employment Losses Still Relatively Concentrated. As shown in the figure, thus far the job–related losses California has experienced beginning a couple of years ago have largely been confined to real estate–related industries such as construction and financial services, and not spread more broadly to other areas of the economy. Many economists would expect, however, that eventually various spillover effects on the economy at large will materialize to some degree.
Regional Effects Will Vary. The effects on the economy also will vary geographically, depending on such factors as the prevalence of high–risk loans granted in different regions and the amount of speculative housing activity characterizing them. For example, the Central Valley and Inland Empire appear particularly at risk. An analysis by the Wall Street Journal found that 12 California metropolitan areas, most of them inland, rank in the top 45 nationally in terms of the percentage of loan volume issued in 2006 that is high risk. |
Specifics of the Forecast
As shown previously in Figure 1 and Figure 5, our outlook for California includes the following forecasts for specific economic variables:
- Personal income growth is predicted to slow, from 6.5 percent in 2006 to 5.3 percent in 2007 and then to 4.9 percent in 2008. We see it then partially rebounding to 5.3 percent in 2009 before averaging roughly 5.6 percent through the remainder of the forecast period.
- Wage and salary employment growth is predicted to drop significantly, from 1.7 percent in 2006, to 1.1 percent in 2007, and a bit further to 1 percent in 2008. Thereafter, it is forecast to accelerate slightly to 1.3 percent in 2009 and average 1.7 percent for the rest of the period.
- Taxable sales growth is expected to be soft in 2008 at 3.8 percent following 2007’s very weak 3.2 percent, before firming up a bit in 2009 at 4.7 percent. In all three of these years, taxable sales growth is expected to be well below that of personal income.
- New residential building permits are expected to bottom–out in the vicinity of 120,000 units in both 2007 and 2008.
How Will Individual Sectors Do? Performance by industry will vary. The weakest areas will clearly involve real estate–related industries such as residential construction and finance. In contrast, solid growth should occur involving international trade, which is benefiting California manufacturers and farmers that sell abroad, as well as transportation, warehousing, and distribution activities associated with trade activity through California’s ports. Likewise, continued strength is foreseen for information–related industries (including motion pictures, sound recordings, publishing, and Internet service providers). Healthy growth in California’s high–tech and related professional services industry is also expected, including software development, computer systems and design, biotechnology, and pharmaceuticals.
Risks to the Outlook
Although our forecasts for the nation and California are what we believe to be the most likely economic outcomes, there are both inherent risks and uncertainties in the outlook. The main ones continue to involve housing and energy.
- On the housing front, California continues to be in uncharted territory in terms of exactly where the current market correction will end up regarding home prices and building activity, as well as how long it will take for the correction to run its course. For example, our forecast assumes that price and construction declines will not become extreme by historical standards, reflecting the overall long–term positive outlook for California’s economy. However, steeper reductions could occur, which in turn would further depress economic growth in the state over the next couple of years.
- Regarding energy costs, the main concern is that recent sharp increases in oil prices might continue, due to such factors as the market’s vulnerability to unexpected supply disruptions, rising political tensions in various global regions, and increasing worldwide demand for oil as China and certain other nations continue to rapidly industrialize. Gasoline prices also are always vulnerable to supply disruptions involving not only crude oil, but also refinery operations. Adverse developments in these areas could place upward pressures on inflation and interest rates, as well as significantly disrupt economic activity generally.
The Demographic Outlook
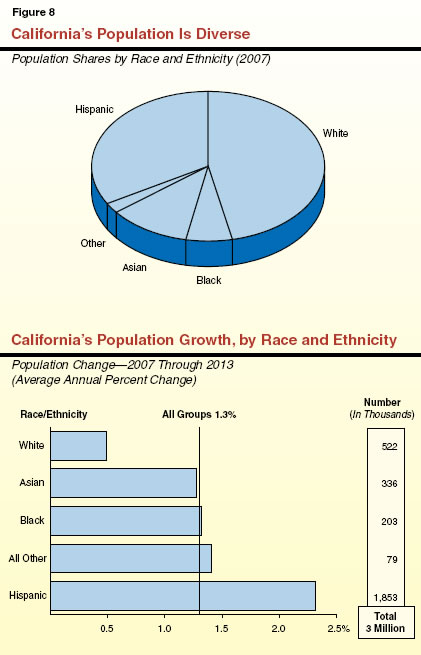
California’s population currently totals approximately 38 million persons. During the six–year forecast period covered in this report, Figure 6 shows that the state’s population growth is projected to average a bit under 1.3 percent annually. In terms of numbers of people, this modest annual growth rate translates into about 500,000 people yearly, and is roughly equivalent to adding a new city the size of Long Beach to California each year. As a result, California will add about 3 million people over the forecast interval and reach over 40 million by 2013.
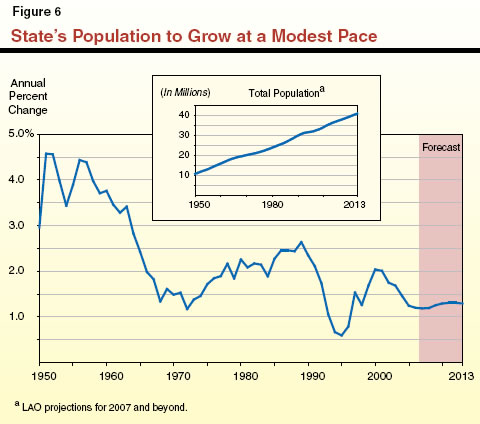
The population growth rate we are projecting, while slightly more than for the last couple of years, is somewhat slower than that experienced in the late 1990s and early 2000s, when annual growth was averaging about 1.6 percent. This reflects a number of factors, including the dampening effects of the large housing price increases and more subdued employment growth rates of recent years on in–migration. Another factor is the reduced birth rates being recorded by certain segments of California’s female population.
Population Growth Components
California’s population growth can be broken down into two major components—natural increase (the excess of births over deaths) and net in–migration (persons moving into California from other states and countries, minus those leaving California for out–of–state destinations). On average, these two components have tended in the past to contribute about equally over time to the state’s population growth. However, their relative shares can vary significantly from one year to the next depending largely on the strength of the net in–migration component—by far the most volatile element. For example, during the past several years, in–migration has accounted for about 30 percent of California’s annual population change, reflecting a sharp drop in growth from interstate population flows.
Natural Increase. We project that the natural–increase component will average close to 315,000 new Californians annually over the forecast period. This net natural gain reflects an average of somewhat over 565,000 births annually partially offset by somewhat over 250,000 deaths annually.
Our forecast incorporates the well–documented trend of declining birth rates that has been in effect for essentially all ethnic groups in recent years in California. Despite these declining birth rates, however, the number of new births in our forecast actually trends up a bit through 2013. This is due to significant growth in the female population of child–bearing age groups in the faster–growing segments of California’s population, including Hispanic and Asian women. As a result, even after accounting for growth in the number of deaths occurring annually in California, we project that the natural increase component will grow slightly during the latter half of the forecast period.
Net In–Migration. We project that combined domestic and foreign net in–migration will average roughly 185,000 annually over the next six years. This is less than during the latter half of the 1990s and in the early 2000s, when annual net in–migration averaged about 260,000. It also is considerably less than the projected 315,000 natural–increase component noted above. Regarding this in–migration:
- Most of the net in–migration we are projecting reflects foreign net in–migration from other nations. This component has been relatively stable over the past decade and has proved to be less sensitive to the economy than domestic population flows between states. We forecast net foreign in–migration will be fairly constant through 2013, averaging about 200,000 annually.
- Regarding domestic net in–migration, this is arguably the single most difficult demographic variable to forecast at this time. The available data indicate that this component turned negative starting in 2004 (that is, more people left California for other states than flowed–in from them), and became even more so in the following couple of years, reaching over 78,000 in 2006. In large part, this appears attributable to California’s continued modest job growth and high home prices. Our forecast is for continued net domestic out–migration in the short term. Although we do expect the net domestic outflows to taper off and eventually reverse themselves, we do not foresee a return to net interstate population in–flows for several years. And, after this, only modest net domestic in–flows of 5,000 annually are anticipated toward the end of the forecast period. Over our entire forecast interval, net domestic out–migration will average close to 20,000 annually.
Growth to Vary Significantly By Age Group
Figure 7 shows our population growth projections by broad age categories, including both numerical and percentage growth.
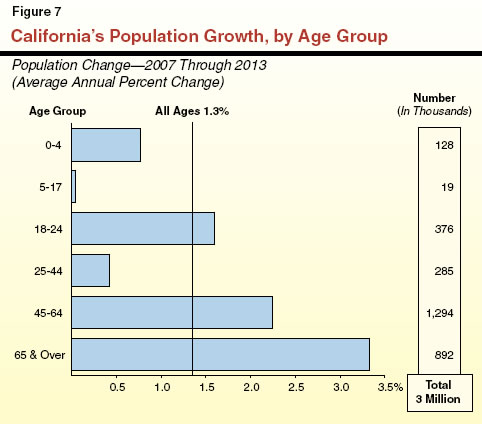
“Baby Boomers” Swelling 45–to–64 Age Group. The 45–to–64 age group (largely the baby boomers) continues to be by far the fastest growing segment of the population numerically and the second–fastest percentage wise. Nearly 1.3 million new people are expected to move into this age category over the next six years for an annual average growth of 2.2 percent.
Slow Growth for Children. At the other extreme, slow growth—well under 1 percent—is anticipated for preschoolers and the K–12 school–age population. This reflects several factors. One is the movement of children of the “baby–boom” generation beyond the upper–end of the 5–to–17 age group, which partially explains the above–average growth in the 18–to–24 age category. Other factors include the slower rate of net in–migration, and the decline in birth rates in recent years that has reduced the number of children moving into the preschool and school–age categories.
Rapid Growth for the Elderly. The single–fastest–growing age group percentage wise and second–fastest numerically is the 65–and–over category, reflecting the well–known “graying” of the population. This cohort is expected to increase at an annual average pace of 3.3 percent.
Fiscal Effects. These various age–group demographic projections can have significant implications for the state’s revenue and expenditure outlook. For example, strong growth of the 45–to–64 age group generally benefits tax revenues since this is the age category that routinely earns the highest wages and salaries. Likewise, the growth in the young–adult population affects college enrollments, those for the 0–to–4 and 5–to–17 age groups drives K–12 enrollment growth, and that for the elderly impacts medical care costs.
Other Demographic Features
In addition to age, projected population growth will also differ markedly along other dimensions. For example:
- Racial/Ethnic Variation. Figure 8 indicates that California’s population is very diverse in terms of its racial/ethnic composition. In addition, the amounts and rates of population growth along these dimensions will differ significantly for different groups. The Hispanic population is forecast to experience especially strong growth, averaging over 2.3 percent annually and accounting for over 60 percent of California’s total population growth between 2007 and 2013.
- Geographic Variation. Rates of growth will be above average for the state’s Central Valley, Inland Empire, and foothills areas. This will occur as the availability of land allows population to continue to “fill in” and attract people from the more–congested coastal areas within the state. Such high–growth regions will increasingly face new challenges in providing the public services and infrastructure to accommodate growth.
Chapter 3
Revenue Projections
The revenues that finance California’s state General Fund budget come from numerous sources, including taxes, fees, licenses, interest earnings, loans, and transfers. However, almost 95 percent of the total is attributable to the state’s “big three” taxes—the personal income tax (PIT), the sales and use tax (SUT), and the corporation tax (CT). In this chapter, we summarize our updated General Fund revenue projections and provide detail behind our key revenue–related assumptions. We also discuss the outlook for property taxes in the shaded box below. Although a local revenue source, these property tax revenues have significant implications for the state budget due to their effects on General Fund spending on Proposition 98.
Outlook for Property Taxes—Much Slower Growth
Property taxes are projected to total $47 billion during 2007–08, making it the second–largest state–local government revenue source in California. In the current year, about one–third of property tax revenues will go to schools, while the remainder will be apportioned among cities, counties, and special districts. Under Proposition 13, real property (land and buildings) is reassessed to market value only when it changes ownership. Otherwise, the assessed value grows by no more than 2 percent a year. An assessment also can be reduced (through a process initiated by the assessor or property owners under Proposition 8) when the estimated market value of a property falls below its assessed value.
Despite the dedication of property tax revenues to local governments, the state is affected by changes in local property taxes. Under Proposition 98, state funding for K–14 education is generally offset, dollar–for–dollar, by the amount of local property taxes available to school and community college districts.
Property Taxes Grew Rapidly in Recent Years. . .
The recent real estate boom of the early 2000s led to more than a 60 percent increase in local property tax revenues between 2001–02 and 2006–07, and about a 40 percent real increase after adjusting for inflation. The inflation–adjusted increase is the largest of any same–length period since the passage of Proposition 13 in 1978. This unprecedented growth resulted from increased property assessments, and has had beneficial impacts on both state and local government finances in recent years. The large increase over the period reflects a combination of soaring real estate prices and historically high sales rates (both of which led to large reassessments), and large increases in new construction activity. Property turnover was responsible for the largest share of revenue growth during this period.
. . . But Much Slower Growth Is Forecast
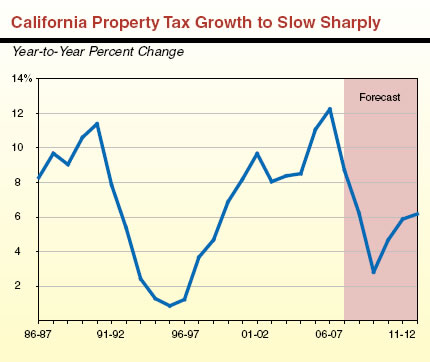
During the boom years, annual statewide property tax growth averaged nearly 10 percent (see accompanying figure), reflecting assessment growth. However, the slowdown in the real estate market that is currently underway in California and we see as intensifying, will lead to much slower growth in assessed property values, and thus property tax revenues, during the next several years. Factors leading to lower growth include (1) a reduced level of property sales (and hence fewer upward assessments of property to their current market values), (2) less new construction, and (3) less average growth in assessed values for property that is sold. Depending on the magnitude of future price declines in the real estate market, downward assessments (under the Proposition 8 process) of certain recently purchased property also will have a negative impact on assessed values during the next several years. This has already been occurring, with tens of thousands of properties having been reassessed downward by billions of dollars statewide.
As shown in the figure, and consistent with our forecast for assessed value growth, we are projecting that annual growth in property taxes will slow sharply in the near term—from 12 percent in 2006–07 to below 9 percent in 2007–08, about 6 percent in 2008–09, and about 3 percent in 2009–10—before rebounding modestly in subsequent years. Our forecast, however, is highly dependent on the length, scope, and severity of the correction in the real estate market, and our figures could be significantly overstated if the slump proves to be more pronounced than we are assuming. For example, each 1 percentage point reduction in the rate of growth in statewide assessed values translates into over $450 million of ongoing reduced local property tax revenues annually, and roughly $150 million of increased yearly General Fund Proposition 98 obligations.
|
|
Recent Developments and Overall Outlook
Revenues have been falling short of expectations since the 2007–08 Budget Act was adopted, largely reflecting the state’s weaker economic performance than was predicted last May when the budget’s economic and revenue forecasts were put together. Preliminary estimates indicate that revenues in 2006–07 fell short of the 2007–08 Budget Act estimate by $435 million. Likewise, tax receipts during the first quarter of 2007–08 fell short of their estimate by over one–half a billion dollars, with all of the largest revenue sources coming in low. Partial–month receipts for the month October were also down, by another several hundred million dollars. Given this combination of weakness in the economy and accumulating shortfalls in cash receipts, we have revised our projections for General Fund revenues downward—and by a significant amount.
Key Revenue Components Are Exhibiting Weakness
Looking broadly at the different components of the revenue base, many of the main ones have showed softness thus far in 2007–08 compared to estimated levels. For example:
- Although PIT withholding receipts are running slightly ahead of their estimate (up $77 million through October relative to their $10.7 billion 2007–08 Budget Act estimate), the remaining sources of PIT monies, such as tax prepayments by high–income individuals on their investments, are down by about $450 million after adjusting for cash–flow anomalies.
- Receipts under CT were down over the same period by $160 million for prepayments (5.4 percent from their estimate) and $60 million from all sources, suggesting softness in taxable corporate profits.
- SUT receipts were down by about $440 million through October. Although some of this shortfall may be related to the Southern California fires, it also is consistent with taxable sales growth having been lower than projections, averaging less than 2 percent in recent quarters.
The Bottom Line on Revenues— Significant Downward Adjustment
Based on recent cash and economic developments, and their future implications, we have significantly reduced our projected revenues relative to the 2007–08 Budget Act forecast. Figure 1 shows our updated revenue estimates for the prior year (2006–07) and current year (2007–08), and compares them to the projections assumed in the 2007–08 Budget Act. Figure 2 shows our revenue projections for the entire forecast period, ending in 2012–13.
Figure 1
Revised LAO Revenues for 2006-07 and 2007-08
Compared With 2007-08 Budget Act |
(In Millions) |
|
|
2006‑07 |
|
|
|
2007‑08 |
|
Revenue Source |
Budget Act |
LAO |
Difference |
|
Budget Act |
LAO |
Difference |
Personal Income Tax |
$52,243 |
$51,636 |
-$607 |
|
$55,236 |
$54,227 |
-$1,009 |
Sales and Use Tax |
27,787 |
27,445 |
-342 |
|
28,820 |
28,196 |
-624 |
Corporation Tax |
10,717 |
11,062 |
345 |
|
11,055 |
10,669 |
-386 |
Other revenues and transfers |
5,266 |
5,435 |
169 |
|
7,151 |
5,823 |
-1,328 |
Total Revenues and Transfers |
$96,013 |
$95,578 |
-$435 |
|
$102,262 |
$98,916 |
-$3,346 |
Figure 2
The LAO's General Fund Revenue Forecast |
(Dollars in Millions) |
Revenue Source |
2006-07 |
2007-08 |
2008-09 |
2009-10 |
2010-11 |
2011-12 |
2012-13 |
Personal Income Tax |
$51,636 |
$54,227 |
$56,754 |
$60,151 |
$64,121 |
$68,345 |
$73,005 |
Sales and Use Tax |
27,445 |
28,196 |
29,560 |
31,198 |
33,082 |
35,085 |
37,184 |
Corporation Tax |
11,062 |
10,669 |
11,337 |
12,006 |
13,088 |
14,021 |
14,953 |
Other revenues and transfers |
5,435 |
5,823 |
5,861 |
5,637 |
6,816 |
7,511 |
7,744 |
Total Revenues and Transfers |
$95,578 |
$98,916 |
$103,512 |
$108,991 |
$117,108 |
$124,962 |
$132,886 |
(Percentage Change) |
2.3% |
3.5% |
4.6% |
5.3% |
7.4% |
6.7% |
6.3% |
2006–07 Revenues—Down $435 Million. Based on preliminary reports by both the State Controller and the state’s tax agencies for 2006–07, we estimate that General Fund revenues and transfers totaled $95.6 billion during the year—a 2.3 percent rise from 2005–06. As Figure 1 shows, this is down $435 million from the level assumed in the 2007–08 Budget Act. This change reflects the net effect of a variety factors, including accrual adjustments. About $600 million of the reduction is from taxes, partially offset by a gain from other revenues. The main reason for the gain in the other revenue category is attributable to prior–year Medi–Cal quality assurance fee revenue being recognized on a one–time basis in 2006–07.
2007–08 Revenues—Down $3.3 Billion. We project that General Fund revenues and transfers will total $98.9 billion in 2007–08, a 3.5 percent increase from 2006–07. As Figure 1 shows, our revised revenue total is down by $3.3 billion from the estimate contained in the 2007–08 Budget Act. This drop consists of declines in taxes of $2.1 billion—including $1 billion from PIT. The remaining $1.2 billion of the drop is primarily due to (1) reducing the $1 billion in assumed 2007–08 revenues from the sale of EdFund to $500 million, and moving it out of the current year and into 2008–09 (please see related discussion in Chapter 1) and (2) declines of about $200 million each in estimated revenues from tribal gambling activity and child support–related revenues, partially offset by gains from oil royalties and in interest income.
2008–09 Revenues—Modest Growth. As shown in Figure 2, we forecast that total General Fund revenues and transfers will be $103.5 billion in 2008–09, a 4.6 percent increase from the current year.
2009–10 Through 2012–13. We project that revenue growth will accelerate modestly in 2009–10 to 5.3 percent, and then rise a bit and average about 6.8 percent annually through 2012–13. This assumes the return of the state’s “pick–up” estate tax, which is scheduled under current law to come back into effect January 1, 2011. Without this estate–tax factor, revenue growth beyond the budget year would average about 6 percent, or slightly more than our projected personal income growth of 5.9 percent for the period—as typically occurs during periods of economic expansion.
Detail on Individual Revenue Sources
Personal Income Tax
We estimate that PIT receipts totaled $51.6 billion in 2006–07 (a modest 3.5 percent increase from the year before) and will grow to $54.2 billion in 2007–08 (a 5 percent gain from the prior year). The PIT revenues are projected to grow further to $56.8 billion in 2008–09, a 4.7 percent increase from the budget year, and at an average annual rate of 6.5 percent thereafter.
Key Forecast Factors. As noted earlier, our PIT forecast for 2007–08 is down by $1 billion relative to the 2007–08 Budget Act forecast. Part of this drop is related to the across–the–board shortfall reported thus far in receipts for all PIT components except for withholding. This includes estimated, final, and miscellaneous payments, which are very much affected by payments of high–income individuals, including those with large amounts of bonus and investment income, capital gains, and stock options. As shown in Figure 3, we accordingly have assumed a relatively flat forecast for both capital gains and stock options in 2007 and 2008. This is consistent both with recent cash trends and economic and financial developments influencing these income sources.
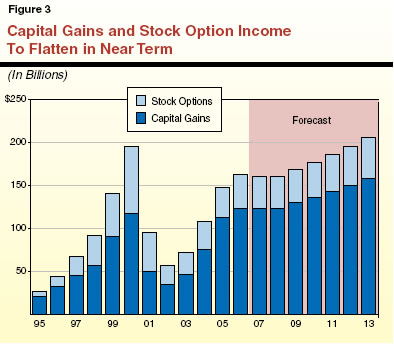
Our forecast also reflects an assumed loss in taxable earnings related to sales, construction, and financing of homes due to the housing downturn, as well as from the overall slowing in economic growth in the state.
Given the above, as shown in Figure 4, PIT liabilities are predicted to grow slowly by roughly 3.9 percent in both 2007 and 2008, before picking up to 5.8 percent in 2009. Over the longer term, we forecast that PIT liability and revenue growth will be a bit stronger and moderately faster than statewide personal income. This is primarily due to California’s progressive tax rate structure, under which higher real income levels are subject to higher marginal tax rates.
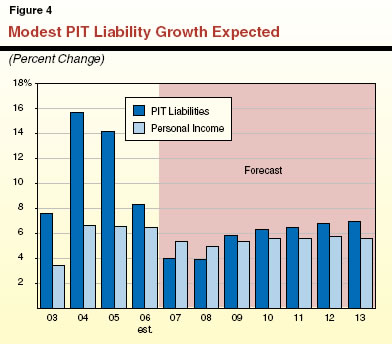
Sales and Use Taxes
We estimate that SUT receipts totaled $27.4 billion in 2006–07, a 0.5 percent decline from 2005–06. The updated total is down $342 million from the 2007–08 Budget Act estimate, reflecting year–end cash deposits and accrual adjustments. We forecast that SUT receipts will total $28.2 billion in 2007–08—a modest 2.7 percent increase from 2006–07—and reach $29.6 billion in 2008–09, a 4.8 percent increase from the current year. Over the balance of the forecast period, SUT revenues are projected to increase at an average annual rate of 5.9 percent, or on par with personal income.
Key Forecast Factors. The main determinant of SUT receipts is taxable sales. About two–thirds of these sales are related to retail spending by consumers, while the remainder are related both to building materials that go into new construction and to business–to–business transactions that are taxed because the purchaser is the item’s final consumer. The SUT is levied on purchases of tangible personal property, and services are thus largely exempt.
Regarding our taxable sales forecast:
- Taxable sales growth slowed sharply around mid–year 2007 after decelerating in 2006 to 3.9 percent, down from 7.4 percent in 2005. They grew by only 1.3 percent in the second quarter of 2007 over the prior year’s level, likely related to the downturn in real estate, which is negatively affecting sales related to building materials and home furnishings. A second factor is high levels in recent quarters of gasoline prices, which appear to have depressed certain “big ticket” consumer spending items, including light trucks and SUVs.
- As shown in Figure 5, we expect that taxable sales will continue to be on the soft side in the near future, with annual growth dropping from the already–weak 2006 level to just 3.2 percent in 2007 and 3.8 percent in 2008. We then see taxable sales growth firming up somewhat in 2009 to 4.7 percent, though still trailing growth in income, and averaging 5.9 percent thereafter throughout the forecast period.
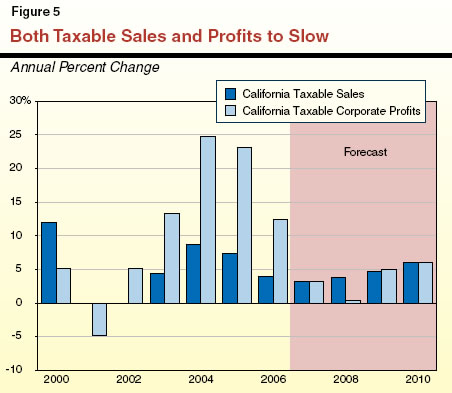
A second factor affecting the strength of General Fund SUT receipts is the transfer of specified sales taxes on gasoline and diesel fuel to the Public Transportation Account. These transfers amounted to $933 million in 2006–07 and are projected to reach $1.2 billion in 2007–08 (down $93 million from the $1.3 billion assumed in the 2007–08 Budget Act). In 2008–09, we project these transfers will total $1 billion and remain in that range through the end of the forecast period.
Corporation Taxes
We estimate that CT receipts totaled $11.1 billion in 2006–07, a 7.2 percent increase from the previous year. We forecast that receipts from this source will then decline to $10.7 billion in 2007–08 (a 3.5 percent drop), before rebounding to $11.3 billion in 2008–09 (6.3 percent growth). Over the four subsequent years of the forecast, we project that CT receipts will expand at an average annual rate of 7.2 percent.
Key Forecast Factors. The single most important factor underlying CT receipts is California taxable corporate profits. As shown in Figure 5, they jumped by an average of over 18 percent annually from 2003 through 2006, including nearly 25 percent apiece in 2004 and 2005, reflecting widespread gains among a variety of industries. Late in 2006, however, earnings growth started to flatten out, and profits ended up growing by 12.4 percent. Since that time, overall profit growth has continued to slow.
We forecast that California taxable profits will grow at a sluggish pace in 2007 and 2008 of 3.2 percent and 0.3 percent, respectively, before rebounding to 5 percent in 2009 and slightly higher growth thereafter. Positive factors in the longer–term profit outlook are continued growth in worker productivity and expanding markets for California–produced goods, both in the U.S. and abroad.
A second factor affecting the CT revenue forecast is the various adjustments that need to be made for legislation and other matters influencing tax collections. These include continuing reduced annual audit collections due to previously accelerated tax payments associated with the state’s most recent amnesty program (a current–year reduction of $610 million). There also are reduced limited liability company fees associated with recent legislation enacted in response to outstanding litigation involving such fees (a $40 million ongoing reduction beginning in the current year). Our forecast also incorporates factors such as revenue costs of the Research and Development Tax Credit and net operating loss deductions, which combined will reduce CT revenues by about $1.8 billion in the budget year.
Other Revenues, Transfers, and Loans
The remaining 5 percent of General Fund revenues includes taxes on insurance premiums, alcoholic beverages, and cigarette distributions, as well as fees, interest on investments, asset sales, oil royalties, tribal gambling revenues, and loans and transfers between the General Fund and special funds.
As shown in Figure 2 earlier, we estimate that revenues from this category were $5.4 billion in 2006–07, and estimate them to total $5.8 billion in 2007–08 and $5.9 billion in 2008–09. The figure also shows them rising significantly in 2010–11 and thereafter. This increase is entirely due to the return of California’s pick–up estate tax as provided for under current law. (This tax is based on the federal credit allowed to states for taxes paid by their residents, and thus does not increase individuals’ total tax liabilities.) Absent this factor and the $4.7 billion in General Fund revenues resulting from it in the final three years of our forecast period, revenues in this category would basically be flat.
The other revenues in this category reflect a number of other differing trends. For example, insurance taxes and interest income will grow modestly, cigarette taxes will be fairly flat, and oil–related revenues will rise some in response to higher oil prices.
Tribal Compact Revenues. Based on the Legislature’s approval of amended casino compacts with five Southern California Indian tribes in 2007, as well as growth of revenues from existing casino compacts, General Fund payments from California’s tribes are expected to increase significantly over the forecast period. We project that net General Fund compact revenues will be about $120 million in 2007–08 and $280 million in 2008–09, expanding thereafter to $400 million in 2012–13. Referenda petitioners have submitted signatures to fund four of the recent compacts to the February 2008 statewide ballot. Our forecast assumes that voters approve these compacts and they take effect in April 2008 following approval by the federal government. If the voters reject the four compacts, net General Fund compact revenues could be around $200 million less each year than indicated in our forecast (with a partial–year effect in 2007–08).
Chapter 4
Expenditure Projections
In this chapter, we discuss our General Fund expenditure estimates for 2006–07 and 2007–08, as well as our projections for 2008–09 through 2012–13. Figure 1 (see next page) shows our forecast for major General Fund spending categories. We first discuss below our projected general budgetary trends and then discuss in more detail our expenditure projections for individual major program areas.
General Fund Budget Trends
2008–09 Outlook
We forecast that General Fund expenditures will grow from $104.2 billion in 2007–08 to $111.4 billion in 2008–09, an increase of 7 per– cent. The considerable growth rate reflects the reduced redirection of transportation funds for the General Fund’s benefit and the return of local government mandate costs (reduced on a one–time basis in the 2007–08 budget). In addition, above–average increases are projected for many health, social services, and correctional programs.
Expenditure Growth During the Forecast Period
Moderate Total Growth Projected. The right–hand column of Figure 1 shows our projected average annual growth rates for major programs from 2007–08 through 2012–13. We forecast that total spending will increase by an average annual rate of 5.4 percent—similar to statewide personal income growth over the period. Growth in 2010–11 is considerably less (2.8 percent) due to the projected payoff of the state’s deficit–financing bonds in 2009–10, reducing expenditures by more than $3 billion in 2010–11.
Figure 1
Projected General Fund Spending for Major Programs |
(Dollars in Millions) |
|
|
|
|
|
|
|
|
|
Average
Annual
Growth
From
2007‑08 |
Estimated |
|
Forecast |
2006‑07 |
2007‑08 |
|
2008‑09 |
2009‑10 |
2010‑11 |
2011‑12 |
2012‑13 |
Education |
|
|
|
|
|
|
|
|
|
K-14—Proposition 98 |
$41,137 |
$42,164 |
|
$43,299 |
$45,328 |
$46,017 |
$49,005 |
$52,146 |
4.3% |
Proposition 98 Settlement and Settle-Upa |
— |
— |
|
600 |
600 |
600 |
600 |
600 |
— |
CSU |
2,748 |
2,924 |
|
3,040 |
3,161 |
3,273 |
3,380 |
3,486 |
3.6 |
UC |
2,918 |
3,100 |
|
3,211 |
3,322 |
3,419 |
3,511 |
3,590 |
3.0 |
Student Aid Commission |
803 |
873 |
|
902 |
936 |
967 |
996 |
1,022 |
3.2 |
Health and Social Services |
|
|
|
|
|
|
|
|
|
Medi-Cal |
13,410 |
14,284 |
|
15,023 |
15,779 |
16,640 |
17,665 |
18,673 |
5.5 |
CalWORKs |
2,019 |
1,540 |
|
1,723 |
1,806 |
1,888 |
1,970 |
2,052 |
5.9 |
SSI/SSP |
3,531 |
3,648 |
|
3,969 |
4,229 |
4,456 |
4,697 |
4,955 |
6.3 |
IHSS |
1,474 |
1,587 |
|
1,714 |
1,839 |
1,970 |
2,107 |
2,252 |
7.2 |
Developmental Services |
2,539 |
2,633 |
|
2,837 |
3,092 |
3,379 |
3,693 |
4,028 |
8.9 |
Mental Health |
1,756 |
1,889 |
|
2,065 |
2,161 |
2,190 |
2,315 |
2,430 |
5.2 |
Other major programs |
4,214 |
3,734 |
|
3,941 |
4,114 |
4,235 |
4,411 |
4,647 |
4.5 |
Corrections and
Rehabilitationb |
8,718 |
9,755 |
|
10,394 |
10,887 |
11,511 |
12,219 |
13,050 |
6.0 |
Judiciary |
2,010 |
2,221 |
|
2,407 |
2,541 |
2,659 |
2,814 |
2,979 |
6.0 |
Proposition 42 transfer |
1,428 |
1,440 |
|
1,494 |
1,565 |
1,659 |
1,756 |
1,858 |
5.2 |
Debt service on
infrastructure bonds |
3,948 |
4,335 |
|
5,254 |
6,093 |
7,010 |
7,492 |
7,717 |
12.2 |
Other programs/costs |
9,246 |
8,032 |
|
9,555 |
9,616 |
8,505 |
9,090 |
10,087 |
4.7 |
Totals |
$101,899 |
$104,159 |
|
$111,428 |
$117,067 |
$120,377 |
$127,722 |
$135,572 |
5.4% |
|
a Settle-up payment of $283 million in 2006-07 and settlement payment of $300 million in 2007-08 have been reflected in the carry-in balance
to 2006-07. |
b Includes employee compensation costs. |
Highlights for Individual Program Areas. With regard to the major individual program areas in the budget, the figure shows that:
- K–14 Proposition 98 (General Fund) spending is projected to increase at an average annual rate of 4.3 percent throughout the forecast period. For the last three years of our forecast, healthy growth in General Fund revenues, coupled with virtually no growth in K–12 school enrollments, triggers the “Test 1” Proposition 98 formula that requires a fixed percentage of General Fund revenues be spent on K–14 education. This leads to average annual increases of more than 6 percent in General Fund K–14 spending levels in 2011–12 and 2012–13.
- University of California (UC) and California State University (CSU) are forecast to grow at an average annual rate of 3 percent and 3.6 percent, respectively, reflecting full funding of projected enrollment and inflation.
- Medi–Cal is projected to grow at an average annual rate of 5.5 percent. This reflects continued increases in caseload–related costs and the utilization of medical services.
- California Work Opportunity and Responsibility to Kids (CalWORKs) spending is projected to increase by an average of 5.9 percent over the forecast period. These increases are driven primarily by statutory cost–of–living adjustments (COLAs).
- Supplemental Security Income/State Supplementary Program (SSI/SSP) spending is projected to increase at an average annual rate of 6.3 percent, reflecting statutory COLAs and moderate growth in caseloads during the forecast period.
- In–Home Supportive Services (IHSS) spending is projected to increase at an average annual rate of 7.2 percent. This growth reflects increases in both caseloads and wages for IHSS workers.
- Department of Developmental Services (DDS) spending is projected to increase at an average annual rate of 8.9 percent over the period. This mainly reflects continued increases in caseloads and the cost–per–client served by the state’s 21 Regional Centers, partially offset by declining caseloads at the Developmental Centers.
- Department of Corrections and Rehabilitation spending is forecast to increase at an average annual rate of 6 percent over the forecast period. This growth takes into account increases in the prison inmate population, court–ordered increases in health care costs, salary increases, and costs to operate new facilities.
- Proposition 42 transfers of the state sales tax on gasoline from the General Fund to transportation are projected to increase at an average annual rate of 5.2 percent. In addition, one–half of what is known as “spillover” revenue (revenue from a portion of the gasoline sales tax revenue that is not deposited into the General Fund) would be used to offset General fund expenditures throughout the period. For 2008–09, the amount of General Fund expenditures offset is projected at $311 million.
- Debt–service expenses for general obligation and lease–revenue bonds that fund infrastructure projects in all program areas are projected to increase at an average annual rate of 12.2 percent. This reflects the sale of $65 billion in debt over the forecast period, including about $36 billion of the $43 billion in new bonds authorized by the voters at the November 2006 statewide election.
In the sections that follow, we provide a more detailed discussion of the expenditure outlook for these and other individual major program areas.
Proposition 98— K–14 Education
State spending for K–14 education (K–12 schools and community colleges) is governed largely by Proposition 98, passed by the voters in 1988. Proposition 98 is funded from the state General Fund and local property taxes and accounts for about three–fourths of total support for K–14 education. The remainder comes from a variety of sources including non–Proposition 98 General Fund, federal funds, lottery revenue, community college fee revenues, and other local revenues.
California’s public K–12 education system consists of more than 1,000 locally governed school districts and county offices of education. These entities operate about 9,500 schools serving about 6 million K–12 students. The California Community Colleges (CCC) consists of 72 locally governed districts operating 109 colleges that serve more than one million full–time equivalent students (FTES).
The Proposition 98 Forecast
Figure 2 shows our projections of the Proposition 98 minimum guarantee throughout the forecast period. For the initial years of the forecast period, moderate growth in General Fund tax revenues leads to moderate growth in the Proposition 98 funding requirement (about 4 percent). Beginning in 2011–12, stronger revenue growth—in both General Fund and local property taxes—results in significant funding increases for K–14 education (more than 6 percent).
Our forecast of the Proposition 98 guarantee depends on a variety of factors—including changes in K–12 average daily attendance, per capita personal income, and General Fund revenues. Figure 3 shows these factors and their projected rates over the forecast period. It also shows projected changes in CCC FTES as well as the K–14 COLA. (See box below for an update on local property tax revenues going to school districts.)
Figure 2
Proposition 98 Forecast |
(Dollars In Billions) |
|
2007-08a |
2008-09 |
2009-10 |
2010-11 |
2011-12 |
2012-13 |
General Fund |
$42.2 |
$43.3 |
$45.3 |
$46.0 |
$49.0 |
$52.1 |
Local property tax |
15.0 |
15.9 |
16.3 |
18.3 |
19.8 |
21.0 |
Totalsb |
$57.1c |
$59.2 |
$61.6 |
$64.3 |
$68.7c |
$73.1 |
Percent change |
3.9% |
3.6% |
4.1% |
4.3% |
7.0% |
6.3% |
|
a Reflects 2007-08 Budget Act spending level, with revised General Fund and local property tax contributions. |
b These totals do not include the $2.7 billion appropriated as part of Chapter 751, Statutes of 2006 (SB 1133, Torlakson). This legislation
provides annual payments of $300 million to $450 million over a seven-year period between 2007-08 and 2013-14. |
c Does not add due to rounding. |
Figure 3
Proposition 98 Underlying Forecast Factors |
|
2007-08 |
2008-09 |
2009-10 |
2010-11 |
2011-12 |
2012-13 |
Annual Percent Change |
|
|
|
|
|
|
K-12 average daily attendance |
-0.5% |
-0.4% |
-0.3% |
— |
0.2% |
0.3% |
Per capita personal income (Test 2) |
4.4 |
4.1 |
3.6 |
4.0% |
4.2 |
4.2 |
Per capita General Fund |
1.9 |
3.4 |
4.4 |
5.9 |
5.8 |
5.0 |
CCC full-time equivalent students |
1.7 |
1.7 |
1.6 |
1.2 |
0.9 |
0.7 |
K-14 COLA |
4.5 |
4.8 |
2.7 |
2.4 |
2.4 |
2.4 |
Share of General Fund Revenues |
|
|
|
|
|
|
Projected |
43.8% |
42.9% |
42.5% |
40.2% |
39.9% |
39.9% |
Test 1a |
40.9 |
40.9 |
40.9 |
40.2 |
39.9 |
39.9 |
Proposition 98 "Test" |
3 |
3 |
2 |
1 |
1 |
1 |
|
a LAO estimates for Test 1 factor, as adjusted due to transfers of local property tax revenues between schools and local governments. |
Local Property Tax Revenue Going to Schools Has Fallen From Budget Act Projections
Our forecast assumes K–14 property tax revenues in 2006–07 and 2007–08 will be about $1 billion less than the amounts assumed in the 2007–08 Budget Act (see figure below). About one–third of this shortfall is due to weakness in the real estate market (discussed in Chapter 3). The rest of the shortfall results from an overestimate of K–14 property taxes. Because school property taxes generally offset the General Fund share of Proposition 98 funding, the downward adjustment in the K–14 share of property tax revenue results in a dollar–for–dollar increase in the General Fund share. That is, based on updated estimates, the General Fund obligation for K–14 education is about $360 million higher for 2006–07 and $690 million higher for 2007–08.
Local Property Tax Revenue Going to Schools Lower Than Expected |
(In Millions) |
|
2006-07 |
2007-08 |
2007-08 Budget Act |
$14,203 |
$15,646 |
LAO Forecast |
13,847 |
14,960 |
Differencea |
-$356 |
-$686 |
|
a As a result of these reductions, the General Fund share of
Proposition 98 spending increases automatically by a like amount. |
K–14 Property Taxes Overestimated. In making its budget estimates, the administration thought property taxes received by K–14 districts for 2005–06 should have been about $300 million higher than reported. The administration suggested that a mistake might have occurred in county implementation of two complex laws affecting the allocation of property taxes: the vehicle license fee “swap” and the “triple flip” of state and local sales taxes. (Combined, these 2004 laws reallocate over $6 billion of property taxes annually from K–14 agencies to cities and counties.) The administration also indicated that mistakes might be occurring in how K–14 districts report property tax revenues, including revenues provided by redevelopment agencies.
Budget for 2006–07 and 2007–08 Assumed Funds Would Materialize. To investigate these issues, the 2007–08 Budget Act directed the State Controller’s Office (SCO) to audit county allocation of 2005–06 property taxes and K–14 revenue reports. From a budgetary perspective, the 2007–08 Budget Act acknowledged the lower–than–anticipated 2005–06 K–14 property taxes but assumed the audit would “find” the $300 million of additional K–14 property tax revenue. That is, the state built the 2006–07 and 2007–08 budgets assuming the discrepancy was a one–time glitch and the $300 million would be restored to base revenue levels.
Few Additional Funds Likely to Materialize. The SCO recently issued its audit and found no major errors in county allocation of property taxes or K–14 revenue reporting. (While the audit found errors in K–14 reporting of redevelopment revenues, these errors probably affect less than $40 million of annual revenues.) Thus, K–14 districts are not likely to receive the level of property tax revenues assumed in the budget for 2006–07 and 2007–08. Accordingly, K–14 General Fund obligations likely will increase by more than $600 million over the two years. |
|
Significant Reduction in Current–Year Funding Requirement. For 2007–08, General Fund revenues are expected to come in roughly $2 billion lower than budget act assumptions. This revenue decline shifts the Proposition 98 calculation from “Test 2” to “Test 3” and lowers the K–14 funding requirement by about $400 million. However, to capture these savings, the Legislature would have to take action to reduce Proposition 98 spending to the new minimum guarantee (see below for further discussion of this option). (Although various underlying factors have changed slightly from the budget act, the Proposition 98 guarantee for 2006–07 remains virtually unchanged. As such, no adjustment needs to be made to the Proposition 98 spending level for that year.)
Budget–Year Forecast. In 2008–09, we project the Proposition 98 minimum guarantee will be $59.2 billion, which is $2.1 billion, or 3.6 percent, greater than the current–year spending level. Under our forecast, we project a small decline in K–12 attendance and relatively modest growth in General Fund revenues (resulting in another Test 3 year). As we discuss in the subsequent section, we project growth in the minimum guarantee will not be sufficient to fund cost–of–living adjustments (COLAs) for K–14 education.
Out–Year Forecast. We project somewhat stronger growth throughout the remainder of the forecast period. Specifically, in 2009–10 and 2010–11, we project the Proposition 98 minimum guarantee will grow by about 4 percent. Over these two years, K–12 attendance is not expected to increase while the General Fund is expected to grow at a moderate pace. In the last two years of the forecast period, we project especially strong growth (more than 6 percent). Over these two years, K–12 attendance is expected to experience slight growth. The large funding increases in the latter years of the forecast period, however, are mostly attributable to healthy per capita General Fund increases (more than 5 percent) and the triggering of Test 1. (See the box below for further discussion of the timing of Test 1 and its implications for K–14 funding.) Under Test 1, property tax revenues received by schools no longer offset General Fund contributions to Proposition 98 funding. As a result, large increases in property tax revenues in Test 1 years can result in healthy growth in K–14 funding.
“Test 1” to Be Operative Toward End of Forecast Period
The Proposition 98 minimum guarantee is usually set at the higher of two tests. Under Test 1, the guarantee is set at about 40 percent of General Fund revenues. To date, Test 1 has been operative only in 1988–89—the year after Proposition 98 was passed. In subsequent years, “Test 2,” which grows the prior–year K–14 funding level by the percent change in per capita personal income and K–12 attendance, has moved the guarantee above the Test 1 level. For many years, this was the result of fast growth in K–12 attendance.
Forecast Suggests Test 1 Will Become Operative in 2010–11. Underlying dynamics are changing such that Test 1 could become operative within a few years. Specifically, K–12 attendance has been declining, reducing the Test 2 Proposition 98 requirement. In addition, over the last half of the period, we project growth in General Fund revenues will outpace growth in per capita personal income—raising the Test 1 funding level above the Test 2 funding level. As a result of the combined effect of these factors, we project Test 1 will become operative in 2010–11.
Local Property Tax Revenues Affect Timing and Magnitude of Test 1 Year. Changes in local property tax revenues could affect both when Test 1 becomes operative and how much K–14 education benefits once it is in effect. Because a drop in property tax revenue results in a higher General Fund contribution for K–14 education under Test 2, a more dramatic slowdown in the housing sector than we project could delay the onset of Test 1. Once Test 1 does apply, the K–14 share of General Fund spending is fixed. As a result, increases in local property tax revenues begin to supplement rather than supplant General Fund spending. This means K–14 funding levels can benefit substantially from healthy increases in local property tax revenues. More modest growth in property tax revenue, however, would mean less “supplementary” Test 1 funding for K–14 education. |
|
Difficult but Critical Decisions In Year Ahead
The upcoming budget cycle looks to be particularly challenging. This is because the Legislature faces large shortfalls in both the state budget and Proposition 98 budget. Regarding the overall General Fund budget, we project the state will have an $8 billion operating shortfall in 2008–09 (see Chapter 1). Given K–14 education comprises more than 40 percent of the state’s General Fund budget, the Legislature might want to consider K–14 options to help balance the General Fund. However, in addition to the overall state budget challenge, we also project year–to–year growth in Proposition 98 funding will be insufficient to cover baseline K–14 costs (see Figure 4). Thus, reducing General Fund expenditures to solve the overall state budget problem could make funding a K–14 baseline budget even more difficult. To make matters even more challenging, these near–term issues are accompanied by the significant issue of planning for future education reform. As shown in Figure 4, large increases in K–14 funding are projected in subsequent years. We discuss further below how the Legislature might address these challenges.
Figure 4
Difficult Year Ahead, Major New Discretionary Funds
Still Expected in Out-Years |
|
(In Millions) |
|
|
2008-09 |
2009-10 |
2010-11 |
2011-12 |
2012-13 |
Growth in Proposition 98 |
$2,076 |
$2,412 |
$2,683 |
$4,489 |
$4,336 |
Baseline Expenditures |
|
|
|
|
|
K-12 Enrollment Changes |
-$11 |
$7 |
$47 |
$134 |
$192 |
CCC Enrollment Growth |
104 |
105 |
82 |
64 |
52 |
K-14 COLA |
2,690 |
1,557 |
1,437 |
1,516 |
1,611 |
Restore prior year shortfalla |
782 |
— |
— |
— |
— |
Totals |
$3,565 |
$1,669 |
$1,566 |
$1,714 |
$1,855 |
Available Funds |
-$1,489b |
$743 |
$1,117 |
$2,774 |
$2,480 |
|
|
a Includes $567 million shortfall for transportation, deferred maintenance, and school intervention as well as $215 million shortfall for mandates. |
|
b Assumes state finds ongoing solution of this amount. If a part of the solution is one-time, funds available in future years likely would go first to backfill the ongoing shortfall. |
|
K–14 Options to Help Address Large State Budget Shortfall. The Legislature has various K–14 options to help address the overall state budget shortfall. One K–14 option that would yield substantial General Fund savings is to reduce 2007–08 Proposition 98 spending to the minimum guarantee. This would provide more than $400 million in General Fund savings in 2007–08. The savings would grow slightly in 2008–09 and 2009–10—for cumulative General Fund savings of $1.3 billion (with no additional ongoing effect thereafter). This option would give the Legislature more flexibility in reshaping the state’s overall budget plan, but it also would make balancing the 2008–09 Proposition 98 budget more difficult, as discussed further below. Another K–14 option that would provide substantial General Fund relief is to postpone implementation of the Quality Education Investment Act or modify its terms. This option would yield up to $450 million in annual savings.
Options to Address the Proposition 98 Shortfall. As Figure 4 shows, anticipated year–to–year growth in Proposition 98 funding falls almost $1.5 billion short of covering baseline costs in 2008–09. Baseline costs include costs for enrollment growth, COLA (projected at 4.81 percent), and mandates. They also include costs for existing ongoing programs that were funded from one–time sources in 2007–08. To address such a large shortfall, the Legislature likely will need to consider an array of options. For example, the Legislature could (1) suspend or reduce growth and COLA for 2008–09, (2) make reductions to base programs, (3) identify non–Proposition 98 funding sources, or (4) raise additional resources.
Special Opportunity to Plan for Major Education Reform Still Exists. Although the Legislature faces a considerable challenge in balancing the 2008–09 budget, it still has a special opportunity in 2008–09 to plan for major education reform. As shown in Figure 4, beginning in 2009–10, Proposition 98 funding is projected to grow by substantially more than needed to cover baseline costs. Moreover, the amount of funding in excess of baseline costs steps up over the four–year period—creating an ideal climate for a major reform endeavor. By the end of the period, K–14 would benefit from about $7 billion in ongoing funding above baseline expenses that could go toward reform. Rather than using a piecemeal approach to allocate the excess funding available each year, we recommend the state develop a coherent, multiyear plan that would dedicate the new funds for major underlying reform.
Higher Education
In addition to community colleges (which are discussed above as part of the Proposition 98 forecast), the state’s public higher education segments include UC and CSU. The UC consists of nine general campuses, one health sciences campus, and numerous special research facilities. The UC awards bachelors, masters, and doctoral degrees, as well as various professional degrees. Of the segments, UC has almost exclusive jurisdiction over public university research. The CSU consists of 23 campuses and several off–campus centers. The CSU grants bachelors and masters degrees and a doctorate in education, and may award joint doctoral degrees with UC under specified circumstances. Other higher education agencies include the California Student Aid Commission (CSAC), the California Postsecondary Education Commission, and Hastings College of the Law. Overall, state policy for higher education is laid out in the Master Plan for Higher Education, which was originally adopted in 1960.
UC and CSU Expenditures
Our forecast assumes cost increases due to the projected impacts of inflation and enrollment growth. (As described in more detail below, growth in the college–age population is expected to slow to almost zero by the end of the forecast period.) These costs are expected to increase at an average annual rate of about 3.3 percent during the forecast period. As a result, we project that total General Fund spending on the two university systems will increase from $6 billion in 2007–08 to $7.1 billion in 2012–13.
Key Forecast Factors. Our forecast is largely based on three key factors.
- Fees. The state has no expressed policy for annual fee adjustments at UC and CSU. In the absence of such a policy, we assume that enrollment fees will increase annually at the rate of inflation, thus maintaining their current purchasing power.
- Inflation. We assume that base funding will increase annually to compensate for inflation. Neither the Master Plan nor statute provides any explicit guidance about inflationary adjustments. Over the forecast period, we project inflation to average slightly less than 2.5 percent annually.
- Enrollment. Forecasting enrollment growth is more difficult. Enrollment growth depends primarily on college–going population growth and participation rates. Participation rates respond to a range of factors, including state policies in areas such as outreach and financial aid, and actions by the segments in areas such as admissions policies and class scheduling. California’s college participation rates, currently among the highest in the nation, have been relatively flat over recent years. Given this, and lacking any evidence to assume otherwise, we have assumed participation rates at UC and CSU will remain constant throughout the forecast period. Because we do not adjust current college participation rates, our enrollment projections are driven entirely by projected population growth. As shown in Figure 5, annual growth in the traditional college–age population is expected to slow to about 0.5 percent by the end of the forecast period. (We expect this growth rate will become negative in subsequent years. This mirrors the demographic changes that the K–12 population is currently experiencing.) In order to account for the diverse populations in California’s higher education systems, we separately projected growth rates for various racial, gender, and age subgroups. For example, we project that the population of Latinas ages 17 through 19 will grow by about 14 percent statewide over the forecast period, and therefore the number of students in that category will grow by the same percentage. When all student groups’ projected growth is aggregated together, we project that demographic–driven enrollment at UC and CSU will grow at an average annual rate of about 1.25 percent during the forecast period. While growth near the beginning of the forecast period is expected to approach 2 percent, enrollment growth at the end of the forecast period is expected to be substantially less than 1 percent.
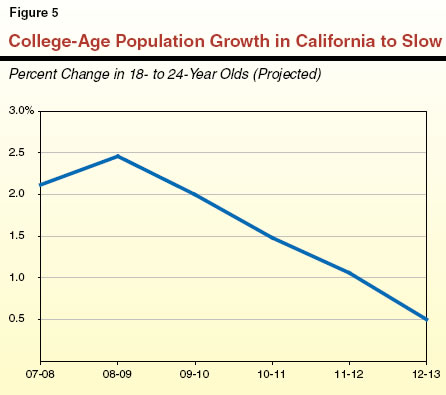
Governor’s Compacts. In spring 2004, the Governor developed “compacts” with UC and CSU in which he committed to seek specified funding increases for the segments in his future budget proposals through 2010–11. Because these compacts are neither in statute nor formally endorsed by the Legislature, they are not incorporated in our forecast. We estimate the General Fund cost of implementing the compact would be about $190 million above our projection for 2007–08, rising to about $725 million above our projection for 2012–13.
California Student Aid Commission
Cal Grant Programs. Most of the state’s General Fund support for student financial aid is directed through the Cal Grant programs, which provide fee coverage and subsistence grants to eligible students. The CSAC administers both the Cal Grant Entitlement Programs (in which all students who meet certain income, grade point, and age criteria are entitled to receive grants) and the Cal Grant Competitive Programs (in which eligible students must compete for a fixed number of grants). Our expenditure forecast assumes that the number of Cal Grant entitlement awards will grow in proportion to enrollment growth, and that the fee coverage component of the grants will increase to match projected fee increases. We project that Cal Grant costs will increase from almost $800 million in 2007–08 to about $925 million at the end of the forecast period.
Sale of EdFund. The 2007–08 Budget Act assumed that the state would sell EdFund, the state’s nonprofit agency that administers federal student loan guarantee programs, for a one–time revenue gain of $1 billion. While there was not a lot of information available on the expected proceeds from such a sale, the $1 billion estimate—while optimistic—appeared attainable. Since the passage of the budget package, there have been two developments affecting our fiscal forecast. First, it now appears unlikely that the sale could be finalized until 2008–09. As a result, we have shifted the revenue gain forward by one fiscal year. More importantly, the federal government has made changes to its loan programs affecting the revenue streams to guaranty agencies. While the amount that the state can receive from the sale of EdFund is still subject to great uncertainty, we reduced the expected revenue gain by one–half—to $500 million—in view of this development.
Health
Medi–Cal
The Medi–Cal Program (the federal Medicaid Program in California) provides health care services to recipients of CalWORKs or SSI/SSP grants, and other low–income persons who meet the program’s eligibility criteria (primarily families with children and the elderly, blind, or disabled). The state and federal governments share most of the program costs on a roughly equal basis.
The Spending Forecast. We estimate that General Fund spending for Medi–Cal local assistance (including benefits, county administration of eligibility, and other costs) will reach nearly $14.3 billion in the current year, about the same amount appropriated in the 2007–08 Budget Act.
We project that General Fund support would grow to about $15 billion in 2008–09, a 5.2 percent increase from current–year expenditures. This is largely due to costs the Medi–Cal Program will incur as a result of increases in costs and utilization of medical services as well as the implementation of a new managed care rate–setting methodology. By the end of the forecast period in 2012–13, we estimate that General Fund spending for Medi–Cal will reach $18.7 billion, an average annual increase of 5.5 percent over the projection period.
Key Forecast Factors. Several factors play a key role in our forecast:
- Health Care Costs. A significant factor in our forecast is the assumption that the cost per person of Medi–Cal health–care services will grow at an average rate of 5.1 percent annually. As shown in Figure 6, the average annual benefit cost per person enrolled in Medi–Cal is projected to grow from about $3,900 to $5,000 during the forecast period. Our health care cost assumptions are subject to considerable uncertainty and small changes in the actual rate of growth in medical costs could have significant fiscal effects.
- Medi–Cal Caseload Trends. As shown in Figure 6, the overall Medi–Cal caseload appears to be relatively flat. However, within our overall caseload forecast, we assume some continued caseload growth commensurate with increases in the state population and other underlying trends. Notably, our analysis indicates that as the “baby boom” generation ages, the aged and disabled components of the caseload will grow faster than that for families and children during the projection period.
- Revised Medicare Part D “Clawback” Payments. With the implementation of the federal Medicare “Part D” drug benefit in 2006, the federal government began to charge states an annual clawback payment to recover some of the costs that shifted from state Medicaid programs to Medicare. In previous fiscal forecasts, we had projected that this payment would result in significant state costs by the end of the forecast period. Since the November 2006 projection, however, the federal government has significantly revised the clawback payment downward to account for slower than expected growth in the cost of pharmaceuticals. We now project the clawback payment to remain near current year levels in 2008–09 ($1.2 billion), growing steadily thereafter to $1.6 billion at the end of the forecast period, primarily as a result of an increase in the number of beneficiaries eligible for both Medicare and Medi–Cal and increased pharmaceutical costs.
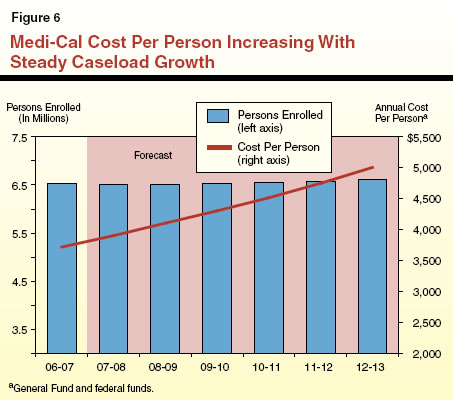
Healthy Families Program
In 1997, the federal government enacted the State Children’s Health Insurance Program (SCHIP). In California, SCHIP funding supports a variety of health programs, the largest being the Healthy Families Program (HFP). Funding for these programs is generally provided on a two–to–one federal/state matching basis. As regards HFP, the program generally offers health insurance to eligible children in families with incomes below 250 percent of the federal poverty level (FPL). The federal government has also authorized the use of federal funds to cover children up to age two in families with incomes below 300 percent of FPL who have transferred to HFP from the state’s Access for Infants and Mothers program. To participate in HFP, all participating families pay a relatively low monthly premium and are offered health coverage similar to that available to state employees.
The Spending Forecast. We estimate that overall General Fund spending for HFP local assistance will be about $390 million in 2007–08, about $10 million less than what was provided in the 2007–08 Budget Act. This estimated decrease is due to slower caseload growth than previously projected. We further estimate that overall General Fund spending for the program will increase to almost $445 million by 2008–09 and that by 2012–13 the program will have an annual General Fund cost of almost $570 million. The average annual growth in expenditures over the forecast period is projected to be about 7.8 percent.
Key Forecast Factors. Several factors play a role in our forecast:
- Exhaustion of SCHIP Fund Balance. States must spend their federal SCHIP allocations within a set period of time (generally three years) or risk the reversion of these funds to the federal government. The state expanded its use of SCHIP funds for health coverage programs beginning in 2003–04 to prevent SCHIP funds from being reverted and lost to the state. As a result, the current level of SCHIP funds being spent each year now exceeds the annual SCHIP allocation to California, and the balance of unspent SCHIP funds has been gradually declining. We project that the state will exhaust its balance of unspent SCHIP funds in 2008–09.
- SCHIP Reauthorization. Funding for SCHIP has been authorized by Congress only through November 16, 2007. Our forecast assumes that Congress will reauthorize SCHIP funding (1) on a roughly two–to–one federal/state matching basis and (2) at a level necessary to support existing caseloads as well as projected growth for all programs that use SCHIP funds. However, if Congress does not reauthorize funding for SCHIP at a level necessary to support the growing caseloads, we project about a $3 billion shortfall in federal funds over the next five years for California. Consequently, without increased federal funds or cost cutting measures, state costs for these programs would be significantly greater than we have projected during the forecast period.
- Senate Bill 437 Implementation. Chapter 328, Statutes of 2006 (SB 437, Escutia), establishes presumptive eligibility for HFP and an accelerated enrollment program. It also establishes a process by which HFP applicants can self–certify income at the time of their annual eligibility review. The Governor vetoed funds appropriated by the Legislature to implement SB 437 in 2007–08 and indicated in his veto message his intent to delay implementation by one year. Our projection assumes that implementation will begin in 2008–09 with full implementation of these changes occurring in 2009–10, which accounts for the gradual increase in caseload resulting from this legislation.
Developmental Services
The state provides a variety of services and supports to individuals with developmental disabilities, including mental retardation, cerebral palsy, epilepsy, autism, or other similar disabling conditions. The DDS, which oversees the programs, operates five Developmental Centers (DCs) and two smaller facilities which provide 24–hour institutional care, and contracts with 21 nonprofit regional centers (RCs) to coordinate and deliver community–based services.
The Spending Forecast. We estimate that General Fund spending for developmental services in 2007–08 will total $2.6 billion, about the same amount of funding appropriated in the 2007–08 Budget Act. Of that total, about $2.2 billion will be spent by RCs for community–based services and about $383 million will be spent for operating the DCs. We further estimate that General Fund spending for developmental services will grow by about 7.7 percent in 2008–09 to more than $2.8 billion.
Between 2007–08 and 2012–13, we estimate that General Fund spending for the developmental services program will grow by $1.4 billion and reach a total of $4 billion annually. This expenditure growth is due mainly to increased spending by RCs on community–based services. Our forecast assumes that Public Transportation Account funds will continue to be used to pay for RC transportation services.
We estimate that there will be various one–time administrative and programmatic costs in 2007–08 and 2008–09 as a result of the closure of Agnews DC, followed by an ongoing reduction in DC operating costs. Spending for DCs is projected to remain relatively flat over the rest of the forecast period.
Key Forecast Factors. Our forecast of significant growth in RC spending reflects historical increases both in caseload and in the average cost of serving each RC client. Specifically, our forecast assumes that RC caseloads will grow at an average annual rate of 3.8 percent, and that costs will grow at an annual average rate of 7 percent. This growth is partially offset by declining caseloads in DCs.
CalWORKs
The CalWORKs program provides cash grants and welfare–to–work services to families with children whose incomes are not adequate to meet their basic needs. The CalWORKs program is primarily funded by state General Fund and federal funds that the state receives as part of its Temporary Assistance for Needy Families (TANF) block grant. In order to receive these federal funds, the state must meet a maintenance–of–effort requirement, which is largely satisfied through state and county spending on CalWORKs. Federal TANF funds are used both to support the CalWORKs program and for transfers to offset General Fund costs in other related programs.
The Spending Forecast. General Fund spending for the CalWORKs program is estimated to be $1.5 billion in 2007–08, a $480 million decrease from the prior year. We project spending to increase by about $180 million in 2008–09. For the remainder of the forecast period, we project that spending will increase by just over $80 million each year.
Key Forecast Factors. Most of the decrease in 2007–08 is due to (1) using $85 million in one–time TANF reserve funds to offset General Fund costs and (2) the decision to use Proposition 98 funds to support CalWORKs Stage 2 child care which saved approximately $270 million. The Proposition 98 fund shift continues throughout the forecast period. For 2008–09, program costs increase primarily due to replacing the $85 million in one–time TANF funds with General Fund and providing the statutory COLA ($98 million). For the out–years of the forecast, the primary cost driver is the statutory COLA.
California faces the prospect of a federal penalty, which could begin in 2009–10, for failing to meet work participation requirements in federal fiscal year 2007. Our projections do not include penalty costs because California has the potential of avoiding payment of the penalty though a corrective action plan. Nevertheless, the risk of annual penalties exceeding $100 million is a significant threat within the forecast period.
Caseload Trends and Projections. From its peak in March 1995 to its low point in July 2003, the CalWORKs caseload declined by 49 percent to about 475,000 cases. This decline in caseload is attributable to a number of factors including the strong economy of the late 1990s, annual reductions in the teen birth rate, and CalWORKs program changes which emphasized welfare–to–work services. For the next 18 months, the caseload grew very slowly to a total 493,000 cases in December 2004. Since then, the caseload has once again been in a slow decline, falling to 455,000 as of July 2007. Because the rate of decline has slowed significantly during the past year, we are projecting the caseload will remain relatively flat during the forecast period.
Supplemental Security Income/State Supplementary Program (SSI/SSP)
The SSI/SSP provides cash assistance to eligible aged, blind, and disabled persons. The SSI component is federally funded and the SSP component is state funded.
The Spending Forecast. General Fund spending for SSI/SSP is estimated to be over $3.6 billion in 2007–08, an increase of 3.4 percent compared to the prior year. For 2008–09, we project an 8.8 percent increase, raising total expenditures to over $3.9 billion. From 2007–08 through 2012–13, spending for SSI/SSP will increase at an average annual rate of 6.3 percent, eventually reaching a total of nearly $5 billion.
Key Forecast Factors. The two primary cost drivers for SSI/SSP are caseload growth and the cost of providing the statutory COLA. The state COLA was suspended in 2005–06 and 2006–07. Trailer bill legislation in 2007 permanently reschedules from January to June the annual state COLA. Providing the June 2008 COLA results in a one–month cost of $22.4 million in 2007–08, increasing to about $250 million in 2008–09. For the remainder of the forecast, the annual COLA will add costs of about $150 million each fiscal year.
Caseload Trends and Projections. From 1997–98 through 2005–06 the caseload grew at a steady rate of just over 2 percent per year. In 2006–07, caseload growth dropped to 1.4 percent and is projected to increase to 1.8 percent in 2007–08. Given future anticipated growth in the aged population, we project caseload growth to rise over 2 percent during the forecast period.
IHSS
The IHSS program provides various services to eligible aged, blind, and disabled persons who are unable to remain safely in their homes without such assistance. Program costs are shared 50 percent federal, 32 percent state, and 18 percent county.
The Spending Forecast. General Fund spending for IHSS is expected to be $1.6 billion in 2007–08, an increase of over 6 percent compared to the prior year. This increase is primarily due to caseload growth and provider wage increases. For 2008–09, we project that costs will increase by 8 percent to a total of over $1.7 billion. For the forecast period, we expect costs to increase an average of 7.2 percent each year, resulting in General Fund expenditures of almost $2.3 billion in 2012–13.
Key Forecast Factors. The primary cost drivers for IHSS are caseload growth of about 5.2 percent per year and increases in provider wages. Currently, if all counties were to increase wages to the maximum amount eligible for full state participation ($12.10 per hour), we estimate the General Fund exposure to be about $300 million annually. For this forecast, we have assumed annual increases in state costs of $35 million per year as counties gradually increase wages paid to IHSS providers. This accounts for about 60 percent of the exposure. For 2008–09 there are additional costs for automation and the annualization of the January 2008 increase in the state minimum wage to $8 per hour.
Figure 7 presents recent trends and our projections of IHSS General Fund costs per person. From 1999–00 through 2002–03, the cost per case increased rapidly, primarily due to increases in provider wages and the hours of services provided to recipients. These trends moderated somewhat from 2003–04 through 2006–07 due to the approval of a waiver authorizing federal financial participation in the formerly state–only “residual” program, and limited increases in provider wages. We anticipate the cost per case to begin rising again during the projection period, mostly due to increases in provider wages.
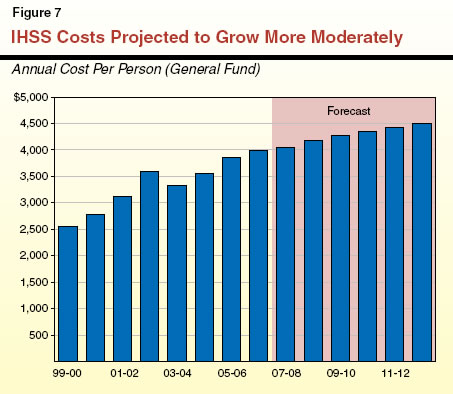
Judiciary and Criminal Justice
The major state judiciary and criminal justice programs include support for two departments in the executive branch—the California Department of Corrections and Rehabilitation (CDCR) and the Department of Justice—as well as expenditures for the state court system. The single largest criminal justice program in terms of state operational costs—CDCR—is discussed in more detail below, along with major capital outlay expenditures anticipated for that department.
CDCR
The CDCR is responsible for the incarceration and care of adult felons and nonfelon narcotics addicts at 33 state prisons, as well as the rehabilitation of youthful offenders at eight youth correctional facilities. The CDCR also supervises and provides services to parolees and wards released to the community.
The Spending Forecast. General Fund expenditures for the support of CDCR operations for 2007–08 are estimated to be about $9.8 billion (excluding lease–revenue bond payments, capital outlay, and certain other expenditures). This would be about $370 million higher than the amount of funding provided in various budget items in the 2007–08 Budget Act, primarily due to salary increases anticipated to be provided for correctional staff.
Spending is projected to increase by 6.5 percent above the revised 2007–08 level to approximately $10.4 billion in 2008–09. During the entire forecast period, General Fund spending is projected to increase at an average annual rate of 6 percent, reaching $13 billion in 2012–13. Our estimates for the forecast period include adjustments for employee compensation increases, but do not include General Fund support for capital outlay and debt service, which are accounted for elsewhere in our projections.
During the forecast period, the state’s General Fund operational costs are assumed to be partially offset by about $100 million in annual reimbursements from the federal government for a portion of the state’s costs of housing undocumented immigrants convicted of felonies in California.
Key Forecast Factors. The projected increases in General Fund support for CDCR operations are driven by a combination of factors, including (1) growth in the prison and parole populations, (2) salary increases, (3) inflation on operating expenses and equipment, (4) compliance with federal court orders to improve health care for inmates, and (5) support costs to operate new prison facilities authorized by Chapter 7, Statutes of 2007 (AB 900, Solorio). These costs are partially offset by savings resulting from recent policy changes designed to shift some juvenile offenders from state to local jurisdictions.
- Growth in Inmate and Parole Populations. As Figure 8 shows, the adult prison population is projected to increase by approximately 18,000 inmates during the forecast period, reaching 192,000 by the end of fiscal year 2012–13. This assumes a continuation of modest growth in the inmate population, averaging 1.7 percent annually. The adult parole population is projected to increase by about 17,000 offenders, reaching 144,000 by the end of the projection period. We estimate that these caseload changes in inmates and parolees will result in a net increase in CDCR expenditures of about $400 million by the end of the forecast period. However, should the federal courts intervene and set a limit on the prison population—as is currently being considered—state expenditures and prison caseload would be lower than we have projected.
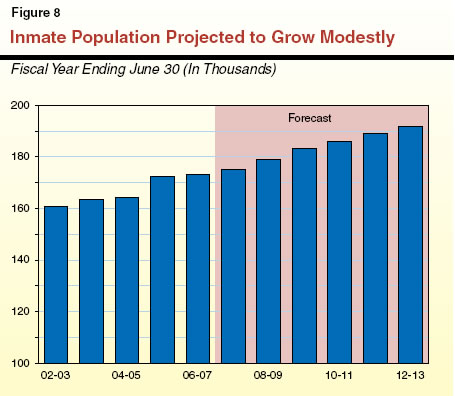
- Salary Increases and Inflation. General salary increases for CDCR staff are projected to increase expenditures by about $1.9 billion during the projection period. The CDCR salary growth accounts for about 58 percent of the total statewide growth in General Fund spending for salary increases estimated to occur through 2012–13. In addition, price adjustments for CDCR operating expenses are projected to account for about $370 million in increased costs.
- Inmate Health Care Improvements. Our projections include estimates of the increased prison operating costs associated with the three major federal court cases relating to inmate medical, mental health, and dental care, including the decisions of a court–appointed Receiver for medical issues. While the exact magnitude of these costs is not certain, due primarily to pending decisions to be made by the Receiver and the courts, we project that altogether they will increase by about $600 million over this period. More than four–fifths of this estimated increase, totaling more than $500 million, is due to the hiring of staff for new positions, such as additional medical staff at both existing and planned health facilities, additional correctional officers to provide transportation and escort to medical services, and new management positions. In addition, we estimate that approximately $1.8 billion will be spent from lease–revenue bonds by the end of 2012–13 for the construction of 4,000 medical and mental health beds and dental facilities. (The overall capital outlay program for CDCR is discussed in further detail below.)
- Juvenile Justice Reforms and Population. Our forecast assumes a significant drop in the caseload supervised by the Division of Juvenile Facilities. The number of wards in state youth correctional facilities is expected to drop by more than 900 during the forecast period, while the number of juvenile parolees is anticipated to decrease by more than 1,000. These projected decreases in the juvenile population partly reflect a continued trend of declining juvenile court commitments, but are mainly due to recent changes in state law that halt the admission of certain groups of lower–level offenders to state youth correctional facilities. These offenders will now be held at the county level in juvenile halls or camps or participate in community programs. Our estimates take into account the costs of a new block grant program, administered by the state, to support county supervision and services for youthful offenders, as well as a new $100 million capital outlay grant program to build and renovate local juvenile facilities.
- Operating Costs for New Prison Facilities. Chapter 7, approved by the Legislature and signed into law in May 2007, authorizes the construction of tens of thousands of additional prison beds to address inmate overcrowding, as well as makes other changes. Our projections assume that about 19,000 additional prison beds will be constructed during the forecast period, resulting in additional General Fund support expenditures to staff and operate the new facilities. We estimate the increased costs to implement Chapter 7 will reach about $400 million by the end of the forecast period.
Capital Outlay Expenditures for CDCR. We estimate that capital outlay expenditures for CDCR during the five–year forecast period will be about $7.2 billion. About $350 million of the costs incurred from 2008–09 through 2012–13 are assumed to be paid directly from the state General Fund, with the balance of almost $6.9 billion paid for using lease revenue bonds. The General Fund debt service to repay these bonds is estimated to amount to approximately $370 million annually in 2012–13 (leveling off at about $500 million the following year). Most of these capital outlay costs result from the implementation of Chapter 7.
We estimate that 13,000 prison beds on the grounds of existing state prisons and 6,000 beds in secure reentry facilities would be built during the forecast period, and that grants would be issued to counties to support the construction of more than 6,000 county jail beds during this time. In addition, Chapter 7 separately appropriated $300 million from the General Fund for infrastructure, such as water, sewer, and electrical improvements, to help the existing prison system accommodate expansion. Our estimates also assume the construction of medical, mental health, and dental care facilities to comply with orders from the federal courts and a court–appointed Receiver, as well as the issuance of grants to counties for construction and renovation of juvenile facilities.
Other
Non–Education Mandates
The forecast for 2008–09 includes about $470 million to reimburse local governments for their costs to implement state mandates. About one–half of this amount is to pay local governments for their costs to carry out mandates during 2007–08. The remainder reflects costs to (1) make a payment towards retiring the state’s backlog of pre–2004 mandate claims and (2) reimburse local governments for certain 2005–06 and 2006–07 claims that were submitted during the current fiscal year, primarily the “AB 3632” mental health mandate. (County claims under the AB 3632 mandate have been delayed for procedural reasons.) We assume that the state’s ongoing mandate costs will fall to about $320 million in 2009–10, and then grow moderately annually thereafter.
Employee Compensation
Departments’ budgets include the current costs of compensating state employees. In 2006–07, the General Fund paid about $10 billion (excluding higher education) in salary and benefit costs. Each year, the budget includes funds for additional compensation and benefit provisions that will take effect in the budget year. The 2007–08 Budget Act and later legislation appropriate $475 million from the General Fund for this purpose. In addition to these funds, our forecast assumes the implementation of the administration’s final offer to the correctional officers union in September 2007. Costs for this correctional officer compensation package are forecast to be about $260 million in 2007–08. The Legislature has not yet acted on this proposal.
The Spending Forecast. After the current year, we forecast that employee compensation budgets will be augmented annually in amounts ranging from about $490 million in 2008–09 to $560 million in 2012–13. After the cumulative effect of these increases, annual General Fund employee compensation costs would be $3.3 billion higher in 2012–13 than they were in 2006–07. Because most of the state’s union agreements expire at the end of 2007–08, the forecast makes assumptions about the pay raises that state employees will receive in future years, with an average annual pay increase of about 4 percent. Between 15 percent and 20 percent of the annual increases result from increasing health care premiums.
Key Forecast Factors. We assume that the bulk of state employees receive 3 percent annual salary increases once their current agreements expire. Based on recent salary trends and, in some cases, persistent difficulties with recruiting and retaining state–employed doctors, nurses, teachers, and engineers, we assume that these employees’ salaries increase at a somewhat higher rate each year. Consistent with the administration’s final offer to correctional officers in September 2007, we assume 5 percent annual increases in pay for correctional officers, who account for about 40 percent of all employee compensation costs paid from the General Fund. The administration’s ability to implement this offer, however, is dependent upon the Legislature’s approval. Accordingly, given the large share of employee costs related to correctional officers, the size of this part of the state budget will vary greatly depending on whether the Legislature approves pay increases less than, equal to, or greater than those proposed by the administration. Regarding health care costs for state employees, we assume that annual premium increases set by the California Public Employees’ Retirement System average 8.5 percent per year—somewhat less than the double–digit increases experienced during several recent years.
As of July 2007, about 13 percent of all state employee positions authorized by the Legislature were vacant. Under our forecast, this vacancy rate is likely to remain about the same or decline slightly, particularly for employee groups where efforts to address vacancy problems are underway (including correctional officers and medical personnel in various departments). The retirement of large numbers of Baby Boom state employees during the next several years will negatively affect the ability of departments to reduce vacancy rates. For this reason, among others, reducing the statewide vacancy rate substantially may require the expenditure of additional funds above those assumed in our forecast or the shifting of departmental funds from existing programs to personnel costs.
Retirement
The 2007–08 Budget Act includes $4.2 billion of General Fund expenditures for employee retirement programs. (This amount excludes Social Security and Medicare employer taxes.) The state’s payments to the CalPERS pension program equal 38 percent of this total. Payments to (1) CalPERS for health benefits of retired state and CSU employees and (2) the California State Teachers’ Retirement System (CalSTRS) for pension benefits each make up between 25 percent and 30 percent of the total. In addition to the $4.2 billion included in the budget, our forecast includes 2007–08 costs from a court order concerning the state’s 2003–04 payments to CalSTRS. The state paid $500 million for the principal cost related to this court order in September 2007. We assume that the state makes about $200 million of additional interest payments to CalSTRS in 2008–09. The exact amount of interest owed is currently on appeal by the administration.
The Spending Forecast. Overall, we estimate that General Fund retirement costs increase from $4.7 billion in 2007–08 to $5.9 billion in 2012–13. Over 70 percent of this growth results from retiree health expenses, even given our assumption that annual premium increases will be in the single digits throughout the forecast period. After adjusting for the one–time payment to CalSTRS under the court order, General Fund contributions to pension benefit programs, by contrast, are forecast to grow slowly each year in line with state employee and teacher payrolls. By 2011–12, under our forecast, the state’s pay–as–you–go appropriations to CalPERS for state and CSU retiree health benefits will exceed the General Fund’s contributions to CalPERS for state employee pension benefits.
Key Forecast Factors. The forecast assumes stable pension contribution rates and (compared with recent experience) moderate annual increases in CalPERS health premiums throughout the forecast period. (Our assumptions for annual premium increases are consistent with those used in CalPERS’ model for evaluating retiree health liabilities.) Various factors—almost all outside of the Legislature’s control under current law—could increase or decrease state retirement costs by hundreds of millions of dollars in any given year. For example, strength or weakness in the worldwide equity markets or changes by CalPERS in its actuarial practices would affect pension costs. Similarly, changes in health programs by CalPERS could cause General Fund retiree health costs to be hundreds of millions of dollars higher or lower.
Reflecting current policy, the forecast assumes no expenditures during the forecast period to amortize existing or potential unfunded liabilities for (1) state and CSU retiree health benefits administered by CalPERS, (2) CalSTRS’ pension programs, (3) UC’s pension program, or (4) UC’s retiree health program. On a combined basis, these four retirement programs, as well as CalPERS’ main pension fund (for which the state and local governments already make annual payments to amortize unfunded liabilities), have unfunded liabilities exceeding $100 billion. The additional annual costs necessary to amortize existing unfunded liabilities over 30 years are estimated to total around $3 billion (in today’s dollars), assuming continuation of current benefit levels. In addition, local school districts have unfunded retiree health liabilities totaling in the tens of billions of dollars.
Debt Service on Bonds
The General Fund incurs debt–service costs for both principal payments and interest owed on two basic types of bonds used to fund infrastructure—voter–approved general obligation bonds and statutorily authorized lease–revenue bonds. (The latter have commonly been used to finance correctional and higher education facilities, among other purposes. Their debt service is paid out of appropriations made by the General Fund to the entities that occupy and lease the facilities that the bonds have funded.) In recent years, the General Fund has also incurred costs for the deficit–financing bonds that the state has issued to help deal with its budgetary problems (see discussion in Chapter 1).
The Spending Forecast. General Fund spending for debt service on bonds used to fund infrastructure is estimated to be $4 billion in 2006–07, $4.8 billion in 2007–08, and $5.3 billion in 2008–09. In total, debt service is projected to grow at an annual pace of 12.2 percent annually over the forecast period.
Key Forecast Factors. Projections of debt–service costs depend primarily on the volume of past and future bond sales, their interest rates, and their maturity structures. Regarding bond sales, our projections are based on a combination of existing bond authorizations and estimates about when various bond–related programs will be in need of funds. Over the entire forecast period, we are assuming that a total of about $65 billion of general obligation and lease–revenue bonds will be sold, including about $36 billion of the nearly $43 billion in new bonds authorized by the voters in the November 2006 statewide general election. We assume that interest rates track our economic forecast, while maturity structures reflect recent bond sales.
Debt–Service Ratio (DSR). The DSR for bonds—that is, the ratio of annual General Fund debt–service costs to annual General Fund revenues and transfers—is often used as one indicator of the state’s debt burden. There is no one “right” level for the DSR. However, the higher it is and more rapidly it rises, the more closely bond raters, financial analysts, and investors tend to look at the state’s debt practices, and the more debt–service expenses limit the use of revenues for other programs. Figure 9 shows what California’s DSR has been in the recent past and our DSR projections for the forecast period. We estimate that:
- The DSR for infrastructure bonds will rise to 6 percent in 2010–11 and remain at that level in 2011–12, before falling to 5.8 percent by 2012–13.
- If the state’s deficit–financing bonds are included in DSR, it would peak at 8.3 percent in 2009–10, after which these bonds would be repaid and DSR would drop to 6 percent, reflecting only infrastructure bonds.
The DSRs we are projecting, while higher than in past years, are still within the range of what many if not most bond–market participants would consider acceptable. To the extent that additional bonds are authorized beyond those already approved, the state’s debt–service costs and DSR would be higher than projected above. For example, each additional $1 billion of bonds authorized would add roughly $65 million annually to debt–service costs once they are sold.
| Acknowledgments The Legislative Analyst's Office (LAO) is a nonpartisan
office which provides fiscal and policy information and advice to the Legislature. |
LAO Publications To request publications call (916) 445-4656. This report and others, as well as
an E-mail subscription service , are
available on the LAO's Internet site at www.lao.ca.gov. The LAO is located at 925
L Street, Suite 1000, Sacramento, CA 95814. |
Return to LAO Home Page