January 2007
California Travels: Financing Our Transportation
Introduction
In the past year, transportation has been a central issue in the
discussions on the condition of the state’s infrastructure. About
60 percent of Californians view traffic congestion as a major problem.
This dissatisfaction is probably because the state’s transportation
capacity has not kept pace with growth in population and travel demand.
Even with the funding provided by the Traffic Congestion Relief Act
(2000) and Proposition 42 (2002), many feel that the state’s
transportation system suffers from underinvestment. In November 2006,
voters approved two measures to increase the state’s investment in
transportation: Proposition 1A to enhance the reliability of certain
funds and Proposition 1B to provide a one-time infusion of $20 billion
in bond revenues for transportation.
These measures will help to improve the state’s transportation
infrastructure. Nonetheless, issues remain regarding how the state can
meet transportation demands on an ongoing basis. For instance, the
state’s highways and roads require increasing maintenance and
rehabilitation. Additionally, there are emerging issues, such as goods
movement and transportation security, which the state is just beginning
to address.
What is being done to address these problems? How should the state
ensure Proposition 1B funds effectively address congestion problems and
provide mobility to facilitate the state’s growing economy? What other
fund sources are available for transportation? How are these funds
distributed? This publication seeks to answer these and other related
questions in an effort to help those interested in finding solutions to
our transportation challenges.
Contents
Traveling
in California: Trends and Mobility
Transportation Revenues and
Expenditures
The Transportation System: How
Decisions Are Made
Issues for Legislative Consideration
Acronyms and Definitions
Traveling in California: Trends and Mobility
Travel Increasing Steadily…

- Demand for Highway Travel
Outpaced Population Growth. From 1990 to 2003,
California’s population increased by almost 21 percent.
Meanwhile, travel on the state highway system as measured by
vehicle-miles traveled (VMT) increased by 26 percent.
- Population Growth
Concentrated in Inland Areas. Population growth has
been uneven throughout the state. Between 1990 and 2003,
population grew most in the following regions: Sacramento
(50 percent), Bakersfield (47 percent), and Riverside-San
Bernardino (37 percent).
- Inland California Also Sees
Largest Gains in Total Driving. Beyond the state
highway system, demand for travel on local roads also
increased between 1990 and 2003 with the largest gains in
noncoastal regions. The regions with the largest increases
between 1990 and 2003 included: Fresno (61 percent),
Bakersfield (51 percent), and Riverside-San Bernardino
(45 percent).
… But Only Marginal Growth in State Highway Capacity
- Highway Lane-Miles
Increased Minimally. Between 1990 and 2003, highway
lane-miles only increased by about 3 percent. Today,
California has about 50,500 lane-miles of highways,
maintained and operated by the California Department of
Transportation (Caltrans). An additional 327,000 miles of
local roads are maintained and operated by local cities and
counties.
- Growth in Highway Capacity
Uneven Across State. The most significant expansion
in highway capacity over this period occurred in Orange, Los
Angeles and Ventura Counties, and the Bay Area. Capacity
increases were much less noticeable (or even nonexistent) in
other parts of the state.
- Carpool Lane-Miles
Increased Considerably. In 2000, the state highway
system included 925 miles of high occupancy vehicle (HOV)
lanes. As of 2005, California’s highway system included
1,268 miles of HOV lanes, a 37 percent increase. In most
cases, use of HOV lanes is restricted to vehicles with two
or more occupants in order to encourage carpooling. In some
cases, three or more occupants are required for vehicles
using HOV lanes.
- Toll Roads Remain a Small
Fraction of Highway System Capacity. There are about
120 miles of tolled transportation facilities in California.
This includes eight toll bridges in the Bay Area (seven are
state owned) and about 85 miles of toll roads in San Diego
and Orange Counties. Some of these facilities offer variable
tolls which set toll prices by level of congestion and time
of day.
California’s Roads More Crowded Than Other States
|
Rank
(2003) |
Urban
Area |
Miles
Driven Per Highway Lane-Mile |
|
1 |
Los Angeles-Long Beach-Santa
Ana, CA |
23,248 |
|
2 |
Riverside-San Bernardino, CA |
21,429 |
|
3 |
San Francisco-Oakland, CA |
20,242 |
|
4 |
Chicago, IL-IN |
19,516 |
|
5 |
San Diego, CA |
19,460 |
|
6 |
Sacramento, CA |
19,303 |
|
7 |
Atlanta, GA |
19,077 |
|
8 |
Miami, FL |
19,057 |
|
9 |
Houston, TX |
18,970 |
|
10 |
Oxnard-Ventura, CA |
18,873 |
|
|
- Urban Roads Are Heavily
Used. California regions lead the nation with the
most crowded roads, measured in terms of the number of miles
driven on each lane-mile of highway. Los Angeles tops the
list, with Riverside-San Bernardino and San
Francisco-Oakland placing second and third.
- Trends of Road Usage in
Urban Areas. While Los Angeles has the nation’s most
crowded roads, other California regions are catching up.
Between 1990 and 2003, miles driven per highway lane-mile
increased considerably in Sacramento (35 percent),
Riverside-San Bernardino (28 percent), and Oxnard-Ventura
(27 percent).
- Supply Has Not Kept Pace
With Demand. One reason why California’s roads are
more crowded than those in the rest of the country is that
the state’s transportation infrastructure has not expanded
enough to keep pace with growth in travel demand (measured
in VMT).
Congestion Paid for in Delay, Fuel, and Excess Emissions
- Hours of Delay Have Risen.
Because of the imbalance between road supply and
travel demand, delay on urban freeways has nearly doubled
from about 262,000 vehicle-hours per day in 1992 to 512,000
vehicle-hours per day in 2002.
- Increased Congestion.
In 2002, 43 percent of the state’s urban freeways
were congested. Congestion is defined as occurring when
vehicles are traveling at 35 miles per hour or less during
peak commute periods on a typical work day. This is up from
32 percent in 1992.
- Costs of Congestion.
Congestion on urban freeways costs Californians at least
$16 million per day (or $5.9 billion per year) in wasted
time and excess fuel.
- Environmental Impacts.
This delay also has negative environmental
consequences, resulting in an estimated 512 additional tons
of emissions per day.
Are Californians Really in Love With Their Cars?
- While the conventional wisdom is that Californians are
infatuated with their automobiles, some data suggest that
this is not the case.
- For instance, when compared to the average American,
Californians tend to drive fewer miles.
- Californians do have slightly more vehicles than the
average American.
Bus Riders Make Up the Bulk of Transit Ridership
2003-04
- Transit Ridership.
In 2003-04, almost 1.3 billion passenger trips were made on
various modes of transit, including bus, rail, and ferry.
- Most Transit Patrons Ride
the Bus. About 70 percent of these trips were on
buses. Most of the remaining trips (27 percent) were made on
commuter and urban (light) rail systems. Intercity rail,
paratransit, and ferry systems carried less than 3 percent
of all trips.
- Increasing Number of Trips
by Train. Since the late 1990s, the number of transit
trips made by rail has significantly increased. In 2003-04,
about 347 million trips were made by train compared to only
287 million in 1997-98.
- Bus Ridership Down.
In contrast to rail, the total number of annual bus trips in
California has actually declined slightly. In 2003-04,
881 million trips were made on buses, down from 889 million
in 1997-98.
- While Auto Travel Grows,
Transit Ridership Stagnates. While auto travel on
state highways has increased by 26 percent since 1990,
transit (bus and rail) ridership overall has experienced
almost no growth. Again, this is due to the slight drop in
bus trips (the mode representing the bulk of transit
ridership), offset by growth in other transit modes, such as
intercity, commuter, and urban rail which have experienced
considerable ridership growth.
Intercity Rail Ridership Grows, but So Do State’s Costs
- The state’s passenger rail system includes intercity
rail that serves trips between regions in California and to
other parts of the country.
- Currently, Amtrak operates all intercity rail service in
the state. The state funds service in three corridors:
-
Capitol Corridor serving San Jose, Oakland,
Davis, Sacramento, and Auburn.
-
Pacific Surfliner serving San Diego, Los Angeles,
Santa Barbara, and San Luis Obispo.
-
San Joaquin serving Oakland, Sacramento, Fresno,
and Bakersfield.
- Between 1994-95 and 2004-05, ridership on the three
corridors has nearly doubled from 2.3 million to 4.4 million
annual passengers, an average annual rate of 6.6 percent.
The Capitol Corridor has experienced the largest increase in
ridership, which resulted mainly from the expansion of
service in the number of daily round-trip trains available
to riders.
- State costs (funded mainly by the Public Transportation
Account) to operate and maintain intercity service nearly
doubled over that period from $55 million to almost
$100 million annually, an average annual growth rate of
5.8 percent.
Urban and Commuter Rail Ridership Concentrated in Bay Area
- Urban and commuter rail are the components of the
state’s passenger rail system that primarily serve local and
regional transportation needs.
- These services are generally planned and administered by
local or regional transportation agencies, with funding
provided by a combination of local, state, and federal
sources.
- The bulk of urban and commuter rail ridership has
historically been in the Bay Area. However, most of the
recent growth in rail ridership has been outside of the Bay
Area.
- Ridership gains since the late 1990s on rail systems in
the Los Angeles (73 percent) and Sacramento-San Joaquin
(42 percent) regions are at least partially attributable to
major system expansions over that period.
Transportation Revenues and Expenditures
Local Funds Account for Almost One-Half of Ongoing Funds for
Transportation
2005-06
Transportation in California is funded by a variety of state, local,
and federal fund sources. Together, these revenues provide roughly
$20 billion a year for transportation purposes.
State Funds
-
Ongoing state funds
consist primarily of the state excise tax on gasoline and
diesel fuels, weight fees, as well as most of the state
sales tax on motor fuels.
-
Additional state funding
sources can include bond revenues and appropriations from
the General Fund.
-
In 2005-06, state revenues
provided about 30 percent ($6.1 billion) of total funds for
transportation.
Local Funds
-
Local funds for
transportation are derived from a variety of revenue
sources. These sources include (but are not limited to) a
statewide 0.25 percent tax on the sale of all goods and
services, additional (optional) local sales taxes, property
taxes, and transit fares.
-
In 2005-06, we estimate
that local funds constituted 47 percent ($9.4 billion) of
all revenues for transportation.
Federal Funds
-
These funds are generally
apportioned to California based on the state’s contribution
of federal excise taxes on motor fuels to the federal
Highway Trust Fund.
-
In 2005-06, California
received about $4.6 billion in federal transportation funds.
This accounted for 23 percent of total funding to the
state’s transportation system.
Price of Motor Fuel Includes Taxes for Transportation
- A large portion of transportation revenues in California
are collected at the pump, with Californians paying the
following taxes:
- 18 cents in state
tax for each gallon of gasoline and diesel fuel
(generally referred to as the “gas” tax).
- 18.4 cents in federal
tax for each gallon of gasoline.
- 24.4 cents in federal
tax for each gallon of diesel fuel.
- 7.25 percent uniform
state and local
sales tax, plus optional local sales taxes for
transportation or other purposes varying by county. (The
statewide average sales tax level is approximately
7.9 percent once local optional taxes are considered.)
- The state also collects weight fees on commercial
vehicles (trucks) based on either the truck’s unladen weight
(for trucks lighter than 10,000 pounds) or its gross weight
(for trucks in excess of 10,000 pounds).
State Transportation Funding Comes Primarily From Fuel
Taxes. . .
2005-06
. . . And Goes Primarily for Highways
Key State Transportation Funding Accounts
State Highway Account (SHA)
- Revenues-state gas tax and weight fees.
- Expenditures-generally used for highway
maintenance and operation, highway rehabilitation and
reconstruction, and Caltrans administration. Can also be
used for capital improvements (highways and certain transit
facilities).
Transportation Investment Fund (TIF)
- Revenues-state sales tax on gasoline.
- Expenditures-provides funds directly for
local road improvements, as well as for capital projects
(highway and transit) selected by regionals and Caltrans in
the State Transportation Improvement Program. Also funds
traffic congestion relief projects and transit indirectly
through transfers to the TCRF and PTA (see below).
Traffic Congestion Relief Fund (TCRF)
- Revenues-state sales tax on gasoline
(from TIF).
- Expenditures-provides funds for 141
statutorily specified transportation projects.
Public Transportation Account (PTA)
- Revenues-state sales tax on diesel, and a
portion of state sales tax on gasoline including:
- Sales tax on 9 cents per gallon of
gasoline (referred to as Proposition 111 revenue).
- Net revenue from 4.75 percent sales tax
on gasoline in excess of 0.25 percent sales tax on all other
goods, over and above the Proposition 111 revenues (referred
to as spillover).
- A portion of state gasoline sales tax
revenue from TIF.
- Expenditures-provides funds for transit
capital improvement, as well as operating assistance for
local transit systems. Also funds capital improvement and
ongoing support of the state’s intercity rail program. Funds
are restricted to expenditures for transit and planning
only.
|
Use of Gas Tax and Weight Fees Is Restricted
- The State Constitution (Article XIX) restricts how state
gas tax and weight fee revenues are spent. These monies may
only be used to plan, construct, maintain, and operate
public streets and highways, as well as to plan, construct,
and maintain transit/rail tracks and related facilities
(such as stations). These revenues
cannot be used to
operate transit systems or to purchase rolling stock
(trains, buses, or ferries).
- In 2005-06, these sources provided about $4.3 billion,
including $3.4 billion from the gas tax. A portion of gas
tax revenues-roughly $1.1 billion in 2005-06-is allocated to
cities and counties to plan, construct, and maintain local
streets and roads.
- The remaining $3.2 billion state gas tax and weight fee
revenues, along with federal transportation funds, finance
various state highway purposes. Together, these revenues
totaled about $6 billion in 2005-06. Current law sets
priorities for expending these funds as follows:
- Highway maintenance and operations, and local
assistance.
- Highway rehabilitation and safety projects in the
State Highway Operations and Protection Program.
- Capital improvements (including capacity expansion
projects such as additional highway lanes and new
transit facilities) in the State Transportation
Improvement Program (STIP).
Sales Tax on Motor Fuel Used for Broad Range of
Transportation Purposes
Statewide, there is a uniform sales tax rate of 7.25 percent on most
purchases. Five percent of that rate goes to the state, with the
remainder dedicated to local uses. (Due to additional local optional
taxes, the average sales tax rate in California is closer to
7.9 percent.)
Sales Tax on Gasoline
- Before 2002, most revenues generated from the sales tax
on gasoline were deposited into the General Fund and used
for various nontransportation purposes. Only a small share
of state gasoline sales tax revenues (spillover and
Proposition 111 revenues) was used for transit purposes.
- Since 2002, Proposition 42 constitutionally requires
that the portion of gasoline sales tax revenues that
previously went to the General Fund be transferred to
transportation purposes. The funds can be used for a broad
range of projects-highways, streets and roads, and transit
(including rolling stock). After 2007-08, 40 percent of
these funds will be used for STIP projects, 40 percent will
be used for local street and road improvements, and
20 percent will go for transit purposes. (Through 2007-08, a
portion of the annual Proposition 42 transfer first will be
used to fund projects in the Traffic Congestion Relief
Program.)
- Proposition 42 allowed the transfer to be suspended
under certain conditions. This occurred in 2003-04 and
2004-05. Proposition 1A, passed in November 2006, limits
the conditions under which suspensions may occur.
- In 2005-06, Proposition 42 provided almost $1.4 billion
for transportation. Another $67 million in gasoline sales
tax revenues went to the PTA for transit purposes. In total,
gasoline sales tax revenues accounted for 23 percent of
state funds for transportation in 2005-06.
Sales Tax on Diesel
- Most of the revenues from the state’s portion of the
sales tax on diesel fuel (4.75 percent rate) go to the PTA
for transit purposes. This revenue, about $271 million in
2005-06, accounts for about 4 percent of state funds for
transportation. Revenues from the remaining 0.25 percent
rate are retained in the General Fund.
Most Highway Expenditures Are for Capital
Projects
2005-06
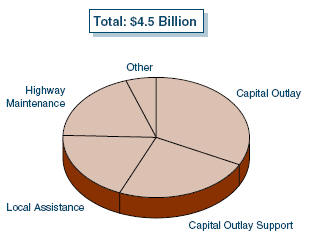
Most state highway program expenditures are for capital improvement
on the state and local road system, as well as to fund planning and
engineering activities supporting these improvements.
- Capital improvements-one-third
of Caltrans’ highway expenditures, funds highway and bridge
rehabilitation, expansion, right-of-way acquisition, and
safety improvements.
- Capital project support-24 percent
of highway expenditures, includes project design,
engineering, and environmental review activities.
- Local assistance-19 percent
of highway expenditures, primarily federal funds, the state
passes through to local agencies, which finance highway and
roadway improvements, bridge replacement and seismic
retrofit, as well as transit and nonmotorized (bicycle and
pedestrian) facility enhancements.
Remaining funds (one-quarter) are for noncapital uses:
- Highway maintenance-about
19 percent of spending, funds roadway repairs, landscaping,
and snow and litter removal.
- Other support
activities make up the
remaining 5 percent of highway expenditures. These include
spending for traffic management centers, new technology
research, legal costs, costs related to scheduling and
tracking projects, as well as various Caltrans
administrative expenses.
State Transit Expenditures Primarily for Local Assistance
2005-06
Most state transit expenditures provide assistance to local and
regional agencies to make capital improvements to rail and bus equipment
and facilities, and to support transit operations.
- Transit capital
improvements account for over one-half of these
expenditures (55 percent). These expenditures are in the
form of project grants to local jurisdictions.
- State Transit Assistance
constitutes about 29 percent of total state
expenditures for transit. These funds are distributed by
formula statewide to transit operators to support the
operations and maintenance of transit systems, and for
capital acquisition purposes.
- Support for intercity
passenger rail service accounts for about 15 percent
of total state transit expenditures.
- Transit planning and
administrative support make up 1 percent of state
expenditures for transit purposes.
State Bond Funds Will Provide Substantial One-Time Infusion
to Transportation
|
|
|
Proposition 1B Uses of Bond Funds |
|
(In
Millions) |
|
|
Amount |
|
Congestion Reductions, Highway and Local Road Improvements |
$11,250 |
|
Reduce congestion on state
highways and major access routes |
$4,500 |
|
Increase highways, roads, and
transit capacity |
2,000 |
|
Improve local roads capacity,
safety, and operations |
2,000 |
|
Enhance State Route 99
capacity, safety, and operations |
1,000 |
|
Provide grants for locally
funded transportation projects |
1,000 |
|
Rehabilitate and improve
operation of highways and roads |
750 |
|
Transit |
$4,000 |
|
Improve local rail and transit
capital |
$3,600 |
|
Improve intercity rail capital |
400 |
|
Goods Movement and Air Quality |
$3,200 |
|
Improve movement of goods on
highways, rail, and in ports |
$2,000 |
|
Reduce emissions from goods
movement activities |
1,000 |
|
Retrofit and replace school
buses |
200 |
|
Safety and Security |
$1,475 |
|
Improve transit system
security and disaster response |
$1,000 |
|
Improve railroad crossing
safety |
250 |
|
Seismically retrofit local
bridges and overpasses |
125 |
|
Improve security and disaster
planning in ports, harbors, and ferry facilities |
100 |
|
Total |
$19,925 |
- In November 2006, voters approved Proposition 1B, the
Highway Safety, Traffic Reduction, Air Quality, and Port
Security Bond Act of 2006. This act allows the state
to sell $20 billion in general obligation bonds to fund
transportation projects to relieve congestion, improve air
quality, and enhance the safety and security of the state’s
transportation system.
- These bond funds are one-time in nature. However, they
constitute a major infusion of state funds into the state’s
transportation system that will be spent over multiple
years.
About One-Half of Local Transportation Revenues
Comes From Sales Tax
2005-06
Collectively, local revenues generated an estimated $9.4 billion
from various sources in 2005-06 for transportation.
- Optional local sales taxes
represent an important source of local transportation
funding, generating approximately $3.1 billion annually.
These revenues fund improvements to highways, local streets
and roads, and transit systems.
- Quarter-percent tax on all
sales provided almost $1.4 billion in 2005-06. The
funds are generated under the Transportation Development Act
of 1971 and are deposited into the Local Transportation
Fund. They provide a major source of support for transit
operating assistance and capital projects.
- Transit fares
provided about $1.2 billion to local transit systems in
2005-06.
- Property tax and other
local funds collectively provided an estimated
$3.8 billion in 2005-06. These funds include property taxes,
developer fees, bond proceeds, as well as fines and
forfeitures. These funds are spent mainly on maintenance and
improvements of local streets and roads.
Optional Local Sales Taxes Contribute Significant
Transportation Funding
|
Agency |
Tax Rate (%) |
Year Established |
Year Expires |
Annual Revenue
(Millions) |
|
Permanent Measures |
|
|
|
|
BARTa |
0.5% |
1970 |
None |
$238 |
|
LACMTAb |
1.0 |
1981 and 1991 |
None |
1,300 |
|
San Mateo County |
0.5 |
1982 |
None |
61 |
|
Santa Clara VTAc |
0.5 |
1976 |
None |
150 |
|
Santa Cruz Metropolitan |
0.5 |
1979 |
None |
16 |
|
Subtotal |
|
|
|
($1,765) |
|
Fixed-Term
Measures |
|
|
|
|
Alameda |
0.5% |
2002 |
2022 |
$106 |
|
Contra Costa |
0.5 |
1989 |
2009 |
66 |
|
Fresno |
0.5 |
1987 |
2007 |
46 |
|
Imperial |
0.5 |
1990 |
2010 |
8 |
|
Marin |
0.5 |
2005 |
2025 |
20 |
|
Orange |
0.5 |
1991 |
2011 |
226 |
|
Riverside |
0.5 |
1989 |
2009 |
104 |
|
Sacramento |
0.5 |
1989 |
2009 |
93 |
|
San Bernardino |
0.5 |
1990 |
2010 |
104 |
|
San Diego |
0.5 |
1988 |
2008 |
213 |
|
San Francisco |
0.5 |
2004 |
2034 |
66 |
|
San Joaquin |
0.5 |
1991 |
2011 |
38 |
|
San Mateo |
0.5 |
1989 |
2009 |
61 |
|
Santa Barbara |
0.5 |
1990 |
2010 |
29 |
|
Santa Clara |
0.5 |
2006 |
2036 |
150 |
|
Sonoma |
0.25 |
2005 |
2025 |
23 |
|
Subtotal |
|
|
|
($1,353) |
|
Total |
|
|
|
$3,118 |
|
|
|
a
Bay Area Rapid Transit. |
|
b
Los Angeles County Metropolitan Transportation
Authority. |
|
c
Valley Transportation Authority. |
|
|
- History of Local Optional
Sales Taxes. Optional local sales taxes for
transportation originated in 1970, when the Legislature
authorized several counties served by the BART District to
impose a regional sales tax. Since 1987, state law has
authorized counties to impose special sales taxes for
transportation purposes, subject to voter approval.
Currently, a two-thirds vote is required for approval of any
local optional sales tax for transportation purposes.
- Current Use. In most
cases, counties proposing to impose local option sales taxes
must provide voters with an expenditure plan that specifies
how the funds would be used. As of 2006, 17 counties have
optional local sales taxes for transportation. (Starting in
early 2007, two additional counties-Madera and Tulare-will
levy a local sales tax for transportation.)
Fares and Local Funds Comprise the Bulk of
Transit Revenues
2003-04
(In Millions)
- Transit services are funded by a combination of
passenger fares and local, state, and federal funds.
- For the state’s largest transit operators, local funds
(such as local sales tax and property taxes) tend to provide
the largest source of revenues. For 2003-04, VTA reported
the highest proportion of total revenues met through local
funds (76 percent). At the low end, BART reported that local
funds constitute 53 percent of total revenues.
- Passenger fares also provide an important source of
revenues for operators. For instance, passenger fares made
up 47 percent of BART’s revenues in 2003-04. However,
passenger fares represented a much smaller proportion
(10 percent) of total revenues for VTA.
- The proportion of total revenues from state and federal
funds varied among transit operators. These revenues are
estimated to range from 0.2 percent of BART’s total revenues
to 18 percent of revenues for AC Transit.
Federal Transportation Act and Its Impact on California
|
|
|
The Safe, Accountable, Flexible,
Efficient Transportation Equity Act: A Legacy for
Users (SAFETEA-LU) |
|
Major Provisions |
|
General: |
|
Maintains
overall structure of previous transportation act
(TEA-21), but increases emphasis on safety. |
|
Continues
TEA-21’s flexibility allowing up to 50 percent of
most program formula funds to be redirected. |
|
Funding Nationwide: |
|
Provides 42
percent increase in average annual funding over
TEA-21. Authorization of $241 billion for fiscal
years 2005 through 2009 includes $190 billion for
highways, $45 billion for transit, and $5.7 billion
for safety enhancements. |
|
Earmarks over
$26 billion worth of congressionally specified
projects, including $14.8 billion for High Priority
Projects and $1.8 billion for Projects of National
and Regional Significance. |
|
Highways: |
|
Guarantees
“donor states” a minimum of 90.5 percent return on
state fuel tax contributions in 2005 and 2006, 91.5
percent in 2007, and 92 percent in 2008 and 2009. |
|
Provides
incentives for private sector participation in
construction of major transportation facilities. |
|
Pilots
include: federal delegation of environmental review
responsibilities to states and toll programs on
interstate highways. |
|
Transit: |
|
Most
discretionary funds remain available for competitive
project applications. |
|
Provides
capital funding for smaller transit projects
requiring less than $75 million in federal funds. |
|
|
Federal Transportation Act Provides Funding Through 2009
|
|
|
Authorized Funding for California |
|
(In Billions) |
|
|
Formula |
Earmarks |
Totals |
|
Highway |
$15.4 |
$2.4 |
$17.8 |
|
Transit |
3.9 |
1.3 |
5.2 |
|
Safety |
0.4 |
— |
0.4 |
|
Totals |
$19.7 |
$3.7 |
$23.4 |
|
|
- Source of Federal Funds.
The federal government levies a fuel excise tax-18.4
cents per gallon of gasoline and 24.4 cents per gallon of
diesel. These revenues are deposited in the federal Highway
Trust Fund-the primary account for federal transportation
spending. Annually, California receives a share of these
funds via the federal transportation program (SAFETEA-LU),
which authorizes $241 billion to be invested in highways,
transit, and transportation safety projects nationwide from
2005 through 2009.
- Funding to State.
The federal act authorizes $23.4 billion for California
through 2009, including about $18 billion for highways, $5
billion for transit, and $452 million for safety
improvements. Roughly 15 percent of this funding ($3.7
billion) is earmarked for specific projects. For 2005-06,
federal funds provided about $4.6 billion for California’s
transportation system.
The Transportation System: How Decisions Are Made
|
|
|
The Key
Players: Who Decides What Gets Built and When? |
|
State |
|
Legislature |
·
Sets overall transportation policies, including
establishing revenue sources and expenditure
priorities.
·
Appropriates lump sum for capital improvements
through annual budget and provides oversight on
implementation of the state transportation program.
·
In general, delegates the authority to
select specific projects to Caltrans, regional and
local agencies, as well as CTC.
·
Occasionally designates transportation
projects statutorily. In 2000, selected 141 projects
to be funded through the Traffic Congestion Relief
Program. |
|
Department of Transportation (Caltrans): |
·
Implements the state transportation
program in general through 12 districts and
headquarters in Sacramento.
·
Owns, operates, maintains, and repairs
the state highway system.
·
Plans and designs capital improvement
projects on the state highway system.
·
Selects projects for the interregional
portion of the five-year State Transportation
Improvement Program (STIP).
·
In 2006-07, 22,352 authorized
positions in department. |
|
California Transportation Commission (CTC) |
·
Consists of nine members appointed by
the Governor.
·
Recommends policy and funding
priorities to the Legislature.
·
Adopts estimates (prepared by Caltrans)
of available transportation funds for capital
projects.
·
Reviews and adopts STIP and State
Highway Operation and Protection Program to ensure
compliance with statutory guidelines.
·
Allocates state and federal funds to
projects nominated by Caltrans and regional
agencies.
·
Provides oversight on Caltrans and
local project delivery. |
|
Regional |
|
Regional
Transportation Planning Agency (RTPA) |
·
Currently, there are 48 RTPAs
statewide.
·
Formed by specific legislation. These
RTPAs are usually in the form of council (or
association) of governments, and local
transportation commissions.
·
Administers state funds and allocates
federal and local funds to projects.
·
Selects projects for the regional
portion of the STIP. |
|
Metropolitan Planning Organization (MPO) |
·
Currently, there are 17 MPOs in
California.
·
Federally required planning bodies;
typically the same as an urban region’s RTPA.
·
Prepares the 20-year Regional
Transportation Plan and selects projects.
·
The Governor designates an MPO in
every urbanized area with a population over 50,000. |
|
Other |
|
Other
Players |
·
County transportation authorities
develop expenditure plans for voter-approved local
option sales tax measures and administer funds.
·
Federal transportation agencies—such
as the Federal Highway Administration and the
Federal Transit Administration—oversee the use of
federal transportation funds.
·
Environmental agencies at the local,
state, and federal level review transportation
projects and issue permits to ensure transportation
improvements comply with environmental laws.
·
Cities and counties set land-use
policy and nominate transportation projects for
funding by the RTPA.
·
Transit agencies—such as the Bay Area
Rapid Transit and Los Angeles County Metropolitan
Transportation Authority—nominate projects for
funding and deliver transportation services and
improvements. |
|
|
Four Major Programs Guide State Capital
Spending
Currently, there are four major programs which guide state capital
spending for transportation in California:
- The State Transportation
Improvement Program (STIP) funds new construction
projects that add capacity to the transportation system.
These projects include capital improvements to highways,
streets and roads, and transit systems. Funding comes from a
mix of the state gas tax and sales tax on motor fuels, as
well as federal funds. This program is ongoing.
- The State Highway
Operations and Protection Program (SHOPP) funds capital
projects to improve existing highways. Projects include
pavement rehabilitation (reconstruction), as well as
projects to enhance highway safety and operations. Funding
comes from state gas tax, truck weight fees, and federal
funds. This program is ongoing.
- The Traffic Congestion
Relief Program (TCRP) funds 141 capital projects
specified in the Traffic Congestion Relief Act of 2000 (AB
2928, Torlakson). The TCRP includes mainly highway and
transit projects located in urban areas. Funding comes
primarily from gasoline sales tax revenues provided each
year through 2007-08. However, TCRP will likely receive
revenues into the next decade from repayment of loans it
made to the General Fund in past years.
- Proposition 1B Bond Program
funds projects to relieve congestion, facilitate
goods movement, improve air quality, and enhance the safety
and security of the transportation system. Specific projects
have yet to be selected, but will include projects that add
capacity to highways and transit systems, improve major
trade infrastructure (including highways with high truck
volumes, ports, and freight rail lines), as well as enhance
the safety of existing transportation infrastructure. These
projects are to be funded by almost $20 billion in general
obligation bonds sold by the state.
Availability of Funds Determines What Gets Built and When in
the STIP
How Are State Transportation Dollars
Estimated?
-
Fund Estimate. Caltrans
estimates biennially all federal and state transportation
funds that would be available over a five-year period. These
funds include mainly revenues from state and federal excise
tax on motor fuels, sales tax on motor fuels, and truck
weight fees.
- The estimate projects
the amounts to be committed to various purposes over the
period. Priority is given to highway maintenance and
operations, local assistance, and SHOPP projects. Any
remaining funds would be available for STIP projects.
How Are STIP Funds Distributed?
How Are Regional Funds Programmed?
How Are Projects Chosen in the Regional
Program?
-
Projects are selected for
funding by RTPAs based on regional priorities, as defined in
20-year regional transportation plans. Projects are selected
from a large pool of projects proposed by cities, counties,
and transit agencies. The RTPAs then submit their respective
lists to CTC for approval.
- The CTC can either adopt or reject an individual RTIP in
its entirety, but cannot delete or add specific projects.
Together, the 48 regional proposals form the statewide RTIP.
How Are the Interregional Funds
Distributed?
Expenditures During the 2006 STIP Period
For the 2006 STIP period (from 2006-07 to 2010-11),
Caltrans estimates that available transportation funds total
$45 billion. (This estimate does not include bond funds available under
Proposition 1B.)
- Non-STIP
Expenditures. Most available funds will
not go to STIP projects (new construction). About $39 billion will
be spent on other priorities:
- About $18 billion for noncapital expenditures
(including highway maintenance and operations) and local
assistance.
- Almost $12 billion for SHOPP projects to
rehabilitate highways and improve highway safety and operations.
- About $9 billion for other purposes,
including operating assistance for local transit systems, local
streets and road improvements, TCRP projects, and the state’s
intercity rail program.
- STIP Expenditures.
About $5.9 billion-the remaining amount
after other requirements have been funded-will be available for new
construction projects.
- Historically, most of the funds available for
STIP projects came from the SHA (state gas tax and weight fees)
and federal funds. In recent years, however, growing highway
rehabilitation and maintenance expenditures have consumed an
increasing proportion of these revenues, leaving fewer funds for
STIP projects.
- For the 2006 STIP period, most of the funds
available for STIP projects will come from TIF and PTA
(primarily sales tax on motor fuels).
|
Most STIP Funds Used for Roads
2006 Through 2011
- Funding for Projects in the
2006 STIP. The 2006 STIP provides about $5.9 billion
over a five-year period for capital improvements. Of this
amount, 65 percent is for highways and roads, 29 percent is
for transit, and 6 percent is for transportation
enhancements (including roadway beautification, as well as
bicycle and pedestrian facilities).
- Many STIP Funds Are
Restricted to Specified Uses. Projects funded in STIP
are constrained by the types of funds available. For
instance, funds from PTA may only be used for transit
projects, whereas funds from TIF are more flexible in their
use. Thus, there could be a mismatch between available funds
and the projects proposed to be funded over a STIP period.
- For instance, there were considerably more highway
and road projects proposed in the 2006 STIP than dollars
available for these types of projects (TIF, SHA, and
federal funds). Because most of the funding available
for new projects was from PTA, the adopted 2006 STIP
includes additional funds only for transit projects.
- Funding Provided for
Discrete Project Development Phases. These phases
include engineering and design (known as capital outlay
support), environmental review, right-of-way acquisition,
and construction.
The SHOPP Includes Primarily Highway Pavement and Safety
Projects
2006 Through 2010
-
The SHOPP primarily
funds pavement rehabilitation and projects that improve
roadway safety. It also funds roadside preservation
(including rest areas and freeway plantings), operational
improvements (such as ramp metering), upkeep of facilities
(including office buildings and equipment shops),
construction of railroad grade crossings, and hazardous
waste mitigation.
- The SHOPP is based on a ten-year plan prepared by
Caltrans. Caltrans develops this plan by periodically
inspecting the state highway system to identify areas in
need of rehabilitation, safety, or operational improvements.
The SHOPP is updated every two years.
- Projects are selected by Caltrans based on statewide
need, rather than a geographic formula, such as percentage
of population or highway lane-miles. Available funds also
constrain the number of projects included in the four-year
SHOPP.
- For the four-year period from 2006 to 2010, CTC adopted
a SHOPP of about $7.9 billion. Most of this amount
($6.7 billion) has been programmed for specific projects.
(This amount does not include the support costs to design
and engineer projects.) The remainder is left unallocated
for unanticipated needs.
|
|
|
SHOPP and
STIP Allocations by County |
|
(In
Millions) |
|
|
SHOPP (2006-2010) |
STIP (2006-2011) |
|
Alameda |
$461 |
$152 |
|
Alpine |
7 |
29a |
|
Amador |
21 |
a |
|
Butte |
35 |
18 |
|
Calaveras |
26 |
a |
|
Colusa |
31 |
3 |
|
Contra Costa |
159 |
65 |
|
Del Norte |
46 |
2 |
|
El Dorado |
245 |
16 |
|
Fresno |
84 |
84 |
|
Glenn |
17 |
5 |
|
Humboldt |
138 |
27 |
|
Imperial |
36 |
46 |
|
Inyo |
34 |
55 |
|
Kern |
118 |
155 |
|
Kings |
62 |
18 |
|
Lake |
69 |
14 |
|
Lassen |
34 |
12 |
|
Los Angeles |
994 |
874 |
|
Madera |
20 |
9 |
|
Marin |
11 |
32 |
|
Mariposa |
2 |
4 |
|
Mendocino |
113 |
47 |
|
Merced |
137 |
12 |
|
Modoc |
— |
5 |
|
Mono |
18 |
31 |
|
Monterey |
81 |
97 |
|
Napa |
38 |
11 |
|
Nevada |
159 |
22 |
|
Orange |
231 |
327 |
|
Placer |
208 |
83 |
|
Plumas |
44 |
9 |
|
Riverside |
245 |
153 |
|
Sacramento |
137 |
72 |
|
San Benito |
2 |
1 |
|
San Bernardino |
639 |
287 |
|
San Diego |
219 |
174 |
|
San Francisco |
35 |
41 |
|
San Joaquin |
114 |
42 |
|
San Luis Obispo |
68 |
53 |
|
San Mateo |
175 |
78 |
|
Santa Barbara |
78 |
95 |
|
Santa Clara |
187 |
53 |
|
Santa Cruz |
42 |
28 |
|
Shasta |
286 |
30 |
|
Sierra |
— |
3 |
|
Siskiyou |
40 |
19 |
|
Solano |
237 |
60 |
|
Sonoma |
99 |
78 |
|
Stanislaus |
54 |
65 |
|
Sutter |
23 |
21 |
|
Tahoe RPA |
N/A |
3 |
|
Tehama |
101 |
8 |
|
Trinity |
13 |
17 |
|
Tulare |
43 |
53 |
|
Tuolumne |
24 |
6 |
|
Ventura |
62 |
78 |
|
Yolo |
95 |
25 |
|
Yuba |
13 |
7 |
|
Subtotals |
($6,710) |
($3,812) |
|
Interregional Program |
N/A |
1,361 |
|
Unallocated Funds |
1,185 |
730 |
|
Totals |
$7,895 |
$5,904 |
|
|
|
a
Shared by Amador, Alpine, and Calaveras Counties. |
|
|
- While STIP funds are distributed according to a formula
based on population and highway lane-miles, SHOPP funds are
distributed according to need.
- As a result, some counties-such as Marin and Orange-
receive substantially more STIP funds than SHOPP funds,
while the reverse is true for other counties, including
Nevada and Del Norte.
- Counties often have the opportunity to advance their
STIP funding. This means that counties can borrow from
future-year STIP shares in order to fund a project sooner.
Because some counties, like Fresno, advanced funds in prior
years, these counties will receive less new funding in the
2006 STIP than the formula would otherwise provide.
Traffic Congestion Relief Program: Projects
Defined by Statute
- Projects Defined by
Statute. The TCRP is a multiyear transportation
funding program. In 2000, the Traffic Congestion Relief Act
committed $4.9 billion (largely in gasoline sales tax
revenues) to fund 141 projects specified in statute. Because
TCRP projects are specified in statute, rather than
programmed by CTC, the project selection process for TCRP is
very different from STIP and SHOPP.
- Large Share of Funds for
Transit and Rail. Over one-half of TCRP funds
(62 percent) are provided for transit and rail projects.
Most of the remaining funds are for highway projects, with a
small share of funds dedicated to other purposes, including
local road enhancements, seismic retrofit, and air quality
improvement.
- Program Ends, but Projects
Not Yet Delivered. Due to the state’s fiscal
condition, many TCRP funds were loaned to the General Fund
during the early years of the program. Under current law,
most of these loans will be repaid to TCRP by June 30, 2016.
Because of these loans, as well as other delays related to
specific projects, many TCRP projects will not be delivered
until after 2010.
- Through 2005-06, 26 projects have been completed
which received about $300 million in TCRP funds. So far,
almost $1.7 billion (35 percent of the total funding
amount) has been expended on development of all TCRP
projects.
Proposition 1B: New Funding Programs Guide Project Selection
In 2006, voters approved Proposition 1B, which provides almost
$20 billion in general obligation bonds to fund a variety of
transportation purposes. These bond funds are subject to appropriation
by the Legislature before they can be expended.
From Planning to Construction: How a Project
Gets Built
In order to develop a transportation project from a concept-through
design, engineering, and construction-to a useable facility, a number of
steps have to be taken and requirements met. The key steps and processes
are highlighted below.
Long-Term Transportation Planning to
Identify Projects
-
Federal and state law
require that every region with a population of 50,000 or
more prepare and regularly update a 20-year Regional
Transportation Plan (RTP). This plan identifies the
transportation needs of the region based on projections of
growth and travel demand, coupled with projections of
estimated funding levels.
- Any project that is expected to have a negative air
quality impact must
be included in the RTP. This ensures that the
project’s air quality impact is considered in the evaluation
of the region’s ability to meet state and federal air
quality standards.
- The RTP must be approved by the Federal Highway
Administration (FHWA), the Federal Transit Administration,
and must be consistent with the State Implementation Plan
for air quality conformity with the federal Clean Air Act
before a project is eligible for federal funds.
Prepare
Initial Document
-
To begin a transportation
project, Caltrans prepares a project initiation document to
define the project and describe its cost, scope, and
schedule.
Secure Funding for Project
-
Once a project has been
included in the RTP, its sponsor (such as a city, county, or
transit agency) must secure funding for the project. Funding
may come from any combination of state, federal, local, or
private sources.
- For projects built with state funds, funding is
generally secured when a project is programmed in the STIP;
for projects built with federal funds, but no state funds,
projects must be included in the federal equivalent, known
as the Federal Transportation Improvement Program.
Environmental Review
-
Before extensive design or
construction can begin, the project must comply with state
and federal environmental laws. The two major laws affecting
transportation projects are the California Environmental
Quality Act and the National Environmental Policy Act (NEPA).
These laws require that various alternatives be examined in
order to meet the needs of the project while minimizing its
negative environmental impact.
- Typically, environmental review is the longest and most
unpredictable phase of the project delivery process. Project
evaluation and permit approval by as many as 15 to 20
agencies on certain projects takes considerable time.
- The federal act, SAFETEA-LU, allows five states,
including California, to takeover FHWA’s NEPA review duties
on a pilot basis. Chapter 31, Statutes of 2006 (AB 1039,
Nuñez) allows Caltrans to use this delegation of authority
through January 1, 2009. The law requires Caltrans to report
on the costs and time savings realized through the pilot, so
that California can assess the benefits of NEPA delegation.
Design
-
Since the passage of
Proposition 35 in 2000, both Caltrans and local
transportation entities have the authority to contract out
the design of transportation projects, including STIP
projects. Prior to 2000, the State Constitution required
that most state highway projects be designed by state staff.
- Although preliminary design must be done in order to
conduct environmental review, final design work is not
completed until the project has received environmental
approval by the various state and federal agencies.
Construction
Issues for Legislative Consideration
Implementing the Transportation Bond
In November 2006, voters approved Proposition 1B, which allows the
state to sell $20 billion in general obligation bonds to fund
transportation projects that relieve congestion, facilitate goods
movement, improve air quality, and enhance safety and security. These
bond funds, when appropriated by the Legislature, will be available for
expenditure over multiple years for a number of existing as well as new
transportation programs.
In order to achieve the objectives of Proposition 1B, the bond funds
should be allocated to effective projects that can be constructed and
open to users in a timely manner. We recommend that the Legislature take
the following actions relating to Proposition 1B implementation to
ensure that the bond act’s objectives are met.
Adopt Additional Project Eligibility,
Evaluation Criteria. Proposition 1B establishes a number of new
funding programs, but provides only general guidelines for the use of
the funds. This leaves fund recipients with broad discretion. For
example, in allocating $1 billion for Transit Security grants, the bond
act language is very open-ended-conceivably these funds could be used
either for projects that specifically address a security threat or for
projects that more generally increase a transit system’s capacity. Such
a lack of specificity may allow projects to be funded that do not best
align with state priorities. We think that the Legislature should adopt
additional project eligibility and evaluation criteria for five new
programs with funding totaling $5.1 billion. These include Trade
Corridors, Air Quality, Transit Security, State-Local Partnership, and
Port Security.
Ensure Timely Project Delivery.
Projects must be complete and open to users before offering any
mobility, air quality, or economic benefits. To create incentives for
timely delivery of projects and avoid bond funds remaining available
indefinitely for projects that show no signs of progressing (as has
occurred in the Traffic Congestion Relief Program [TCRP]), the
Legislature should adopt project delivery deadlines, as well as
mechanisms to remove funds from lagging projects so they can be
allocated elsewhere.
Provide Adequate Resources to Deliver
Projects, Including Increased Use of Contracting. Considerable
personnel resources will be necessary to plan and construct the
multitude of transportation projects funded by these bonds. Given
Caltrans’ crucial role in delivering bond-funded projects, the
department’s project delivery capacity will likely need to be expanded
significantly for a number of years. The Legislature should ensure that
Caltrans, in its annual budget request, has an adequate combination of
support resources-including both state staff and contracted
services-that would enable the department to provide timely delivery of
all transportation projects.
Provide Ongoing Program Oversight.
Transportation projects often take five or more years to plan and
construct. It is therefore important for the Legislature to monitor on
an ongoing basis how well the bond-funded programs are delivering
projects that cost-effectively relieve congestion and meet other
objectives. Given the number of programs and fund recipients, we
recommend that the Legislature designate one agency, such as California
Transportation Commission (CTC), to oversee the entire transportation
bond program and provide an annual report to the Legislature with
specific information, including progress in delivering projects on time
and on budget. We further recommend that the policy committees and
budget subcommittees of the Legislature hold periodic joint hearings in
which CTC, Caltrans, and other key implementing entities report on the
use of bond funds and the timeliness of project delivery.
Measures to Streamline and Enhance Project
Delivery
Expeditious delivery of transportation projects is important to meet
Californians’ increasing travel demand and to relieve congestion. The
administration should identify and implement measures to streamline
steps in the project development process, which may reduce state staff
workload and improve delivery times. There are also measures that we
recommend the Legislature adopt to expand the state’s capabilities to
deliver projects. Below, we list a few examples of various strategies.
Design-Build Contracting. The
design-build contracting method awards both the design and construction
of a project to a single entity. The use of design-build to construct
projects seeks to reduce project delivery times by integrating the
design and construction processes. Under SAFETEA-LU, virtually any
transportation project is eligible to be built using this method.
Current state law, however, authorizes the use of design-build only for
specific transportation projects (for example, I-405). Thus, Caltrans
has little experience using this contracting method. While there are
advantages to using design-build, including potential shortening of
project delivery time, there are also pitfalls to avoid.
- We recommend that the Legislature authorize a
design-build pilot program similar to that proposed by AB
143 (Nuñez) in 2006 and SB 56 (Runner) in 2007. Both bills
propose a demonstration program that allows Caltrans and
regional agencies to deliver a set number of projects using
design build. These bills also require that transportation
agencies report on their experiences so that the state can
use the information in deciding whether to pursue future
design-build projects.
Streamlining Environmental Review.
As environmental clearance is typically one of the longest and least
predictable phases of the delivery process, streamlining measures to
minimize redundant steps or uncertainty in the environmental review
phase may offer significant benefits.
- Chapter 31, Statutes of 2006 (AB 1039, Nuñez),
streamlines environmental review by exempting certain
earthquake safety projects from state reporting requirements
and permitting Caltrans to prepare one master environmental
impact report (EIR) for projects on Highway 99, rather than
multiple EIRs for projects along the corridor. The statute
also allows Caltrans to take over federal environmental
reporting duties on a pilot basis through January 1, 2009.
By allowing Caltrans to communicate directly to involved
federal agencies, rather than doing so indirectly via the
Federal Highway Administration staff, the pilot seeks to
reduce project delivery times.
- Caltrans estimates that per-project time-savings gained
from taking over federal reporting duties will range from a
few weeks on the simplest projects to over six months on
large projects requiring a federal EIR. If these estimates
hold, the Legislature may want to extend this pilot for
several more years, subject to federal approval. We further
recommend the Legislature direct Caltrans to identify
additional streamlining measures to improve delivery times
for specific bond-funded programs.
Increase Use of Contracting-Out for
Design Services. Under the State Constitution, Caltrans has the
authority to contract for design and engineering services. To date, the
department has annually contracted out about 10 percent of its design
and engineering work. As Caltrans becomes responsible for the timely
delivery of more projects under Proposition 1B, the department will
likely need a significantly higher level of support resources to deliver
these projects than it currently has. However, it will be difficult for
Caltrans to hire and train within a short time frame the necessary level
of state staff to handle the workload. In order for projects to be open
to users in a timely manner, we recommend the Legislature direct
Caltrans to expand its use of private consultants to deliver projects.
Leveraging Additional Transportation Dollars
While the transportation bond provides a substantial one-time
infusion of state funds for transportation, there is still a
substantial, ongoing funding shortfall in order to provide continuing
capital improvements to meet Californians’ travel demand. In our view,
the state should leverage other fund sources to supplement state
sources.
Public-Private Partnerships.
Public-private partnerships (P3) provide a means to generate private
investment for transportation facilities. These partnerships often take
the form of a state or local government entering into a lease agreement
with a private entity to design, construct, maintain, and operate a
facility for a period of time. The federal act encourages the use of
these partnerships to generate private sector investment in
transportation.
- Chapter 32, Statutes of 2006 (AB 1467, Nuñez), allows
Caltrans and regional agencies to pursue four P3 projects on
goods movement facilities. Because P3s may also work well
for other types of projects, for example highway toll
facilities, we recommend that the Legislature authorize P3
projects around the state on a broader range of facilities.
Encourage Local Investment. Most
urban counties have adopted local option sales taxes with revenues
dedicated to transportation. Because the benefits of transportation
investments are felt most at the local level, the state should encourage
more local investment.
- Proposition 1B provides $1 billion in State-Local
Partnerships (SLP) grants to match local funds for
transportation projects over the next five years. The
measure also allows the Legislature to add conditions and
criteria to the program through statute. The CTC proposed
guidelines that would provide funding to local jurisdictions
that have adopted local sales tax measures or developer fees
for transportation. These guidelines, however, do not set
aside any of these funds to create incentives for new local
revenues to be pursued in the future. In order to spur new
local funding for transportation, we recommend that the
Legislature adopt guidelines that would set aside a portion
of SLP grants for cities and counties that establish new
fees or tax measures for local transportation purposes.
Tolling. In recent years, there
has been a growing public acceptance of charging tolls for road usage,
particularly when tolls can finance new facilities or offer congestion
relief. While many observers have equity concerns regarding access to
tolled facilities across socioeconomic groups, recent research shows
that it is not just high-income travelers who choose to pay a toll when
pressed for time.
- Chapter 32 also authorizes regional agencies, in
cooperation with Caltrans, to create four high-occupancy
toll (HOT) lanes. Given increasing public acceptance of
tolls and the revenue generated by these projects, we
recommend the Legislature authorize Caltrans and the regions
to build additional HOT and toll lane projects.
Funding Highway Maintenance and Rehabilitation
Over the Long Haul
While travel on the state’s highway network continues to increase,
many of California’s highways have surpassed their design life. As a
result, maintenance and rehabilitation costs have grown considerably in
recent years. While Proposition 1B provides some one-time additional
funding for highway rehabilitation projects, it does not address the
long-term issue that maintenance and rehabilitation needs are growing
faster than the revenues which pay for these activities.
Existing Gas Tax Inadequate to
Cover Maintenance and Rehabilitation Costs. Growing
maintenance and rehabilitation demands consume increasing
portions of state gas tax revenues, which traditionally have
been the state’s primary source to fund capacity expansion on
state highways. In its 2006 annual report, CTC projects that
annual gas tax and weight fee revenues are insufficient to
address highway maintenance and rehabilitation needs. This is
because:
- Gas Tax Has Not Increased
in Over a Decade. The current state gas tax rate (18
cents per gallon) has been in place since 1994. Since then,
inflation has eroded the value of per gallon gas tax
revenues by 29 percent, so that 18 cents is worth less than
13 cents today (in constant dollar terms).
- Eroding Revenues.
The figure (see next page) shows that
between 1991 and 2006, travel on California’s roads
increased by an estimated 35 percent. Meanwhile, gas tax
revenues (in constant dollar terms) have not increased. As a
result, revenue generated per vehicle-mile traveled has
declined by more than 20 percent over the period.
Several alternatives are available to the Legislature to increase
maintenance and rehabilitation funding.
- Indexing for Inflation.
We estimate that the current 18 cent per gallon state
gas tax will generate $37 billion over the next ten years.
We recommend that the gas tax be indexed to inflation. Doing
so could generate up to $42 billion from this funding source
over the next decade-$5 billion more than would be generated
if the gas tax was not indexed to inflation.
- Indexing for Fuel Economy.
Similarly, the increasing popularity of hybrid
vehicles could result in a corresponding reduction in gas
tax revenues as total gas consumption declines. For example,
if the increasing market share of hybrid vehicles lead to a
doubling in fuel economy, the Legislature could consider
doubling the gas tax to ensure that total gas tax revenues
remain at their current level into the future.
- Taxing Alternative Fuels.
Many alternative fuels (such as ethanol and natural
gas) are taxed at a lower rate than gasoline and diesel
fuel. Thus, if alternative fuels become a more prevalent
energy source for transportation, the Legislature should
consider taxing these fuels at a comparable rate to
conventional motor fuels to ensure that revenues for uses
like highway maintenance and rehabilitation do not decline.
- Mileage-Based Fees.
Mileage-based fees offer an advantage over gas taxes in that
their revenues are not eroded by increasing fuel economy or
use of alternative fuels. Rather, the fees would closely
match the extent motorists use highways and roads. There are
privacy and technical obstacles to overcome in implementing
a mileage-based approach to fund transportation. However,
the state of Oregon is currently testing the feasibility of
implementing a mileage-based fee in Portland. Similarly, we
recommend that the Legislature examine the policy and
implementation issues that must be addressed if
mileage-based fees were to be imposed in California.
Addressing Issues in the TCRP
In 2000, the Traffic Congestion Relief Act committed $4.9 billion in
General Fund and gasoline sales tax revenues to 141 specified projects
between 2000-01 and 2005-06. Due to the state’s fiscal condition, much
of this funding was delayed or loaned to the General Fund. Current law
extends funding for TCRP through 2007-08 and establishes that most of
the loaned funds are to be repaid by June 30, 2016. Because of the
loans, as well as other delays related to specific projects, there are
TCRP projects that will not be completed until after 2010.
Given this timeline and the problems with a number of TCRP projects,
the Legislature should consider actions such as the following to ensure
that TCRP funds are used effectively.
- Establish Project Delivery
Deadlines. Many TCRP projects have fallen behind
schedule. Current law allows funds to remain available
indefinitely to these projects. The Legislature should
consider directing CTC to establish a final project delivery
deadline in order to ensure that funds are used to construct
projects in a timely manner.
- Identify Projects That Are
No Longer Viable. If there are stalled projects that
are not progressing, the Legislature may want CTC to
identify these projects so that funds may be put to other
projects in the near term.
- Redirecting Funds From
Failed Projects. For projects that miss their
construction deadline or which CTC deems as no longer
viable, the Legislature should redirect remaining TCRP funds
to other transportation projects. The Legislature has a
number of options in how it reallocates the freed-up funds.
Funds could go to projects statewide that offer congestion
relief benefits (in keeping with the goals of TCRP),
projects which are similar in type to the failed project (to
maintain the original level of investment in transit or
highways), or other projects in the original region (to
maintain the level of investment in a single region).
Acronyms and Definitions
AC Transit (Alameda Contra-Costa
County Transit)-The transit authority serving Alameda and Contra Costa
Counties.
BART (Bay Area Rapid Transit
District)-A commuter rail system serving the San Francisco Bay Area.
Caltrans (California Department
of Transportation)-The state agency responsible for building,
maintaining, and operating the state highway and intercity rail system.
CEQA (California Environmental
Quality Act)-State law establishing environmental reporting requirements
that apply to all transportation projects using state funds.
CTC (California Transportation
Commission)-A nine-member board appointed by the Governor to oversee and
administer state and federal transportation funds and provide oversight
on project delivery.
FHWA (Federal Highway
Administration)-The federal agency responsible for administering federal
highway funds.
FTIP (Federal Transportation
Improvement Program)-A three-year list of all transportation projects
proposed for federal transportation funding within the planning area of
an MPO.
ITIP (Interregional
Transportation Improvement Program)-The portion of STIP that includes
projects selected by Caltrans (25 percent of STIP).
HOT lane (High Occupancy Toll
lane)-An HOV lane, which also allows for use by single occupant vehicles
that pay a toll.
HOV lane (High Occupancy Vehicle
lane)-A lane restricted to vehicles with two (and in some cases three)
or more occupants to encourage carpooling.
LACMTA (Los Angeles County
Metropolitan Transportation Authority)-RTPA for the Los Angeles region.
MPO (Metropolitan Planning
Organization)-A federally required planning body responsible for
transportation planning and project selection in the region. In many
cases, is the same as the RTPA.
NEPA (National Environmental
Policy Act)-Federal environmental law establishing environmental
reporting requirements that apply to all projects funded with federal
funds or those requiring review by a federal agency.
P3 (Public-Private
Partnership)-Partnership between state or local government and a private
entity to design, construct, maintain, and operate a transportation
facility for a period of time.
PTA (Public Transportation
Account)-The major state account for transit purposes. Revenues include
a portion of the sales tax on gasoline and diesel fuels.
RTIP (Regional Transportation
Improvement Program)-Share of capital outlay improvement funds
controlled by regional agencies (75 percent of STIP funds).
RTP (Regional Transportation
Plan)-Federally required 20-year plan prepared by metropolitan planning
organizations, updated every three years. Includes projections of
population growth and travel demand, along with a specific list of
proposed projects to be funded.
RTPA (Regional Transportation
Planning Agency)-Planning bodies established by statute to administer
state, local, and federal funds to projects in a region.
SAFETEA-LU (Safe, Accountable,
Flexible, Efficient Transportation Equity Act: A Legacy for
Users)-Federal transportation act covering the period from 2004 through
2009.
SHA (State Highway Account)-The
major state transportation account for highway purposes. Revenues
include the state excise taxes on gasoline and diesel, and truck weight
fees.
SHOPP (State Highway Operation
and Protection Program)-A four-year capital improvement program for
rehabilitation, safety, and operational improvements on state highways.
SIP (State Improvement
Program)-State air quality plan to ensure compliance with state and
federal air quality standards. In order to be eligible for federal
funding, projects must demonstrate conformity with the SIP.
Spillover-A
source of revenue for the PTA, which is equal to the amount that
gasoline sales tax revenues at the 4.75 percent rate exceed the amount
generated from the sales tax on all other goods at the 0.25 percent
rate.
STA (State Transit
Assistance)-State funding program for mass transit operations and
capital projects. Current law requires that STA receive 50 percent of
PTA revenues.
STIP (State Transportation
Improvement Program)-A four-year capital outlay plan that includes the
cost and schedule estimates for all transportation projects funded with
any amount of state funds. The STIP is approved and adopted by the CTC
and is the combined result of the ITIP and RTIP.
TCRF (Traffic Congestion Relief
Fund)-A state account which funds 141 projects specified in the Traffic
Congestion Relief Act (2000). Funded largely through transfers from the
TIF (gasoline sales tax revenues).
TCRP (Traffic Congestion Relief
Program)-The program created to fund 141 projects between 2000-01 and
2007-08, as specified in the Traffic Congestion Relief Act (2000) and
subsequent statute. Funded largely through transfers from the TIF
(gasoline sales tax revenues).
TIF (Transportation Investment
Fund)-A state account which funds projects in STIP and improvements to
local streets and roads, also transfers funds based on formula, to TCRF
(through 2007-08) and PTA. Revenues include state portion of sales tax
on gasoline.
VMT (Vehicle Miles
Traveled)-Common measurement used for tracking demand for driving.
VTA (Valley Transportation
Authority)-The transportation authority serving Santa Clara County.
|
Acknowledgments This report was prepared
by
Kendra Breiland and reviewed by
Dana Curry. The Legislative Analyst's Office (LAO) is a
nonpartisan office which provides fiscal and policy
information and advice to the Legislature.
|
LAO Publications To request publications
call (916) 445-4656. This report and others, as well as an
E-mail subscription service
, are available on the LAO's Internet site at www.lao.ca.gov.
The LAO is located at 925 L Street, Suite 1000, Sacramento,
CA 95814.
|
Return to LAO Home Page