
May 3, 2006
Despite reform attempts, California continues to lag the nation in the collection of child support and in its performance on federal outcome measures. We recommend creating a performance-based system which gives counties the flexibility and financial incentives to meet state-established performance benchmarks. If enacted, our proposed reforms would (1) likely increase the amount of child support collected on behalf of custodial parents and (2) restore accountability to the child support enforcement system.
The primary purpose of the child support enforcement program is to collect from absent parents, support payments for custodial parents and their children. Local child support offices provide services such as locating absent parents; establishing paternity; obtaining, enforcing, and modifying child support orders; and collecting and distributing payments.
Effective January 2000, the Department of Child Support Services (DCSS) was created by the enactment of Chapter�478, Statutes of 1999, (AB 196, Kuehl), and Chapter�480, Statutes of 1999, (SB 542, Burton and Schiff), in order to improve the administration of California�s child support program. (Henceforth, these measures are referred to as the �reforms of 2000.�) This legislation removed the state administration of child support from the Department of Social Services and shifted the local responsibility for collecting child support from the district attorneys� offices to local child support agencies (LCSAs). Most counties formed their own LCSA, however nine small counties joined together to form regional LCSAs. One of the driving forces behind these changes was to improve the program�s ability to collect child support from noncustodial parents.
However, five years into the reform, California lags behind the rest of the nation in collecting child support owed to custodial parents and performs poorly on the majority of federal performance measures. While some argue that the poor performance is due to funding limitations, we find that it is not a primary determinant of performance in this case. Rather, we conclude that the poor performance is primarily due to two factors:
Despite being a county administered program, the program is too tightly controlled at the state level, leading to a lack of investment and ownership in the program by the counties.
Counties face limited fiscal incentives to improve their child support collections performance.
This report offers recommendations for further restructuring the child support program that would help address the continued poor collections performance. It would do this by giving LCSA, the ownership and flexibility necessary to best tailor their programs to fit the needs of their communities and to allow them to maximize child support collections.
Pre-1996 Performance Measure. In 1996, Congress passed and the President signed the Personal Responsibility and Work Opportunity Reconciliation Act. This measure made significant changes in several public assistance programs, including child support. Prior to the passage of the legislation, the focus of the child support enforcement program was to collect child support payments from the absent parent and use part of the collection to offset the government�s costs of welfare grants provided to the absent parent�s family. As an incentive to pursue collections, counties were allowed to keep a portion of the funds they recovered. These incentive payments more than offset the county costs of running the local child support programs. The success of the program was measured at the state level primarily by the amount of child support collected, especially child support payments that went toward reimbursing the state and counties for welfare grants.
New Federal Performance Measures. As required by the federal welfare reform act of 1996, the federal government developed five performance measures and adopted a new performance-based incentive system for the Child Support Program. Unlike the old incentive payment system that focused primarily on collections to offset welfare grant costs, the new system consists of five performance measures, including three collections measures-current support collections, arrearage collections, and cost-effectiveness-and two �input� measures-paternity establishment and support order establishment. These measures are summarized in Figure�1.
|
Figure 1
Federal Performance Measures |
|
Collections Measures |
|
Current Support Collections. The percentage of total current support owed that is collected. |
|
Arrearage Collections. The percentage of cases with arrearages in which some portion of past-due support is collected and paid to the family or the state. |
|
Cost-Effectiveness. Total collections divided by total administrative expenditures. |
|
Input Measures |
|
Paternity Establishment. The state may use either of two specified ways to measure its success in establishing the paternity of all children in its caseload. |
|
Support Order Establishment. The percentage of cases in which there is a support order. |
While child support collection services historically have been available to both welfare and nonwelfare families, most of the emphasis had been on providing those services to welfare families. The introduction of these federal performance measures signaled a fundamental shift in the child support collection program. Instead of focusing on collecting child support primarily on behalf of welfare families, the new program focuses on a range of measures to gauge how well a state is providing child support services, regardless of family welfare status. Success is determined by how well states are able to collect child support for families, regardless of whether or not the families are receiving welfare assistance through the federal Temporary Assistance for Needy Families (TANF) program. As a result, the child support services program has become more of a nonmeans tested social services program that provides services free of charge to any custodial parent, regardless of family resources.
How the Federal Incentive System Works. The exact amount of a state�s incentive payment depends on its level of performance, when compared with other states, and the rate of improvement over the prior year. Along with the new incentive system, states are also required to meet specified levels of data quality. If states do not meet these overall performance and data quality standards, they face federal penalties and sanctions. Likewise, if a state falls below federal minimum standards on certain performance measures such as paternity establishment and current support collections, it faces the potential of federal penalties. In summary, the prior incentive to focus program efforts primarily on families receiving welfare assistance no longer exists under the new incentive system.
As illustrated by Figure�2, assistance collections (welfare cases) have remained virtually flat over the last ten years. (These collections are used to partially offset the governmental costs of welfare or foster care grants.) Conversely, nonassistance collections have tripled over the last ten years to over $1.5�billion. (These collections are provided to nonwelfare recipients for support of the family.) As noted earlier, the primary reason for the growth is a new emphasis on providing child support collection services for any family that requests the service. States� performances are measured on the total amount of child support collected, whether it is for assistance cases or those cases that are not receiving welfare assistance. None of the federal performance measures distinguish between an assistance dollar collected and a nonassistance dollar.
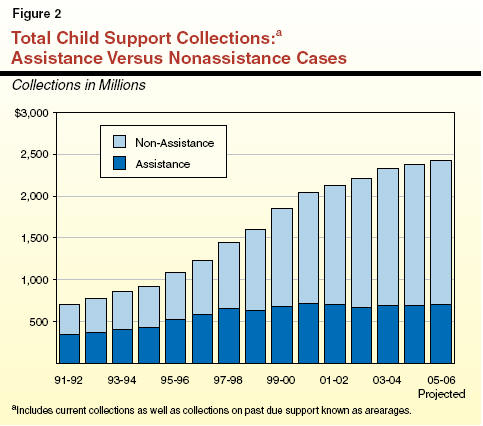
California has historically performed poorly in its attempts to collect child support on behalf of families. In 1992, our office reported that the federal government ranked California 48th among the 50 states in its ability to collect child support, based on 1989 data. This reflected the continuation of relatively weak performance previously seen in the program. (See our analysis entitled �California�s Child Support Enforcement Program�, in our 2002-03 Budget: Perspectives and Issues) As we discuss below, despite attempts to improve the program and significant state and federal reforms, California still hovered near the bottom of the nation for child support collections as of 2004.
As Figure�2 shows, there has been a steady increase in child support collections since 1991-92, with most of the growth being in the nonassistance caseload. Despite the increases, there continue to be reasons for concern with California�s performance.
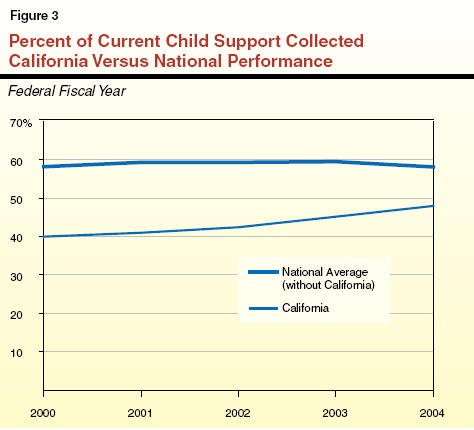
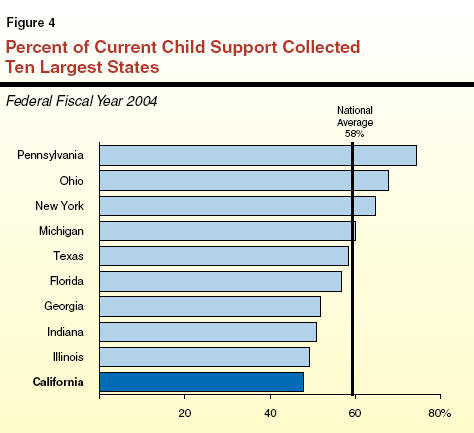
Current Collections. Figure�3 shows that California has made some progress during the last five years in increasing the percentage of current child support which it collects. Nevertheless, in federal fiscal year (FFY) 2004 California collected less than one-half of the child support owed to families. Specifically, of the almost $2.7�billion in current child support owed to families in 2004, California collected just under $1.3�billion (48�percent). While this collection rate exceeded the required federal standard of 40�percent, it fell below the national average performan (58�percent). California�s performance resulted in it being ranked 49th in the nation on this child support measure in 2004. Among the ten largest states, California ranked last on this performance measure in 2004 as shown in Figure�4.
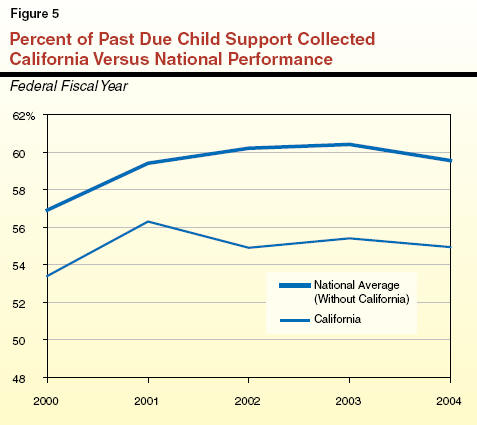
Arrearage Collections. Many noncustodial parents owe back child support that has not been paid. The child support program is required to try to recoup those funds for families and for the government. This measure gauges the number of cases with passed due child support that have had some portion of that balance collected.
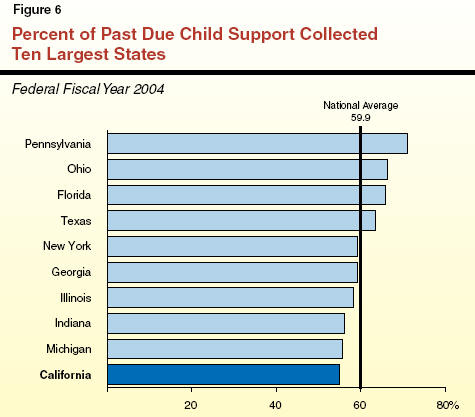
Figure�5 shows that California�s performance in this area has remained fairly constant over the last five years, ranging between 53�percent and 56�percent of cases from which some back child support was collected. Nationally, however, back child support is collected in about 60�percent of cases with arrearages and California ranked 43rd among the 50 states on this measure in 2004. As with the previous measure, the federal government has set 40�percent as the minimum acceptable level. When compared with the ten largest states, California ranked last on this measure in FFY 2004, as shown in Figure�6.
Cost-Effectiveness. This performance measure assesses how much child support is collected for every administrative dollar spent on the program. In other words, it determines a state�s return (in the form of collections) for its investment (administrative expenditures).
During the last five years, California�s cost-effectiveness in running the child support program has declined, while the national performance on this measure has improved, as shown in Figure�7. California�s drop in cost-effectiveness between 2003 and 2004 is due to the state�s investment in the federally required statewide automation system. This is because cost-effectiveness is determined by dividing collections by program expenditures, including automation costs. The state�s added automation costs were not accompanied by higher collections, thus reducing the cost-effectiveness measure. Once the systems have been finally implemented, the cost-effectiveness of the program should improve.
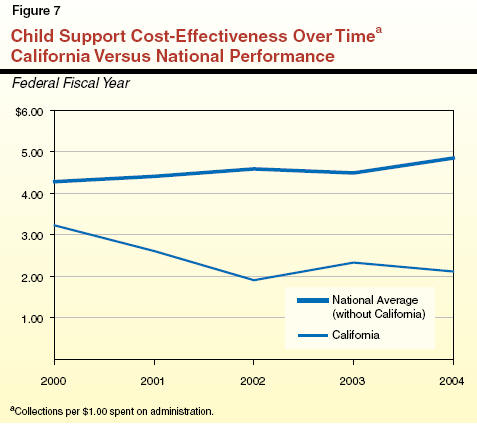
In 2004, California collected $2.12 for every dollar invested in the program, placing it 49th out of 50 states on the cost-effectiveness measure. Other large states, such as Indiana and Pennsylvania collected between $7 and $8 for every dollar invested in their programs, as shown in Figure�8. The national average in 2004 was $4.38 collected for every dollar spent. Without California, the national average rises to $4.85. The federal government has set $2 as the minimum acceptable level of cost-effectiveness.

Unlike the previous measures, which assess the actual collection of child support, California has had more success with the two input measures. These measures focus on setting up cases appropriately by determining a child�s paternity and getting an actual child support order in place.
California ranks at the top of the nation in establishing paternity for every child in its program. Along with paternity establishment, California has also done well in establishing child support orders. Of all of the cases in its child support program, California has managed to establish support orders for about 78�percent of cases. (Please see Appendix A for performance information by state.)
As there are differences in performance among states, there is significant variation among California�s counties on the federal collection performance measures. We reviewed the performance of the ten largest counties, accounting for 71�percent of the state�s child support caseload. We found that, Alameda and Fresno Counties consistently lead the other large counties in collections performance. Los Angeles, which accounts for the largest share of the state�s collection caseload (26�percent), consistently scores below most of the other large counties on the collection performance measures. Also, the fact that one county performs well on one measure is not a predictor that it will perform well on all measures. For example, while San Bernardino County is the highest in the state on the cost-effectiveness measure, it performs below the statewide average on the other two measures. Conversely, Santa Clara County does not do well on the cost-effectiveness measure, but performs near the statewide average on the other two.
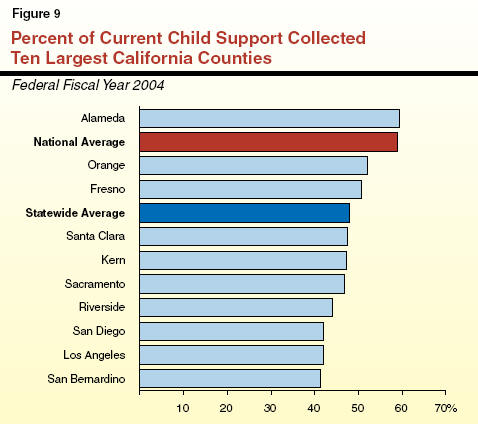
Current Collections. Figure�9 ranks the ten largest counties in terms of their performance collecting child support payments on current support orders. Alameda leads the ten counties by collecting almost 60�percent of the payments owed on current child support orders. Conversely, San Bernardino falls behind the other counties by collecting only 41�percent of the money owed on current orders in that county.
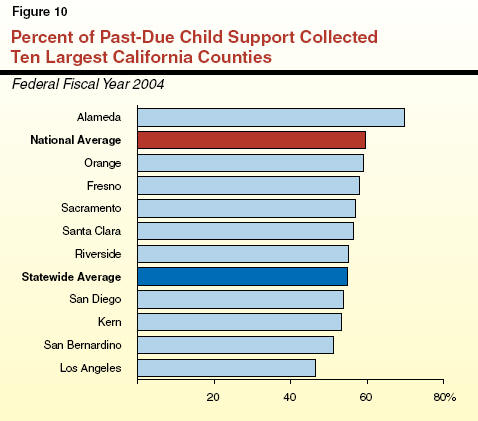
Cases With Collections on Arrears. Figure�10 ranks the ten largest counties on the number of cases with some collections on past due child support. Similar to current support collections, Alameda outperforms the other counties with collections for 70�percent of the cases with arrearages and Los Angeles trails the other counties with collections for 47�percent of the cases.
Cost-effectiveness. Finally, Figure�11 illustrates cost-effectiveness levels for the ten largest counties. For 2004, San Bernardino is the most cost effective county in this group. In contrast, Santa Clara trails the other large counties collecting $2.46 for every dollar spent in the program. During 2004, the cost-effectiveness average for all 58 counties is $2.60.
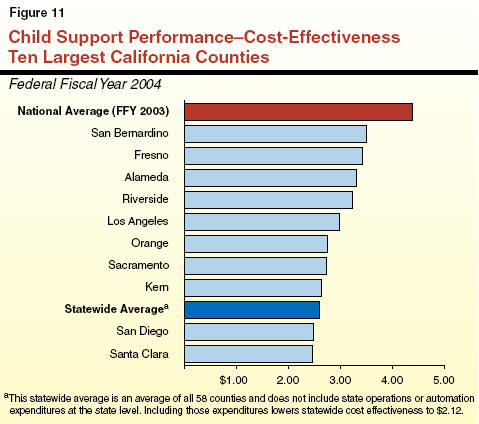
Preliminary FFY 2005 Performance Data. At the time this report was published, preliminary data on California and county performance for FFY 2005 was becoming available. However, data from other states was not available. Our review of the preliminary data for FFY 2005 suggests that California has continued its recent trend of slight year-over-year improvement on federal collection measures, but is likely to remain well below national averages. As regards current and past due collections, county performance in 2005 is generally similar to performance in 2004. However, as regards cost-effectiveness, Riverside County is now the leader among the ten largest counties.
As indicated earlier, California enacted significant changes to the child support program in 2000. At the state level, the key change was the establishment of a new department to oversee the child support program. At the local level, the most significant change was the shift of responsibility for carrying out the program from the local district attorney�s office to a new county department for child support services. Despite these changes, California has not experienced significant improvements in child support program performance. We believe there are three reasons for this. First, although, overall funding per case in California is high compared to other states, in certain counties low allocations may be contributing to poor performance and collections. Second, in an attempt to reform the program in 2000 the state may have swung the pendulum too far in the direction of state control. Instead of having a program that leaves the responsibility for the collection of child support at the local level, the state created a program of tight state control that provides little flexibility at the local level. Finally, the previous state incentive program for counties has been jettisoned in favor of a program that provides minimal fiscal incentives for counties to run an effective program. Below, we explore how these factors have contributed to poor levels of child support collection.
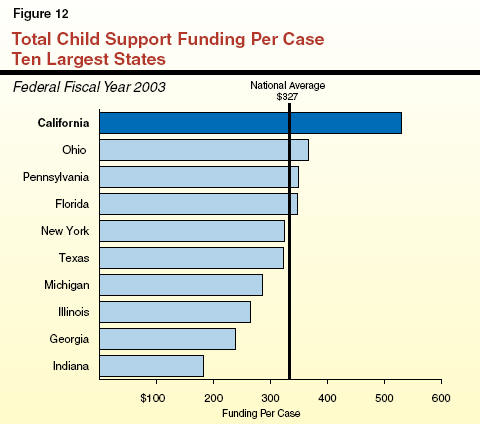
The child support program is funded through a combination of federal and state funds. California spends from this combined source of funding significantly more per child support case than virtually any other state in the nation. For example, among the ten largest states in FFY 2003, California spent $529 per child support case while the next closest state was Ohio, which spent $366 per case, as shown in Figure�12. At $324 per case, New York, another high cost-of-living state, spent slightly less than the national average of $327. All of the ten largest states, except Illinois, outperformed California in collecting child support from current cases, while spending considerably less to do so than California. Thus, statewide funding does not appear to be a significant factor contributing to California�s weak performance. (Please see Appendix A for total funding per case by state.)
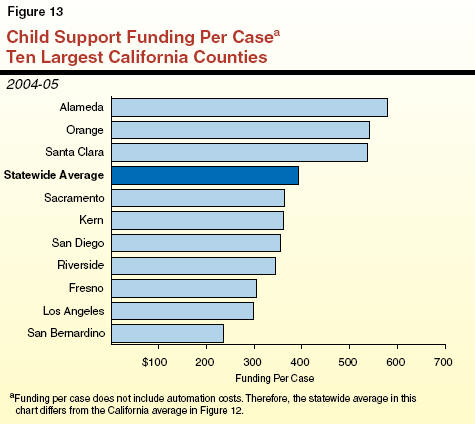
Wide Variation in Funding. The statewide average funding per case (excluding automation costs) in 2004-05 was just under $400 per case. However, funding varied widely, from a high of $1,021 per case in Marin County (104�percent above the statewide average) to a low of $236 per case in San Bernardino County (53�percent below the statewide average). This is because county allocations are based on prereform program costs and collections. Some district attorneys designate significant resources to child support while others did not. Figure�13 shows the variation in the funding per case for the ten largest counties in California. (The funding levels in this chart, unlike the national charts presented earlier, do not include automation costs.) As the figure shows, funding ranges from $580 per case in Alameda County to $236 per case in San Bernardino County. Even among counties of similar size and location, the variation in funding exists. For example, Orange County was funded at $542 per case, while San Bernardino spent $236 per case.
Is There a Relationship Between Low Spending and Weak Performance? Our review finds mixed results statewide when correlating funding and county performance. Some low-allocation counties are poor performing counties. On the other hand, some low-allocation counties perform well. For example, six of the ten lowest allocation counties are among the better performers in the state (above average on at least four out of five measures).
Figure�14 shows funding and performance for the ten largest counties. As with the other 48 counties, these counties show a mixed bag in terms of performance. The two higher allocation counties, Alameda and Orange, are performing well and the two lowest funded counties, Los Angeles and San Bernardino, are struggling with their performance. At the same time, Fresno, one of the lower funded counties, is managing to perform at or above the statewide average in all five performance measures.
|
Figure 14 Child Support—County Funding and Performance |
||
|
2004‑05 |
||
|
Ten Largest Counties |
Funding |
Performancea |
|
Alameda |
$580 |
5 |
|
Orange |
542 |
5 |
|
Santa Clara |
536 |
3 |
|
Sacramento |
364 |
2 |
|
Kern |
361 |
3 |
|
San Diego |
354 |
2 |
|
Riverside |
345 |
2 |
|
Fresno |
305 |
5 |
|
Los Angeles |
299 |
1 |
|
San Bernardino |
236 |
1 |
|
|
||
|
a Number of federal measures at or above statewide average. |
||
Overall, our conclusion is that some lower funded counties tend to have a harder time collecting child support. But the data are not definitive because some low allocation counties excel in their performance. Because of the mixed results associated with county funding and performance, we conclude that program funding is not the primary driver of performance or collections, but low funding may prove to be a barrier for some counties. Our discussions with LCSA directors further supports this finding.
Counties no longer have much of a fiscal stake in the child support program. Previously, counties were able to retain 13.6�percent of all of the child support they collected. Those funds were used to offset the county share of cost of the program and any remaining funds could be used for other county purposes. This financial arrangement provided a strong incentive for counties to maximize their child support collections.
Currently, counties have only a minimal incentive to improve performance. Under current state law, counties have no share of cost in running the program as those expenses are paid by the state and federal government. (In 2004-05, the costs totaled almost $1�billion.) Counties do retain 2.5�percent of the collections made on behalf of welfare assistance cases. Most counties use these funds to offset a portion of the county welfare departments� costs associated with the California Work Opportunity and Responsibility to Kids (CalWORKs) grants provided to the families of the absent parents. However, since local child support agencies are not part of the welfare departments, they do not have any significant fiscal ties to the program or incentives to maximize collections in order to offset welfare grant costs. Unless county boards of supervisors make child support enforcement a priority, the LCSA directors have limited incentive to do so. Moreover, there is no county fiscal benefit from increasing collections on the faster growing nonassistance cases, which represent about 75 percent of the caseload.
In addition, the federal performance measures have provided little fiscal incentive for most counties to improve performance. As described earlier, improvement on federal performance measures relative to other states increases California�s share of the federal incentive allocation. Although the state receives a fiscal benefit from improved performance, the counties do not share in this benefit. County performance on the federal measures is published, but a county�s performance does not impact its allocation of state and federal program funds.
Later in this report we make recommendations to create an alternative structure that will address this problem. We believe that a lack of fiscal incentives has contributed to California�s poor record in collecting child support despite the state spending significantly more per case than other states on those collection efforts.
The reforms of 2000 provided the director of DCSS with a unique level of control over the program. Prior to the 2000 reforms, many concluded that part of the failure of the child support program was due to a lack of coordination and integration between the state and local child support agencies. It was also noted that there was a lack of strong state leadership in the program. To correct these perceived weaknesses, the enabling legislation gave the state director �direct oversight and supervision� of the child support operations. This resulted in local child support agencies being required to report and respond to the state director on all aspects of the child support program.
This centralized level of direct state control and responsibility for local programs has led to an inflexibility that works against counties structuring their programs in the best ways to meet local needs. A primary example of this can be seen in Los Angeles County. Because of its poor performance, Los Angeles was placed in corrective action status. The first phase of the corrective action was for the county to work with the state in developing a program improvement plan. Central to the plan for Los Angeles was the goal to improve its collections for current child support orders. In an effort to make that improvement, the Los Angeles LCSA received permission from its county board of supervisors to shift staff and resources from its child support call centers to collections activities. Despite the decision of the county board of supervisors, the state director did not allow Los Angeles County to shift those resources, thereby making it difficult for the county to meet its required improvement goals. Similar to Los Angeles County, our discussions with the county child support directors association suggest that counties often do not have the authority to structure their programs in ways that best fit the needs of their caseload and community.
Minimal fiscal incentives, lack of local program control, and perhaps the lack of federal and state resources in some counties have contributed to poor child support enforcement performance. Although the state is ultimately responsible to the federal government for the performance of the program, there are virtually no fiscal consequences for the local child support agencies if they perform poorly. Moreover, the state has no effective means of encouraging local child support agencies to improve their collections. Counties may attempt to excuse their poor performance by claiming lack of resources, control, or fiscal incentives. Each level of government blames the other for weak performance, resulting in a lack of accountability to the Legislature.
The Legislature has several options for altering the child support collections program in order to improve collection efforts, as we discuss below.
One alternative would be to shift operation of the child support program from the county to the state, thereby clearly making the state rather than the counties responsible for the programmatic and fiscal decisions that affect program performance. State control would increase accountability by eliminating the ability for state and local officials to blame each other for weak performance in the program. Further, the state is required to create and operate a single statewide automation system, which is required to integrate the data and automation needs of the LCSAs. There may be some data and automation efficiencies created with a state-level program which would not be required to incorporate specific county needs. Finally, this option would eliminate duplication of personnel and activities between the state and counties.
For these reasons, it might make sense for the state to assume full responsibility for the child support program. On the other hand, creating a state run child support program significantly reduces responsiveness to local communities and does not allow the program to be tailored to best serve the needs of diverse local populations.
On August 3, 2004, the California Performance Review (CPR) released its report on reforming California�s state government, with the aim of making it more efficient and more responsive to citizens. In the area of child support, the report noted many of the concerns expressed by the Legislature over the last several years. It found that the state continues to perform below the national average on several key federal performance measures, funding for the program appears to be high when compared with the rest of the nation, and, finally, counties have virtually no fiscal investment in the program and therefore have little incentive to improve their performance. In response to these concerns, CPR recommended abolishing the local child support agencies and having the state contract out the collection of child support to either private companies or local governmental entities. Counties would no longer be involved in the collection of child support unless they successfully bid for their local contract.
Privatization as proposed by CPR raises two significant concerns. First, it is uncertain that the state would be able to complete and successfully operate the federally required statewide automation system in a locally privatized environment that allows local entities to compete for the opportunity to run the child support enforcement program. Secondly, in order to privatize the program, the state would need to be able to find local entities with the ability and willingness to bid on the entire array of child support services. These functions would include everything from (1) working with hospitals and parents to establish paternity, (2) providing a grievance process for clients and (3) working with financial institutions to seize bank accounts and assets.
We recommend creating a performance-based, county run program that: (1) allows the counties the flexibility to structure their own programs, (2) requires counties to fund a share of the costs for the program, (3) rewards them for good performance on federal performance measures, and (4) provides a funding mechanism to assist those counties which may need additional resources to improve their performance.
The child support program is well suited for shifting primary program control to the local level, in conjunction with the establishment of appropriate incentives and accountability measures. Such a shift in control would provide counties with substantial flexibility to shape their own programs in order to meet the specific needs of their population and achieve expected performance levels. Along with the increased flexibility, counties would be held accountable for their performance. Utilizing the performance measures in this way would ensure continued state involvement and the opportunity for strong state leadership, without excessive and unnecessary control placed in the hands of the state.
As shown in Figure�15, we recommend allowing flexibility for program structure at the local level, establishing a county share of costs for the program, rewarding counties for their performance, and creating a funding structure to assist lower-funded counties. We believe that this approach will provide a better mix of responsibility, flexibility, and incentives for counties to improve their performance in the collection of child support. As a result, the state�s overall performance should improve and California should receive a larger share of federal incentive funding while at the same time recouping more child support collections.
|
Figure 15 LAO Approach to
Improving |
|
|
|
» Allow counties the flexibility to structure their programs to best suit the needs of their communities. |
|
» Create a county share of costs. |
|
» Establish an incentive program that rewards counties for good performance on federal performance measures. |
|
» Provide a loan program that allows under-funded and underperforming counties the funds necessary to improve their performance. |
|
»
Require state takeover of low performing |
We recommend that counties be given the flexibility to develop local programs that best allow them to meet their local needs. This flexibility, much like that given to counties in other social services programs, would allow each county to target their resources on projects and in performance areas that would best improve the county�s overall collection of child support. This would eliminate difficulties like those mentioned earlier regarding Los Angeles County.
Flexibility would also provide local child support agencies with the freedom to implement innovative programs and develop best practices for collecting child support that then can be shared with other counties.
We understand that there might be some concern with relinquishing this level of control over the child support program. Under the current federal performance requirements, the state as a whole is expected to perform at certain levels and is held accountable for the success or failure of the program through fiscal incentives rewarding performance and penalties for unacceptable performance. However, making counties accountable for their performance through the right mix of fiscal incentives and financial rewards (as discussed below), could relieve the state of the need to place such strict controls on the counties. Under a county run program, the state would be responsible for reviewing the performance data submitted by the counties on a regular basis and determining whether they were performing at an acceptable level.
If counties are provided greater flexibility in administering the program, they should also bear some responsibility for the decisions they make in carrying out the program. One way to ensure that counties bear more responsibility for the success of the child support program is to give them a fiscal stake in it through a share of program costs. Such a share of costs would provide counties with a fiscal incentive to ensure that funding is spent carefully and targeted toward activities that improve the collection of child support.
Avoiding a State Mandate. Under current law, if the state mandates that counties perform new activities or provide a higher level of service, it generally is required to reimburse counties for those costs. We recommend taking two steps to avoid the creation of a state mandate. First, we recommend creating an optional program, which would give the counties a choice of whether or not to participate, rather than requiring participation. This would require approval from county boards of supervisors in order for counties to participate. Because the program is optional, there would be no mandate. We do emphasize, however, that in order for this program to function correctly, the program needs to be structured so that once counties opt in they cannot decide to opt out before a defined time period expires without the consent of the state director. Otherwise, counties would have the opportunity to opt in or out of the program whenever it suits them, thereby reducing the state�s ability to use funding levels as a true incentive to improve performance.
Second, in order to provide an incentive for counties to participate in the new share of cost program, we recommend offering them offsetting fiscal relief. This would allow them to shift county general fund to the child support enforcement program with no overall net increase in county general fund costs. Such relief could be provided by reducing the county share of another social services program for those counties that opt into the county share for the child support program. Alternatively, the relief could be provided as a direct subvention of funds to the counties, adjusted for inflation.
We further recommend that counties that opt not to participate in the county share program retain essentially the current program requirements. These counties would not be eligible to participate in the county loan program or be eligible for financial incentives outlined later in this report. At the same time, we recommend that these counties be required to improve their performance within a specified time frame if they fall under the statewide average, just as other poor performing counties will be required to improve their performance. Should any county fail to improve after a specified period of time, we recommend a state takeover of the local program, unless the state director finds extraordinary, extenuating circumstances that justify leaving the program at the local level. This action would require statutory authorization.
Although current law contemplates an incentive system to reward counties for their performance, no such system has been implemented because of the state�s difficult fiscal situation. We recommend implementing an incentive system that rewards counties for good performance. The incentives would be provided in the form of additional state and federal child support program funds, or potentially additional federal incentive funds.
Legislature to Set Performance Standards. Under our approach, the Legislature would set the magnitude of the incentive program, the funding source for the incentive payment, and the outcomes which counties would have to meet in order to earn the incentive. In developing the system, we recommend that the Legislature establish benchmarks, such as the national average for collections per case, for measuring performance and reward those counties that perform above that level. In our view, the Legislature should consider an incentive amount that is between 5�percent and 15�percent of total state and federal funds allocated to counties. It is important that the incentive be generous enough to encourage counties to invest in improving their child support performance.
Maximize County Flexibility. As noted above, the incentives would be a combination of General Fund dollars, federal child support matching funds, and federal incentive funds. To increase the attractiveness of the incentive, we recommend that counties be given maximum flexibility in using their earned incentives. Specifically, counties could (1) use the General Fund portion of their incentive to reduce their county cost share, resulting in a county savings, (2) reinvest the state and federal funds into their program, or (3) invest federal incentive funds in other programs which contribute to the effectiveness of the child support enforcement program. With regard to this latter option, the expenditures for �other� programs must be approved by the federal Secretary of Health and Human Services. To date, the secretary has approved job programs for noncustodial parents. Other potential programs that the Secretary could approve include preventive child welfare services designed to keep families together.
As discussed earlier, our analysis of the data show that some lower-funded counties tend to have a harder time collecting child support. However, the evidence is not definitive. Because lower funding may be affecting some counties� ability to collect child support, it would make it difficult for the state to demand improvements in performance without finding some way to increase those counties� overall funding levels. It is important for counties to be able to have access to enhanced funding, if indeed that is a barrier for improving their performance. Toward that end, we recommend creating a loan program for those counties that are willing to accept a share of cost, plus increase their own funding investment in the child support program.
We suggest a loan program whereby counties which invested additional county funds in their program would then have their funds matched by additional state funds at a two (state) to one (county) ratio. The combined additional state and county funds would then draw down federal funds at a three to one ratio. Every dollar invested by a county would be matched with an additional $2 from the state and $6 from the federal government. Therefore, a relatively modest investment of $50,000 by a county would be matched with $100,000 from the General Fund. That $150,000 would draw down an additional $450,000 from the federal government for a total increase of $600,000.
Along with this enhanced funding, however, the state and the county would negotiate expected levels of improvement and a time frame for meeting the statewide acceptable levels of performance. If a county meets those expectations, their loan would be forgiven. However, should a county fail to improve sufficiently using the enhanced investment, that county would be required to pay back the additional General Fund invested in their program. This aspect of our recommendation would address the county under-funding issue that we described earlier by ensuring that under-funded counties have access to enhanced funding to improve their performance while holding harmless the more generously funded counties. In order to protect the General Fund, total loan authority could be limited by statute and would be subject to annual appropriation.
As discussed earlier, under current law, the state department has the ability to place counties in a corrective action status should they fail to perform adequately on the federal performance measures. This is a three step process with the third step being a state takeover of the program. Our review has found that despite low performance on the part of many counties, the department has placed only two of the largest counties in corrective action status. Moreover, the state has never taken control of any county. Under our proposal, we recommend replacing the discretionary corrective action plan in current law with a requirement that the state take over local child support programs if those programs consistently fail to meet agreed upon performance improvement targets. These takeover provisions would apply regardless of whether counties enter into our proposed state/county sharing arrangement unless the director makes a written finding of extenuating circumstances. In other words, we recommend that statute express strong interest for a state takeover in the event of continued weak performance.
Under our approach, the state department�s emphasis would move away from developing and monitoring corrective compliance plans for weak performing LCSAs. Instead, state officials would monitor LCSA performance through data collection, provide incentives to LCSAs which achieved required results, and negotiate performance-based loan agreements. The department would continue its role in operating the statewide automation system and making required federal reports. If our approach is adopted, the Legislature should review the state department�s staffing levels and resources to make sure it is commensurate with its revised responsibilities.
Funding for Child Support Administration. For 2005-06, the total budget for local administration of child support enforcement (excluding automation and data processing costs) is $730�million. In general, child support program costs are shared 66�percent federal and 34�percent state. This $730�million is allocated to local child support agencies in order to operate the child support enforcement program. In addition, California is expected to earn $47�million in federal incentive funds in 2005-06. Federal incentive funds may be spent on the child support program or other programs which contribute to the effectiveness of child support enforcement.
Estimated Fiscal Impact. The costs and savings for the LAO approach would depend on the magnitude of the specific components adopted by the Legislature. For purposes of illustration, the fiscal analysis presented below assumes (1) an incentive program with funding equal to roughly 5�percent ($37�million) of administrative funds allocated to local agencies for child support enforcement; (2) a loan program with a total of $22.5�million in combined federal ($15�million), state ($5�million), and county funds ($2.5�million); and (3) a 5�percent improvement in performance due to the various reforms. Under our approach, the state and federal governments would invest a total $57�million in the incentive and loan programs. Based on this investment we believe that a 5�percent improvement in performance is a reasonable assumption. Based on these assumptions, Figure�16 shows that the direct net General Fund impact of the LAO approach would be an annual cost of about $1.6�million.
General Fund Costs. General Fund costs are estimated to be $17.6�million, with $5�million for the loan program and $12.6�million for the incentive program. The loan program assumes county participation of $2.5�million, $5�million from the General Fund, and $15�million in federal matching funds. The incentive program would be supported with a combination of $12.6�million from the General Fund and $24.4�million in federal funds.
General Fund Revenues. We estimate that an incentive program equal to approximately 5�percent of current county allocations, in combination with a loan program for self-identified under-funded counties, would increase child support collections by about 5�percent. Because the state share of assistance collections is retained by the state as General Fund revenues, we estimate a $16�million increase in revenues.
Other Non-General Fund Benefits. The net fiscal impact described above reflects only the direct effect on the General Fund. However, as shown in Figure�16, there are $87�million in other indirect benefits which would result from our approach. First, an increase in state performance would lead to an increase in federal performance incentive funds. Although the exact amount of the federal incentive increase would depend on California�s performance relative to other states, an increase of $5�million in federal incentives appears reasonable. These federal incentive funds must be spent on chld support enforcement, or improving enforcement efficiency. Pursuant to the federal Deficit Redaction Act of 2005, these funds may not be used to offset General Fund costs. Second, a 5�percent increase in child support collections would result in an additional $77�million going directly to California�s custodial parents and their children. Providing additional child support for those families may prevent them from needing to apply for other income support programs such as CalWORKs. Thus, an increase in child support could indirectly save the state TANF and General Fund dollars. However, the extent to which increased child support collections keeps families self-sufficient, and without need for public assistance, is difficult to measure. Therefore, the exact amount of the additional benefit to the state cannot be estimated.
|
Figure 16 LAO Child Support Reform Plan Fiscal Impact |
|
|
(In Millions) |
|
|
General Fund Costs and Revenues |
Amount |
|
General Fund Costs |
|
|
Loan program |
$5.0 |
|
12.6 |
|
|
General Fund Revenues |
|
|
Increased assistance collections |
-$16.0 |
|
Net General Fund Cost |
$1.6 |
|
Other Non-General Fund Benefits |
Amount |
|
Increase nonassistance collections |
$77.0 |
|
Increase federal performance incentives |
5.0 |
|
Total |
$82.0 |
Despite previous reform attempts, California continues to lag the nation as a whole in the collection of child support for families. The state�s performance remains at or near the bottom of the nation in three key performance measures. Creating a performance-based program and allowing counties the flexibility to structure their child support programs to best suit the needs of their communities should lead to significantly improved performance. Further, it is critical that counties be given a fiscal stake in the program to further ensure that performance on the federal measures remains a priority throughout the state. While there are some General Fund costs associated with adopting the reforms outlined in this report, those costs could be significantly offset by increased federal incentive funding, and increased assistance collections.
The proposed approach would restore accountability to the child support system. Counties could no longer argue that they lack necessary program control, resources, or incentives to improve.
|
Appendix A State by State Funding and Performance |
||||||
|
2004 |
||||||
|
States |
Caseload |
Percent of |
Percent of Current |
Percent of Cases With an Arrears Collection |
Cost |
Expenditures Per Case |
|
Alabama |
248,624 |
73.05% |
51.26% |
50.00% |
$3.95 |
$258.36 |
|
Alaska |
46,387 |
86.82 |
55.49 |
66.63 |
4.50 |
467.43 |
|
Arizona |
258,871 |
68.80 |
42.68 |
50.50 |
4.42 |
227.90 |
|
Arkansas |
128,472 |
79.87 |
55.34 |
57.40 |
3.88 |
371.10 |
|
California |
1,838,497 |
78.13 |
47.96 |
54.94 |
2.12 |
528.92 |
|
Colorado |
138,117 |
84.73 |
55.51 |
64.93 |
3.55 |
521.79 |
|
Connecticut |
212,823 |
67.63 |
54.54 |
55.02 |
3.20 |
278.52 |
|
Delaware |
55,198 |
72.05 |
60.29 |
64.30 |
3.01 |
414.86 |
|
Florida |
663,863 |
70.03 |
56.75 |
65.75 |
4.50 |
347.39 |
|
Georgia |
480,935 |
71.13 |
51.88 |
59.12 |
4.67 |
237.22 |
|
Hawaii |
99,431 |
58.66 |
53.09 |
42.84 |
8.70 |
161.69 |
|
Idaho |
88,005 |
78.55 |
55.68 |
56.46 |
5.94 |
225.76 |
|
Illinois |
724,383 |
51.50 |
49.25 |
58.22 |
3.22 |
264.70 |
|
Indiana |
301,473 |
70.54 |
51.04 |
56.19 |
7.04 |
181.92 |
|
Iowa |
175,180 |
86.96 |
62.18 |
66.12 |
5.59 |
293.61 |
|
Kansas |
134,321 |
73.00 |
54.38 |
62.30 |
3.15 |
372.87 |
|
Kentucky |
313,652 |
75.85 |
54.70 |
51.34 |
5.95 |
194.48 |
|
Louisiana |
272,341 |
71.29 |
55.93 |
58.53 |
5.04 |
209.61 |
|
Maine |
64,292 |
90.31 |
56.57 |
59.75 |
4.35 |
320.95 |
|
Maryland |
312,744 |
73.77 |
61.79 |
62.10 |
4.57 |
310.59 |
|
Massachusetts |
246,550 |
74.42 |
62.64 |
58.81 |
4.88 |
331.60 |
|
Michigan |
1,041,056 |
74.96 |
60.21 |
55.60 |
5.42 |
285.33 |
|
Minnesota |
244,655 |
81.00 |
69.53 |
66.00 |
4.10 |
582.63 |
|
Mississippi |
301,564 |
52.13 |
52.79 |
58.22 |
7.96 |
81.72 |
|
Missouri |
383,799 |
80.70 |
53.33 |
51.59 |
5.40 |
240.02 |
|
Montana |
40,983 |
85.25 |
58.40 |
63.53 |
3.94 |
350.59 |
|
Nebraska |
97,589 |
78.92 |
67.37 |
64.62 |
3.63 |
485.33 |
|
Nevada |
118,319 |
59.78 |
51.11 |
51.44 |
3.31 |
336.58 |
|
New Hampshire |
38,015 |
80.98 |
64.54 |
71.83 |
5.27 |
476.79 |
|
New Jersey |
344,831 |
79.63 |
64.92 |
63.34 |
4.89 |
493.69 |
|
New Mexico |
69,611 |
53.92 |
49.42 |
61.22 |
1.87 |
615.58 |
|
New York |
886,813 |
80.15 |
64.75 |
59.08 |
4.31 |
323.78 |
|
North Carolina |
417,936 |
78.85 |
62.72 |
61.02 |
5.01 |
257.59 |
|
North Dakota |
38,776 |
86.59 |
72.02 |
67.35 |
5.37 |
300.34 |
|
Ohio |
915,211 |
71.58 |
67.88 |
66.34 |
5.46 |
366.39 |
|
Oklahoma |
137,115 |
69.54 |
48.60 |
57.51 |
3.64 |
368.09 |
|
Oregon |
247,388 |
67.48 |
59.29 |
61.19 |
6.17 |
213.73 |
|
Pennsylvania |
590,935 |
84.05 |
74.37 |
70.97 |
7.01 |
348.18 |
|
Rhode Island |
67,923 |
52.53 |
61.92 |
58.94 |
5.01 |
181.47 |
|
South Carolina |
218,855 |
71.17 |
48.39 |
49.21 |
7.00 |
176.97 |
|
South Dakota |
42,546 |
93.73 |
68.29 |
68.76 |
7.49 |
176.18 |
|
Tennessee |
358,754 |
63.92 |
54.71 |
59.17 |
5.16 |
195.04 |
|
Texas |
897,038 |
79.83 |
58.54 |
63.54 |
5.95 |
321.79 |
|
Utah |
75,459 |
85.25 |
59.82 |
65.20 |
4.08 |
472.62 |
|
Vermont |
24,233 |
88.08 |
66.12 |
70.39 |
4.22 |
489.14 |
|
Virginia |
349,573 |
83.54 |
60.04 |
57.42 |
6.33 |
226.17 |
|
Washington |
315,393 |
89.69 |
62.87 |
67.17 |
4.52 |
444.61 |
|
West Virginia |
109,936 |
82.82 |
62.85 |
58.86 |
4.42 |
333.60 |
|
Wisconsin |
340,963 |
81.92 |
67.64 |
64.26 |
5.91 |
294.92 |
|
Wyoming |
37,750 |
88.33 |
60.79 |
64.11 |
5.16 |
249.00 |
|
|
||||||
|
Source: Administration for Children and Families, U.S. Department of Health and Human Services. |
||||||
|
Acknowledgments This report was prepared by Julie Salley-Gray and reviewed by Todd Bland. The Legislative Analyst's Office (LAO) is a nonpartisan office which provides fiscal and policy information and advice to the Legislature. |
LAO Publications To request publications call (916) 445-4656. This report and others, as well as an E-mail subscription service, are available on the LAO's Internet site at www.lao.ca.gov. The LAO is located at 925 L Street, Suite 1000, Sacramento, CA 95814. |