January 2005
Following the boom-bust revenue cycle in recent years, concerns have developed about volatility in California's General Fund revenues. This brief quantifies the amount of revenue volatility experienced in California during the past quarter century, identifies the main causes of the volatility, and discusses the outlook for volatility in the future. We also highlight some options for reducing future impacts of volatility—both those involving changes to the tax system and budgetary changes—and discuss the trade-offs inherent in each of the alternatives.
California's system of taxes that supports the General Fund has been in place for many years. Its main elements—the personal income tax (PIT), sales and use tax (SUT), and corporation tax (CT)—were established over half a century ago. The system has performed relatively well through most of the intervening period and has generally received good marks from economists and public finance experts. For example, it is diversified and relatively broad-based, thereby ensuring that all types of individuals, businesses, income, and economic activity contribute to the financing of public services. It also provides revenues that increase over time in response to growth in the state's population and economy, thus helping ensure that the state can fund the public services that demographic growth requires, such as education and infrastructure.
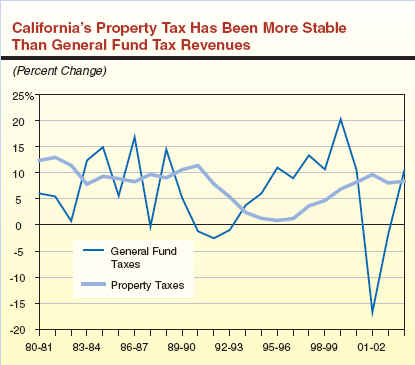
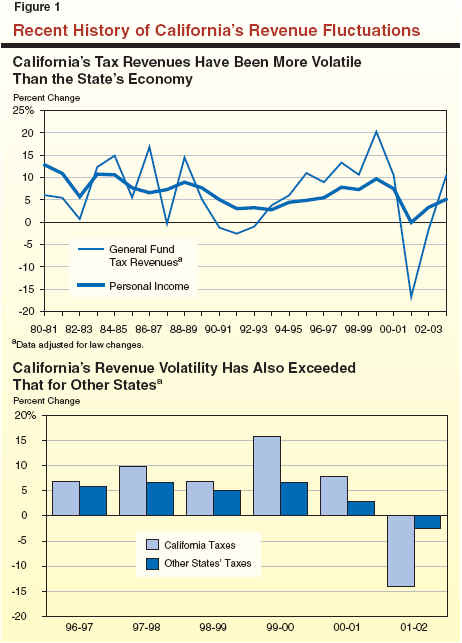
Despite its generally positive features, there are certain areas where California's tax system could benefit from reforms, such as those making it more reflective of the state's modern economy and more neutral with respect to its effects on economic decision-making. One particular concern which has emerged in recent years is the current system's relatively high degree of volatility. As shown in Figure 1, annual fluctuations in General Fund taxes have been quite significant. These fluctuations have been considerably more pronounced than the volatility in California's overall economy, and more substantial than the revenue fluctuations experienced in other states. This revenue volatility has contributed to major problems for state policymakers attempting to manage and balance California's state government budget. This has been particularly true during the past five years, when General Fund revenues increased by as much as 20 percent in 1999-00 but then plunged by a dramatic 17 percent in 2001-02.
Given its significance, this report focuses on the revenue volatility issue. In it we define and quantify the amount of revenue volatility California has actually experienced, identify and discuss the main factors contributing to this volatility, and examine the key policy options available to the Legislature for dealing with such volatility in the future.
As noted above, revenue volatility in broad terms refers to fluctuations over time in tax receipts. Actually, however, there are a number of different characteristics and dimensions that such revenue fluctuations can have, which in turn can determine both the challenges volatility poses for policymakers and the best options for dealing with it. These factors include:
Given the above, revenue volatility—though perhaps simple in concept—is in reality a multi-dimensional and often complex phenomenon.
For this analysis, we focus on two key elements of volatility—namely, the gross amount of annual revenue fluctuations, and the extent to which these fluctuations are related to cyclical ups and downs in the economy.
Specifically, we analyzed the year-to-year changes in California revenues during the period 1979-80 through 2003-04. This 24-year period encompasses two major business cycles, which is important because the nature of volatility can vary for different phases of business cycles. As a starting point, we adjusted each of the state's major individual revenue sources to remove the year-to-year effects on collections of law changes and other policy-related factors. This allowed us to isolate the underlying volatility of the revenue system. We then calculated several statistical measures, discussed in more detail in the accompanying box (see page 6), for each of the adjusted revenue series in order to capture different aspects of revenue volatility. These included, for each revenue source: (1) their annual average growth rates; (2) the standard deviations around their growth rates; and (3) the short-term elasticities of the revenue sources with respect to changes in California's economic activity, as measured by statewide personal income.
Figure 2 shows the results of our analysis for General
Fund revenues. (Given the indirect effects of
local property taxes on the General Fund through their impacts on
Proposition 98 spending, we discuss the volatility
of the property tax separately in the box below.) The
figure shows that the average annual growth rate
in total General Fund revenues over the
24-year period from 1979-80 through 2003-04 was 6.1 percent. However, the
standard deviation (that is, the average variation
around the long-term growth trend) was an even
larger 8 percent. In other words, total revenues
have been quite volatile.
|
Figure 2 Average Annual Growth and
Standard Deviation of |
|||
|
|
|||
|
|
Full
Period |
Subperiods |
|
|
1979‑80
Through |
1991‑92
Through 2003‑04 |
||
|
Total Revenues |
|
|
|
|
Average growth |
6.1% |
7.1% |
5.2% |
|
Standard deviation |
8.0 |
6.4 |
9.4 |
|
Personal Income Tax |
|
|
|
|
Average growth |
7.5% |
8.8% |
6.5% |
|
Standard deviation |
11.9 |
9.8 |
13.8 |
|
Sales and Use Tax |
|
|
|
|
Average growth |
5.2% |
6.3% |
4.3% |
|
Standard deviation |
4.5 |
4.5 |
4.5 |
|
Corporation Tax |
|
|
|
|
Average growth |
4.6% |
5.6% |
3.7% |
|
Standard deviation |
11.4 |
12.9 |
10.4 |
|
|
|||
|
a
In analyzing revenue volatility over time and among different
income sources, it can be helpful to look at a relative measure
of variation in addition to the absolute measure of variation
captured by the standard deviation. A popular relative measure is the
coefficient of variation, defined as the standard deviation divided by
the average growth rate. This measure also shows that volatility has
increased over time, and is greater for both the PIT and CT than for the
SUT. |
|||
Statistical Measures for Examining Revenue VolatilityUsing data from 1979-80 through 2003-04, our statistical calculations provide (1) average revenue growth rates, (2) the variability around these average changes, and (3) the extent to which such variability is related to fluctuations in the state's economy versus other factors. The specific statistical measures that we used are:
Distinction Between Short- and Long-Term Elasticity. Short- and long-term elasticities are distinct concepts that measure different attributes of a revenue system. For the historical period 1979-80 through 2003-04, the long-term elasticity of revenues to personal income was about 1. This tells us that the cumulative growth in revenues was about the same as the cumulative growth in personal income over the full period examined. This information is important for long-term planning purposes. However, the long-term elasticity does not provide information about the paths taken by revenues and the economy during the intervening individual years. This information is provided by the short-term elasticity estimates discussed above. In California, the short-term elasticity of revenues was 2.05 during the 1979-80 through 2003-04 period, meaning that revenues accelerated, on average, by roughly twice as much as the economy in good times and decelerated by roughly twice as much as the economy during bad times within the 24-year period examined. |
Individual Sources. Regarding major individual revenue sources, these include: the PIT, which accounts for about 50 percent of total revenues; the SUT, which accounts for about 30 percent of the total; and the CT, that accounts for nearly 10 percent of the total. Of these major sources, the most volatile have clearly been the PIT and CT, with each having experienced a standard deviation (that is, average variation around their long-term growth trend) of over 11 percent for the period as a whole. In contrast, the SUT has exhibited relatively modest volatility over time, with a standard deviation of about 4.5 percent.
Volatility Increased Markedly After 1990. The standard deviation for total revenues increased markedly from 6.4 percent in the pre-1990 period to 9.4 percent in the post-1990 period. All of the increase was related to the PIT. In contrast, the variability of the SUT did not change much between the two subperiods, and the volatility of the CT actually declined marginally.
A key question related to revenue volatility is how much of its annual fluctuations is related to cyclical changes in the economy (over which state policymakers generally have little control in the short term) and how much is due to the basic underlying characteristics of the tax structure (which can be changed).
As noted earlier in the top panel of Figure 1, annual revenues have fluctuated by considerably more than statewide personal income during the period we examined. Figure 3 shows our estimates of the sensitivity of annual percent changes in revenues to those for personal income during economic cycles over the past decade (as noted in the earlier box, this relationship is referred to by economists as the short-term elasticity of revenues). It shows that the short-term elasticity for total revenues was 2.05, implying that, on average, the magnitude of revenue cycles were about twice the size of economic cycles during the historical period examined.
|
Figure 3 Historical Effects of
Economic Cycles on |
|||
|
|
|||
|
|
Effects
of a 1 Percent Change in Personal Income On Percent Changes in
Revenuesa |
||
|
|
1979‑80 |
1979‑80
Through |
1991‑92
Through |
|
Personal income tax |
2.94% |
1.09% |
6.24% |
|
Sales and use tax |
1.19 |
1.33 |
1.44 |
|
Corporation tax |
1.70 |
2.57 |
3.33 |
|
Totals, All
Revenues |
2.05% |
1.39% |
3.51% |
|
|
|||
|
a
Based on short-term elasticity calculations. |
|||
The figure also shows that the short-term elasticity jumped sharply during the most recent economic cycle—from 1.39 in the 1979-80 through 1990-91 period, to 3.51 in the 1991-92 through 2003-04 period. This implies that revenues became more volatile relative to the underlying economy during this later period.
As we discuss below, there are several factors behind California's relatively high degree of revenue volatility. Clearly, the most important factor in recent years is the extraordinary boom and bust in stock market-related revenues from stock options and capital gains. As shown in Figure 4, PIT revenues from these two sources jumped from about $2 billion in 1995-96 to a peak of $17 billion in 2000-01, before plunging to about $5 billion in 2002-03.

As an indication of how important this boom-bust cycle in stock market-related earnings was to California's volatility picture, Figure 5 compares actual volatility during the past 24 years to the amount of volatility that would have existed if stock options and capital gains had been excluded from the tax base during this period. Specifically, we estimate that:
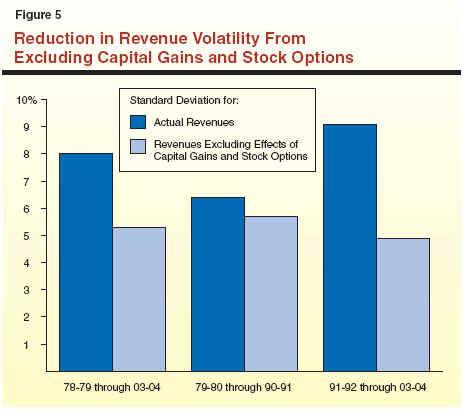
It should be noted, however, that just as revenues would be considerably less volatile if stock options and capital gains were not part of the tax base, average revenue growth itself also would be much less. This is because, even after the 2001 stock market bust is taken account of, stock options and capital gains were among the fastest-growing sources of state revenues and will likely continue to be so over the longer term.
Given California's significant revenue volatility experiences over the past two decades, a natural next question to ask is: What are the adverse consequences of such revenue volatility? Understanding this is particularly important in considering whether and what steps should be taken to lessen volatility since, as we discuss further below, reducing volatility can itself involve trade-offs. These include reducing the rate at which revenues may grow and changing how the tax burden itself is distributed.
The first and most obvious impact of revenue volatility involves the large dollar variations in state revenues that it can produce. To provide an indication of what the above-discussed percentage estimates of volatility imply in dollar terms, consider that 2004-05 General Fund revenues (excluding transfers and loans) are currently expected to be roughly $78 billion. If revenues were to grow from that level in 2005-06 at the long-term underlying average growth rate of 6.1 percent shown in Figure 2, the resulting revenue total would be roughly $83 billion. However, an 8 percent standard deviation implies that the actual level of revenues could differ from that amount by an average plus-or-minus margin of $6 billion, resulting in a revenue range from $77 billion to $89 billion.
These are extremely large dollar margins. Admittedly, they are probably somewhat skewed by the extraordinary large volatility of the late 1990s and early 2000s. However, even after excluding the "outliers" (that is, the years in which the most extreme fluctuations occurred), the year-to-year variation in past revenue growth has been considerable and suggests that multibillion-dollar single-year future revenue swings are more likely than not.
Even if revenue volatility could be accurately predicted, year-to-year revenue fluctuations of this magnitude make it difficult to provide stable funding for state programs, and thus complicate budgeting. Compounding this, of course, is the fact that to date it has not proved possible to accurately predict volatility itself. The forecasting procedures used by both the Department of Finance and our office do attempt to forecast year-to-year revenue fluctuations by taking into account the impacts of general economic cycles and specific economic factors such as consumer and business spending, housing starts, employment, profits, and changes in income distributions. These methodologies have been successful in predicting a significant portion of the revenue fluctuations that have occurred in most years. However, since revenue volatility is related at least in part to particularly hard-to-predict factors such as changing stock market values and business profits, it is often associated with increased forecasting discrepancies.
For example, Figure 6 shows that, using the estimated short-term elasticities calculated for the full 1979-80 through 2003-04 historical period found above in Figure 3, a moderate 2 percent overestimate of economic growth as measured by personal income would produce a 4.1 percent shortfall in revenues. This would translate into a dollar shortfall of over $3 billion in 2005-06 terms. Alternatively, using the greater elasticities generated for the post-1990 period, the dollar shortfall would exceed $5 billion.
|
Figure 6 Revenue Shortfall From a 2
Percent Over-Estimate of |
||
|
(Dollars in Millions) |
||
|
|
Illustrative
Effect in 2005-06 |
|
|
|
Amount |
Percent |
|
Personal income tax |
$2,320 |
5.9% |
|
Sales and use tax |
600 |
2.4 |
|
Corporation tax |
300 |
3.5 |
|
Other revenues |
30 |
0.6 |
|
Totals |
$3,220 |
4.1% |
Volatility of the Property TaxAlthough the property tax in California is a local
revenue source, fluctuations in revenue growth
from this source nevertheless can have significant impacts on the
state's budget. This is because under the minimum funding guarantee for As shown in the accompanying figure, local property taxes have exhibited less volatility than the state's General Fund tax sources—both over the full 24-year period we have examined and during its two individual subperiods. The average growth rate for this tax has been 7.5 percent, while the standard deviation has been 3.5 percent.
|
As discussed earlier and noted in Figure 7, California's revenue volatility is related both to the state's general economic cycles and the specific characteristics of its tax structure. Each of these factors has played a major role in California's revenue fluctuations in past years. California's heavy dependence on the volatile PIT has been especially important.
|
Figure 7 Key Factors Contributing
to California’s |
|
|
|
�
|
|
�
Has large cyclical industries like high technology and housing |
|
�
Has large fluctuations in domestic in-migration |
|
�
Characteristics of the Tax Structure |
|
�
Largest tax, the PIT, is highly volatile |
|
�
Progressive rate structure magnifies income fluctuations. |
|
�
Volatile capital gains are fully taxed. |
|
�
Next largest tax, the SUT, is
relatively stable but could be more so |
|
�
Consists of more volatile types of spending, such as sales
of building materials, autos, and business equipment. |
|
�
Third largest tax, the CT, is very volatile |
|
�
Corporate profits fluctuate in such cyclical industries as
high technology, finance, and construction. |
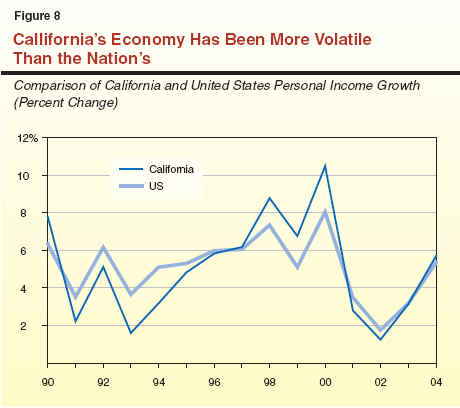
Any revenue system that is highly responsive to economic growth over the long term will necessarily be affected by ups and downs in the economy over the course of a business cycle. As indicated in Figure 8, California's economy has historically been more cyclical than the rest of the nation. This reflects several factors, including:
A related factor has been the increased concentration of income in the state over time among households at the top end of the income distribution. This is significant because high-income households, who pay the largest share of personal income taxes, tend to have a larger share of their earnings related to such cyclical sources as bonuses, stock options, capital gains, and business profits than do households in the lower and middle portions of the income distribution.
As noted previously, California's revenue growth has fluctuated by considerably more than statewide personal income growth during the past couple of decades. California's tax system has several key features which have contributed to this above-average volatility.
In particular, California has become highly dependent on the PIT. Specifically, the PIT's share of total revenues rose from 37 percent in 1979-80 to a peak of 57 percent in 2000-01, before retreating some to 48 percent in 2003-04. The increased dependence on the PIT over time is significant because this tax has two features that have contributed to above-average volatility:
To a lesser extent, some other features of California's tax structure have also resulted in increased volatility. As noted earlier, its SUT is largely applied to the exchange of only tangible personal property, and California has not extended the SUT to many services. As a result, the tax is primarily influenced by the more cyclical categories of spending, such as for automobiles, residential and nonresidential construction, computers, and other "big ticket" items.
We believe it is possible that the extreme swings in stock market-related revenues experienced over the past decade may turn out to be an historical anomaly. Thus, we would not expect the extreme volatility of the past decade to become the rule. However, many other factors that have contributed to volatility in the past—namely, increased reliance on the PIT and increasing concentrations of income at the high-end of the income distribution—are more permanent and thus likely to continue to contribute to volatility in the future. Given this, we believe that significant revenue volatility will continue to be a major characteristic of California's tax system, absent major policy changes to the tax system`s structure.
Given that a certain amount of volatility is inherent in California's current tax system (both due to the economy and the system's own characteristics), and that volatility has adverse effects on the state's budgeting, a natural question to ask is: What actions, if any, should be taken to deal with volatility in the future? Fundamentally, policymakers have two types of options to use individually or in combination for dealing with revenue volatility:
As indicated below, both of these approaches would involve significant policy trade-offs that would need to be considered.
Regarding the former approach, there are numerous changes that the Legislature could make to the revenue system that would reduce its volatility. Figure 9 outlines some of the key options that are available in this area, provides estimates of how much their adoption would have reduced volatility during the past 24 years, and identifies the key policy trade-offs that would need to be considered. These options are discussed in more detail below.
|
Figure 9 Options for Changing the
Tax System to |
|||
|
|
|||
|
|
Option |
Reduction
in Volatilitya |
Key
Policy Trade-Offs |
|
1. |
Reduce personal income tax (PIT) rates on capital
gains and stock options |
Moderate to substantial reduction. |
Shift in tax burdens, either among income groups or among
taxpayers with different forms of income. |
|
2. |
Use income
averaging for capital gains |
Moderate reduction. |
Would not conform to federal law. |
|
3. |
Reduce
progressivity of the PIT rate structure |
Potentially substantial reduction. |
Shift in tax burdens among
income groups.
Reduction in revenue growth. |
|
4. |
Rebalance mix of
taxes away from PIT |
Modest reduction. |
Some shift in tax burdens among
income groups.
Some reduction in revenue growth. |
|
5. |
Modify the
corporation tax |
Probably modest reduction. |
Shift in tax burdens among
corporations.
Would reduce conformity with other states. |
|
|
|||
|
a
For purposes of this figure, "substantial" implies more
than 20 percent, "moderate" implies between 10 percent
and 20 percent, and "modest" implies less than 10 percent. |
|||
Probably the single most direct way to limit the state's exposure to the kind of extreme revenue volatility experienced in the past decade would be to reduce its dependence on the source of income that produced the greatest portion of this revenue volatility—namely, capital gains and perhaps stock options. One obvious way to do this would be to reduce their tax rates. Cutting the maximum state tax rate on capital gains in half (from 9.3 percent to 4.65 percent) would have reduced total revenue variability by about 12 percent during the 1979-80 through 2003-04 historical period. Extending the preferential tax-rate treatment to both capital gains and stock options would have reduced volatility even more—by about 16 percent for the 1979-80 through 2003-04 period. The reduction in volatility would have been an even greater 25 percent during the post-1990 period. We would note, however, that extending preferential rates to stock options would result in a tax treatment in California that is more generous than offered for this type of income by either the federal government or other states.
Policy Issues and Trade-Offs. The main policy trade-off is that this option would result in a shift in tax burdens among taxpayers with different income levels and among taxpayers who earn income from different sources. A 50 percent reduction in the maximum rate on capital gains would reduce taxes paid by $2.5 billion in 2005-06. Since over 90 percent of capital gains are received by taxpayers in the top 5 percent of the income distribution, the great majority of benefits from this change would similarly accrue to high-income taxpayers. The revenue reductions could be offset through broad-based tax increases (such as a one-half-cent increase in the SUT rate, or an across-the-board 7 percent increase in each of the current marginal PIT rates). However, both of these options would shift the tax burden in California away from high-income taxpayers to lower- and middle-income taxpayers.
The state could avoid major changes in the tax burden between high-income and other income groups under this option by replacing the lost revenues with higher maximum tax rates on noncapital gains income, such as by imposing additional 10 percent and 11 percent brackets on such income. However, such an increase would aggravate the disparity in tax rates applied to different forms of income. It would also impose an additional tax burden on those high-income taxpayers that derive most of their earnings from wages, business profits, or dividends. Finally, this option may be less feasible as a result of voter approval of Proposition 63 in November 2004. This measure imposes a 1 percent PIT surcharge on taxable incomes above $1 million.
An alternative change that would reduce the PIT's volatility without advantaging capital gains and stock options through lower tax rates would be to adopt some type of multiyear income averaging approach. This would smooth out year-to-year fluctuations in reported taxable income from capital gains and stock options, thereby lessening volatility without having to give significant preferential treatment to these two sources of income. This approach would be more neutral in terms of its impact on the behavioral decisions by taxpayers in making investment choices.
Policy Issues and Trade-Offs. The key trade-off related to this option is that it would move California out of conformity with federal tax law with regard to how capital gains are calculated for tax purposes. It would thus impose a new record-keeping burden on taxpayers and require them to use a different capital gains tax computation methodology for state and federal purposes.
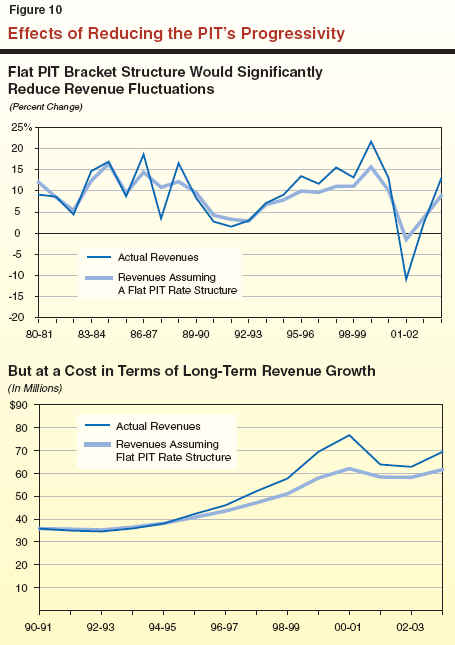
This option would involve flattening the PIT marginal tax rate structure, by raising the absolute and/or relative average rate on lower- and moderate-income taxpayers and reducing those on high-income taxpayers. The reduced progressivity would have two beneficial effects on volatility. First, it would lessen the state's relative dependence on capital gains, business income, and other volatile income sources that flow to high-income taxpayers and are thus currently subject to higher-than-average tax rates (generally 9.3 percent versus the 7 percent average). Second, a flatter tax rate structure would smooth out revenue growth over business cycles—lowering growth during economic expansions (when increases in wages currently push taxpayers into higher marginal tax rate brackets) and raising growth in recessions (when falling incomes currently cause taxpayers to slide back into lower tax brackets). At the extreme, as noted in Figure 9 and illustrated in Figure 10, if the state were to apply a flat tax on all taxable personal income, the overall volatility of California's revenue system would be reduced by about one-third.
Policy Issues and Trade-Offs. A reduction in the progressivity of the PIT rate structure would have two key policy trade-offs. First, it would result in significant shifts in tax burdens from high-income to moderate-income and low- income tax payers. The extent of this shift would depend on the nature of the revised tax system, but any change that reduces progressivity will necessarily involve a shift in relative tax burdens.
Second, it would result in significantly less revenue growth over the long term. As noted earlier in Figure 2, total General Fund revenues have increased at about the same overall pace as personal income over the past 24 years. Receipts from the PIT itself, however, have grown modestly faster than the economy. This is mainly due to its progressive tax rate structure, where rising real incomes are subject to higher tax rates over time.
As an example of the importance of progressivity to long-term revenue growth, we estimate that if the state had had a flat PIT rate structure in place since 1990-91, the cumulative growth in revenues would have been over $7 billion less by 2003-04 than actually occurred. (See lower half of Figure 10.)
An alternative approach to directly changing treatment of capital gains or modifying the PIT tax rate structure would be to retain the current basic PIT structure but "rebalance" the state's portfolio of taxes away from the PIT and toward other taxes. Such a change could be made in a revenue-neutral fashion through an across-the-board reduction in PIT rates and a corresponding increase in other taxes—either through tax rate increases or through a broadening of the alternative taxes' bases.
One of the attractive features of this option is that it could be used to both reduce volatility and achieve other desirable objectives of state tax policy. For example, the state could couple a reduction in the PIT with a broadening of the SUT's base to include selected services. This would achieve the dual objectives of reducing volatility (since spending on most services tends to be relatively stable over a business cycle) and equalizing tax treatment for different types of purchases and businesses affected by them. At least modest reductions in revenue volatility could result.
Policy Issues and Trade-Offs. Given the highly progressive nature of California's PIT, any policy that reduces dependence on this tax is likely to result in at least some shift in tax burdens among different income classes. However, it would take a fairly drastic shift in the reliance on different taxes to achieve a significant decline in revenue volatility. Finally, any rebalancing which reduces the state's dependence on California's progressive PIT would likely result in less growth in revenues over the long term.
As noted earlier in Figure 2, the CT has consistently been among the most volatile of California's taxes. This is not surprising since even modest changes in businesses' revenues and costs can translate into sometimes-dramatic changes in bottom-line earnings.
Other provisions in the CT law—such as those relating to net operating loss carry-forward deductions, research and development credits, and apportionment of companies' worldwide income to the state—also contribute to year-to-year fluctuations in revenues.
One option in this area would be to replace the existing tax on profits with a levy based on gross receipts. Based on historical fluctuations in business receipts versus profits during business cycles, it would appear that a receipts-based system could reduce volatility from the CT by two-thirds or more. However, given the relatively small share of total revenues attributable to the CT, the impact of this change on overall state revenue volatility would be relatively modest—reducing total volatility by only about 10 percent.
Policy Issues and Trade-Offs. There is a policy rationale for basing taxes on gross receipts—namely, that companies with a significant presence in this state are directly or indirectly using public services—such as infrastructure and education—regardless of whether or the extent to which they are profitable. However, such a system would result in some companies paying more than presently, and also would place California out of conformity with other states, most of which tax corporate profits.
As the above examples show, the state could reduce revenue volatility through making a number of different changes to its basic tax structure. Some of these changes, such as those which broaden tax bases and reduce overall tax rates, would result in other positive benefits to the state's tax system. However, the options that would have the greatest impact on lessening volatility would come with significant policy trade-offs, such as changing the distribution of the tax burden and lowering underlying revenue growth rates.
In any case, the dynamic and often volatile nature of California's economy implies that even with substantial structural tax changes, the state would still likely be left with significant revenue volatility in the future. Any revenue system that is responsive to economic growth over the long term will inevitability be influenced by the ups and downs of economic cycles in the shorter and medium term. Consequently, even if California were to modify its tax structure, it would be important to also consider budgetary tools as an important option for dealing with revenue volatility in the future.
In recent years, California has used a variety of budget management options to help balance its budgets. Examples include spending deferrals, accounting changes, shifts of program responsibility from the General Fund to bond funds, loans and transfers from special funds, and borrowing from private markets.
While these tools can help the state avoid disruptive cuts to state programs in the short term, they also have numerous negative consequences. For example, they can negatively affect spending for special fund-supported programs (such as transportation), and excess use of budgetary borrowing can have adverse impacts on the state's credit rating. In subsequent years, repayment of borrowed funds can also negatively affect the state's ability to fund current priorities with current revenues.
The state has two other important options, however, that it can use during "good times" to help it deal with the downsides of revenue volatility. These involve allocating some revenue growth to one-time purposes and/or building up substantial reserves.
Under this option, a portion of revenue growth during good times could be allocated for one-time purposes, such as capital outlay financing, reduction of unfunded pension liabilities, payments toward other deferred obligations, or providing one-time tax relief. While this option would provide less of a cushion against volatility than a reserve, it would at least help the state avoid ongoing commitments that it could not sustain during the inevitable periods of revenue softness.
Policy Issues and Trade-Offs. Following periods of chronic budget shortfalls, there is often considerable pent-up demand for spending on existing programs to cover enrollment, caseloads, and workload that were not funded in prior years. The benefits of segregating new funds for one-time purposes would need to be weighed against these pressures.
In our view, this option remains the most effective budgetary tool for dealing with typical revenue fluctuations. Revenues set-aside into a reserve during revenue accelerations and expansions can be used to preserve program spending during revenue slow-downs and downturns, thereby "smoothing out" program spending over time. Although California has long included reserves as part of its annual budget plans, the size of these reserves has been relatively modest compared to the annual fluctuations in revenues that have actually occurred. As history has shown, these reserves have fallen well short of what would have been needed to effectively protect the state against revenue fluctuations, particularly in recent years.
Proposition 58 Reserve Targets. The approval of Proposition 58 by the voters in the March 2004 elections makes funding future reserves a greater priority. Among other things, this measure requires that a portion of annual General Fund revenues be allocated to a Budget Stabilization Account (BSA) in each year beginning in 2006-07. The set-asides for this purpose are 1 percent in 2006-07, 2 percent in 2007-08, and 3 percent in 2008-09 and each year thereafter until the balance in the account equals the greater of $8 billion or 5 percent of annual General Fund revenues. These annual transfers to the BSA can be suspended or reduced for a given fiscal year by an executive order issued by the Governor. In the case of transfers from the BSA, these can occur through a majority vote of the Legislature.
Policy Issues and Trade-Offs. The much larger reserve targets established by Proposition 58 are consistent with the levels that the state would need to meaningfully insulate itself from the effects of revenue volatility. Although not providing coverage for all contingencies, such as the extreme boom-bust revenue cycle that began in the late 1990s, reserves along the lines of those envisioned by Proposition 58 would effectively deal with the more normal, but still substantial, fluctuations that can reasonably be expected to occur in future years. The major policy trade-off for this option is that in order to build-up a large reserve, it would be necessary to withhold funds from other General Fund priorities. This trade-off is especially significant in the current budget environment, where ongoing revenues are projected to fall short of current-law expenditures during at least the next several years.
Revenue volatility has long been present in California's tax system, but it became dramatic in recent years. We believe that the extreme volatility associated with the recent stock market boom and bust will likely prove to be an historical anomaly. However, several other factors—in particular, California's dynamic economy and the state's current heavy reliance on a highly progressive PIT—mean that revenue volatility will remain a feature of California's current-law tax system in the future. We have identified several options involving changes to the state's tax structure that could lessen future revenue volatility. Some of the options would both reduce volatility and achieve other objectives of state tax policy. However, certain other options—including those that would have the greatest impact on lessening volatility—would involve significant policy trade-offs that would need to be considered. Among these trade-offs would be redistributions of tax burdens and possible effects on future revenue growth.
Even with tax reforms, it is likely that California would continue to face significant volatility in the future. Thus, we believe that any strategy to deal with future volatility should include reliance on budget management options. The most effective of these options is a large reserve, in line with the targets established by Proposition 58.
| Acknowledgments
This report was prepared by Brad Williams and Jon David Vasch�. The Legislative Analyst's Office (LAO) is a nonpartisan office which provides fiscal and policy information and advice to the Legislature. |
LAO Publications
To request publications call (916) 445-4656. This report and others, as well as an E-mail subscription service, are available on the LAO's Internet site at www.lao.ca.gov. The LAO is located at 925 L Street, Suite 1000, Sacramento, CA 95814. |