This report provides our projections of General Fund revenues and
expenditures for 2004-05 through 2009-10. It includes our independent assessment of the outlook for California's economy, demographics, revenues,
and expenditures.
Chapter 1 contains our principal findings and conclusions. Chapter 2 presents our economic and demographic projections, Chapter 3 our revenue
forecasts, and Chapter 4 our expenditure projections.
Our fiscal projections reflect current-law spending requirements and tax
provisions. They are not predictions of future policy decisions by the Legislature, nor
are they our recommendations as to what spending and revenue levels should be.
This report, in its tenth year of publication, reflects the historical mission
of the Legislative Analyst's Office to assist the Legislature with its fiscal planning
by assessing the revenues and expenditures of the state. The report is part of
an ongoing series and is updated periodically.
Chapter 1
The Budget Outlook 1
Chapter 2
Economic and Demographic Projections
9
Chapter 3
Revenue Projections 19
Chapter 4
Expenditure Projections
27
In approaching the 2005-06 budget,
California's policymakers face a deceptively difficult
challenge. On the one hand, the strengthening revenue
picture, coupled with the availability of the
remaining $3.5 billion in authorized deficit-financing
bonds that have not yet been used, would enable the
Legislature to balance the 2005-06 budget by making
a relatively modest amount of hard choices to
reduce spending and/or augment revenues.
This would only be a temporary fix, however, as the 2005-06 outlook masks a much more
negative underlying budget picture. This is because the 2005-06 budget will be helped by a carry-over balance and various limited-term solutions enacted
in the 2004-05 budget which will not be available
in subsequent years. As a result, these solutions
cannot be counted on to address the state's large
and persistent ongoing structural budget shortfall.
We project that this shortfall will reach nearly
$10 billion in 2006-07 under current-law spending
and revenue policies, absent corrective actions.
The size and persistence of this shortfall, even
in the face of an expanding economy and strengthening revenues, underscores a critical point that
we have made in the past—namely, it is unlikely
that California will be able to simply "grow its way
out" of this shortfall.
Given the above, we believe it is critical that the Legislature act now to address the large underlying structural budget imbalance. Every ongoing budget solution that is adopted this year will reduce the amount of actions that will be needed later. Conversely, postponing action will only make the state's fiscal matters worse in the future. Therefore, we recommend that the state adopt real and ongoing solutions to close the budget gap in 2005-06 and that it not sell the remaining $3.5 billion in deficit-financing bonds at this time. Such an approach will have the dual benefits of both (1) reducing the structural deficit in later years through adopting ongoing solutions, and (2) preserving the bonding authority for possible use in 2006-07 or thereafter, when the current-law structural shortfall gets much larger and harder to deal with.
The 2004-05 budget adopted last summer addressed a roughly $15 billion budget shortfall. As shown in Figure 1, that budget plan contained a variety of budget-balancing actions, including substantial borrowing, a two-year diversion of property taxes, targeted revenue increases, funding shifts (including higher education student fee increases), and significant program savings in education and other areas of the budget.
Proposition 98 Suspension. The budget
package included a suspension of Proposition 98 and
language in Chapter 213, Statutes of 2004, that
2004-05 education spending be set at $2 billion less than
the minimum guarantee. (This language, in effect,
signals the Legislature's intent to provide
more/less funding if the guarantee increases/decreases
during the year—for example, due to changes in
revenues or attendance.) The difference between this
Chapter 213 "target" level and the actual amount
appropriated by the budget—$302 million—is shown
as a Proposition 98 reserve in the 2004-05 budget.
General Fund Condition. Under the budget
plan, the 2004-05 fiscal year was estimated to
conclude with a reserve balance of $768 million, of
which $302 million was earmarked for Proposition 98
and the remaining $466 million was to be available
for non-Proposition 98 purposes. Because of
the budget's reliance on one-time or limited-term
solutions, it was clear when the budget was adopted that the
state would continue to face substantial budget shortfalls in the
future, absent further corrective actions.
Since the 2004-05 budget was enacted, there have been various developments affecting the revenue and expenditure sides of the budget. Key changes in our fiscal estimates relative to the budget act are shown in Figure 2.
|
Figure 2 Effect of Recent
Developments on 2004-05 Budget |
||
|
(In Millions) |
||
|
|
|
|
|
2004-05 Budget Year-End Reserve |
|
|
|
Proposition 98 reserve |
$302 |
|
|
Non-Proposition 98 reserve |
466 |
|
|
Total |
|
$768 |
|
Higher Revenues (2003-04 Plus 2004-05) |
|
|
|
2003-04
major taxes |
$430 |
|
|
2004-05
major taxes |
1,997 |
|
|
2004-05
nontax revenues |
-364 |
|
|
Subtotal
(increase to reserve) |
|
$2,063 |
|
Higher Costs/Reduced Savings |
|
|
|
Punitive damage award redirection |
$390 |
|
|
Unallocated savings |
316 |
|
|
Corrections |
201 |
|
|
Medi-Cal |
96 |
|
|
Trial courts |
90 |
|
|
Proposition 98: lower |
-445 |
|
|
Other |
212 |
|
|
Subtotal
(decrease to reserve) |
|
$860 |
|
Revised
Reserve: |
|
$1,971 |
|
Proposition 98 Reserve |
|
(1,357) |
|
Non-Proposition 98 Reserve |
|
(614) |
Revenues Up Sharply. We estimate that the major
taxes will exceed the budget estimate by $2.4 billion over
2003-04 and 2004-05 combined, due to a sharp increase
in the corporation tax and more moderate gains in both the personal income tax and the sales and
use tax. Partly offsetting the increase in tax revenues is
a $364 million decline in nontax revenues, due
to lower-than-expected receipts from tribal gaming revenues and the sale of surplus property. The
net increase in General Fund revenues is $2.1 billion.
Costs Are Also Up. Offsetting a significant
portion of the revenue increase are higher state
costs totaling about $860 million. The increases are
occurring in a variety of areas, including
corrections, Medi-Cal, trial court funding, and spending on
state operations. In some instances, the higher costs
are occurring because the amount of savings
resulting from various budgetary solutions is falling short
of earlier estimates.
Revised Reserve. Taking into account the
higher revenues and higher costs, we estimate that the
year-end reserve increases by about $1.2 billion, to
just under $2 billion.
Proposition 98 Interaction. The increase in
projected 2004-05 tax revenues increases the
minimum Proposition 98 K-14 funding guarantee by
about $1 billion compared to the budget plan.
Consequently, if the Legislature funds Proposition 98
at the Chapter 213 target level (that is, $2 billion
below the guarantee), it would require a $1 billion
increase in school appropriations. In Figure 2, we
have reflected this higher obligation as an increase in
the Proposition 98 reserve from $302 million
to $1.357 billion. This leaves $614 million of the
total reserve available for non-Proposition 98
purposes, only a marginal increase from the $466 million
estimated at the time the budget was enacted. Thus,
the large increase we project in tax revenues is
almost completely offset by increased spending due to
the Proposition 98 interaction and higher costs in
other program areas.
Figure 3 shows the General Fund condition through 2005-06, using the assumptions outlined in the accompanying box. We estimate that revenues will climb to $82.2 billion and expenditures will total $89.5 billion in 2005-06, resulting in a $7.3 billion operating shortfall (that is, the difference between annual revenues and annual expenditures). After taking into account the $614 million non-Proposition 98 reserve available from 2004-05, the 2005-06 year-end deficit would be $6.7 billion.
|
Figure 3 LAO Projection of General
Fund Condition |
|||
|
2003-04 Through 2005-06 |
|||
|
|
2003-04 |
2004-05 |
2005-06 |
|
Prior-year balance |
$4,178 |
$3,542 |
$1,543a |
|
Revenues and transfers |
75,000 |
78,884 |
82,247 |
|
Deficit-financing bond |
2,012 |
� |
� |
|
Total Resources Available |
$81,190 |
$82,426 |
$83,790 |
|
Expenditures |
77,649 |
79,526 |
89,540a |
|
Ending fund balance |
$3,542 |
$2,899 |
-$5,751 |
|
Encumbrances |
929 |
929 |
929 |
|
Reserve |
$2,613 |
$1,971 |
-$6,680 |
|
Proposition
98 |
� |
(1,357) |
� |
|
Non-Proposition
98 |
� |
(614) |
� |
|
|
|||
|
a
Assumes that 2004-05 Proposition 98 reserve is appropriated. |
|||
Year-End Condition if Proposition 98 Not
Increased. If appropriations for Proposition 98
were not increased in the current year, spending in
the current year and budget year each would be reduced by
$1.4 billion. This would reduce the 2005-06 year-end
shortfall from the $6.7 billion shown in Figure 3
down to $3.9 billion.
Our revenue and expenditure forecasts are based primarily on the requirements of current
law, including constitutional and statutory funding requirements. Our estimates also reflect
projected changes in caseloads, federal reimbursements, and other factors affecting program costs. Of
special significance in the current forecast are our assumptions in the following three areas.
Governor's Higher Education
Compact. In the current forecast, we have not assumed the
Governor's "compact" with higher education, as the Legislature has taken no statutory action to
implement such an agreement. Rather, our estimates for higher education are based on projected enrollment
and inflation-related increases. Fully funding the compact would require added annual
expenditures beyond those we are projecting, reaching over $500 million by the final year of our forecast period.
Future Proposition 58 Transfers to the Budget Stabilization
Account. Proposition 58, approved by the voters in March 2004, created a Budget Stabilization Account (BSA) to cushion the state
against budget-related shortfalls. The measure provided for annual transfers of General Fund revenues to
the BSA, equaling 1 percent of General Fund revenues in 2006-07 (about $875 million), 2 percent
in 2007-08 (about $1.9 billion), and 3 percent in 2008-09 (about $2.9 billion) and thereafter until
the balance in the fund reaches $8 billion. The measure, however, allows the transfers to be suspended
or reduced through a Governor's executive order. Given the major budget shortfalls we are
already projecting in the out years, we have not included the added expenditures that would be needed
to fund the annual transfers to the BSA in our estimates.
Interaction of Proposition 98 With Revenue
Increases. Our baseline estimates include the
impacts of the current-year increase in revenues—and other factors—on the Proposition 98 spending
levels. This is consistent with language in Chapter 213, which was enacted with this year's budget.
However, given the increased General Fund shortfalls and increased pressures on non-Proposition 98
programs that would result from this use of revenues, we also show the outlook assuming no change
in 2004-05 Proposition 98 appropriations. Our estimates are not predictions of what the Legislature and Governor will adopt as policies
and funding levels in future budgets. Rather, our estimates are intended to be a reasonable
"baseline" projection of what would happen if current-law policies were allowed to operate in the future. In
this regard, we believe that our forecast provides a meaningful starting point for legislative
deliberations involving the state's budget.
Basis for Our Estimates
Projections, Not Predictions
Our longer-term revenue and expenditure forecasts through 2009-10 are detailed in Chapters 3 and 4, respectively. Figure 4 shows the effects of these projections on the state's operating deficit—annual revenues minus expenditures—under two scenarios:
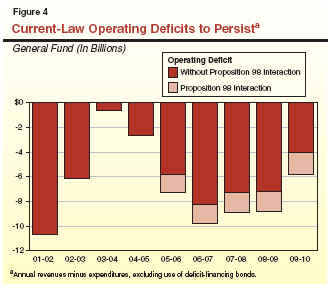
The state has been plagued with a large
structural budget shortfall since 2001-02, when
revenues plunged following the recession and the
steep decline in the stock market. The annual gap
between projected revenues and expenditures has been massive, reaching
as much as one-quarter of annual General Fund
spending. While the state has addressed the annual
shortfalls in each of the past three budgets, many of
the solutions have involved borrowing, spending
deferrals, accounting shifts, and other one-time
actions. As the benefits of these one-time solutions fell
away in subsequent years, the large underlying
structural shortfall reemerged.
The one-time and limited-term savings included in the 2004-05 budget are highlighted in
Figure 5. They include savings from deficit-financing bonds, pension obligation bonds, Proposition 42 transportation loans, postponement of
local mandate payments, and diversion of local
property taxes.
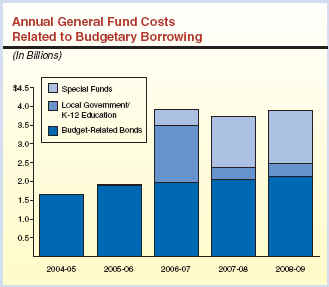
These actions, along with substantial borrowing undertaken in previous budgets, are resulting in
significant current and future General Fund costs.
As indicated in the accompanying box, annual General Fund costs related to budget borrowing
will peak at nearly $4 billion annually in 2006-07
through 2008-09, before trailing off somewhat in
subsequent years.
Figure 5 One-Time or Limited-Term
Solutions in 2004-05 Budget
Deficit-financing bond proceeds ($2 billion)
Proposition 42 transportation loan ($1.3 billion)
Diversion of local property taxes ($1.3 billion annually for two
years)
Pension obligation bond proceeds ($929 million)
Postponement of local mandate payments (about $200 million)
Suspension of teachers� tax credit (about $200 million annually
for two years)
Approaching the Budget Problem
As discussed above, our projections indicate that, absent corrective actions, the state will not resolve its structural imbalance. As a result, it is important that the Legislature take meaningful actions in 2005-06 to address this shortfall. In this regard, we believe that there are four basic "building-blocks" that should be considered in crafting a strategy for dealing with the budget shortfall in 2005-06:
While it is tempting to use deficit-financing bonds to avoid the more painful budget choices in 2005-06, making real changes in the budget year would enable the state to make meaningful progress toward eliminating the structural problem that has plagued the state since 2001-02.
Borrowing and the Budget ShortfallAs noted elsewhere in this report, we believe that the Legislature should minimize the use of budget-related borrowing in its solutions to the projected 2005-06 budget shortfall. The state has already accumulated $26 billion of outstanding budget-related debt, consisting of $18 billion in bonds, $4 billion in loans from local governments and schools, and about $4 billion in loans from transportation and resources special funds. This budget-related borrowing is in addition to the $40 billion in traditional borrowing used to finance new infrastructure. Borrowing Is a Temporary Fix . . .While budget-related borrowing enables the state to maintain funding for programs and avoid deeper cuts or revenue augmentations in the year in which it is undertaken, it is a temporary solution, which does nothing to address the ongoing mismatch between revenues and expenditures. . . . That Diverts Resources From Future BudgetsJust as importantly, the borrowing eventually becomes a drag on future budgets, as revenues are diverted from current programs to pay for past borrowing. As shown in the figure, the budgetary borrowing already undertaken will result in annual General Fund costs of nearly $4 billion for the 2006-07 through 2008-09 fiscal period. While the costs will drop off in subsequent fiscal years, they will remain above $2 billion annually until the Proposition 57 deficit bonds are repaid (anywhere from 2013 to 2018). Over the next several years, these budget-related borrowing costs will account for over 40 percent of the annual operating shortfalls that we are projecting. Additional debt will only add to the size of these future diversions, and will hamper meaningful progress toward resolving the state's ongoing structural shortfall.
|
Economic and demographic developments are important determinants of California's fiscal condition, mainly because of their impacts on state revenues and expenditures in such areas as education, health, social services, and transportation. This chapter presents our economic and demographic projections for 2004 through 2010, which will affect California's fiscal condition during fiscal years 2004-05 through 2009-10.
Despite sharply rising fuel prices and
somewhat uneven job gains, both the national and state
economies have experienced solid economic growth over
the past year. The gains have been fueled by strong
performances in interest-sensitive sectors such as
housing, as well as healthy gains in business capital
investment and continued strength in consumer spending.
Looking ahead, we expect economic growth to slow modestly in 2005 due to the constraining
impacts on the economy of high household debt levels, the rise in energy costs, and mild increases
in interest rates. In subsequent years, our outlook
calls for moderate expansion at both the national
and state levels. Figure 1 summarizes the details of
our economic forecasts for the nation and state. In
the subsequent sections, we discuss in more detail
major factors underlying our forecasts.
Figure 1 The LAO�s Economic
Forecast Percentage Change (Unless Otherwise Indicated) 2004 2005 2006 2007 2008 2009 2010 United States Real gross domestic product 4.3% 3.4% 3.5% 3.3% 3.1% 3.2% 3.2% Personal income 5.3 5.0 5.4 5.6 5.8 6.0 6.2 Wage and salary jobs 1.0 1.6 1.2 1.1 1.0 1.0 1.0 Consumer Price Index 2.7 2.7 1.7 2.0 2.2 2.3 2.4 Unemployment rate (%) 5.5 5.4 5.6 5.6 5.6 5.6 5.5 Housing starts (000) 1,933 1,771 1,664 1,627 1,615 1,598 1,617 California Personal income 5.9% 5.5% 5.8% 6.1% 6.3% 6.3% 6.2% Wage and salary jobs 0.9 1.4 1.5 1.8 1.9 1.8 1.7 Taxable sales 6.5 5.6 5.6 6.0 6.5 5.8 5.7 Consumer Price Index 2.8 3.1 2.0 2.2 2.4 2.4 2.6 Unemployment rate (%) 6.1 5.6 5.4 5.4 5.5 5.5 5.5 Housing starts (000) 207 195 183 176 187 179 178
The national economy has experienced
broad-based economic growth over the past year.
Although the third quarter's real (that is,
inflation-adjusted) gross domestic product (GDP)
growth—initially reported at a 3.7 percent annual rate—was
modestly below expectations, the shortfall was
mainly related to less-than-expected accumulation of
business inventories, as opposed to a softening in
consumer or business demand.
Monthly information for October and early November suggests that solid economic growth is
continuing in the final quarter of 2004. After
several months of sluggish gains, job growth
rebounded sharply in October. Although some of the
increase was due to post-hurricane rebuilding activity in
the southeastern U.S., the October expansion was
widespread, affecting most major industry sectors.
Recent reports on retail sales, company profits, new orders
for manufactured goods, and consumer confidence,
also point toward healthy fourth-quarter economic
growth. Finally, the stock market, after lagging for much of
2004, jumped in early November, reflecting optimism
about future business sales and profits.
Although the near-term
outlook is clearly positive, the U.S. economy faces at least two
key challenges as of late 2004. These are high oil-related
prices—which are boosting the costs of gasoline and heating
oil—and the uneven job gains in 2004.
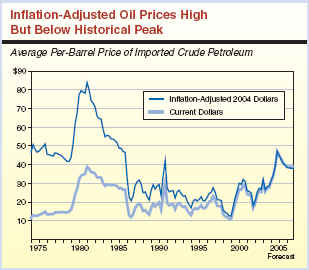
Oil Prices. As indicated in the accompanying box,
world oil prices have jumped dramatically in 2004,
having reached an all-time high of $55 per barrel in mid-October
before sliding back to slightly below $50 as of early
November. The oil price jump has had a major adverse impact on
prices paid by American consumers for gasoline, diesel fuel, heating oil, and other
oil-based commodities. It is also negatively affecting
consumer confidence, and will likely have a modest
negative impact on spending over the next year.
Jobs. Although the U.S. job report for
October was bullish, the employment gains over the past
year have been uneven, with businesses
relying on added hours and productivity gains from their
existing workforce rather than hiring additional
employees. This strategy has worked so far, yielding major gains
in business earnings, as well as higher wages for
some workers. However, the lack of broad-based job
growth remains a risk to the durability of the expansion,
in that, if continued, it may undercut consumer
confidence and spending throughout the economy.
After several years of relative stability, oil prices have soared in 2004, reflecting the impacts
of sharply rising worldwide demand, the lack of new production capacity, and numerous supply
disruptions in the Gulf of Mexico and abroad. As shown in the accompanying figure, the
per-barrel price of crude oil rose from $19 in early 2002 to $30 in early 2004, before soaring nearly to $50 in
the final quarter of the year. The increase in crude oil prices has in turn boosted retail prices of
gasoline—where the average per gallon price in late October surpassed $2 nationwide, and $2.40 in
California—as well as heating oil and a variety of other oil-based products.
The increases that have already occurred will have modest adverse effects on inflation and
real economic growth over the next year. Indeed, the modest economic slowdown we are projecting
in 2005 is partly related to the effects of higher energy costs on household confidence and
discretionary incomes. We do not, however, expect the negative economic impacts to be anywhere near as
dramatic as in the 1970s and early 1980s, when sharply rising oil prices sent the U.S. economy into two
recessions. The main reason is that, while oil prices are at an all-time high, they are nowhere near the
levels reached in 1980 in inflation-adjusted terms. As shown in the figure, in constant 2004 dollars,
oil prices peaked at more than $80 per barrel in 1981.
In addition, the consumption of oil-based products as a percentage of economic output
and income is less today than a quarter century ago, meaning that the proportional impact of any
given crude oil price increase is less today than in the past. A related factor is that the oil price increases
do not appear to be having the same type of
adverse "ripple" effects on other prices throughout
the economy as they did in the 1970s and early
1980s. Businesses have thus far managed to "hold the
line" on retail prices, due to offsetting savings related
to, for example, worker productivity increases.
Absent more broad-based increases in economy-wide inflation, it thus is
unlikely that the oil price increases will have the
dramatic negative impacts on interest rates and other
elements of the economy that they did in the 1970s.
Impact of High Oil Prices
Our forecast assumes that the U.S. economy will expand at a solid though moderating pace in 2005. As indicated in Figure 2, we forecast that year-over-year increases in inflation-adjusted GDP will subside from the current 4 percent pace to around 3 percent by mid 2005, before accelerating modestly in 2006. This outlook assumes continued healthy increases in business investment, but slowing growth in consumer spending.
Our national outlook assumes that: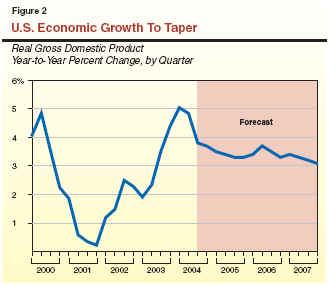
The California economy has experienced
generally healthy growth since mid-2003. The state
has faced challenges in many areas—most recently
being the major increase in gasoline costs.
However, most measures of statewide economic
activity—such as taxable sales, personal income, permits for
new construction, and company profit
reports—suggest that the state's economy is clearly on an upward
track as 2004 draws to a close.
Factors boosting economic growth over the past year have included:
Similar to the national pattern, we expect that California's economic growth will continue in 2005, although at a more moderate pace than in 2004. As indicated earlier in Figure 1, personal income is forecast to slow from 5.9 percent in 2004 to 5.5 percent in 2005, but then average over 6 percent for the balance of the forecast period. On the positive side, the national outlook for continued strong business investment will boost many industries in this state. On the negative side, however, we expect that high energy costs and rising interest rates will take a significant toll on consumer spending and housing activity in the state.
Employment Picture Mixed—Some
Improvement Expected. Over the past year, the
employment picture has been uneven. According to the
monthly survey of employers, payroll jobs (which
economists follow closely in gauging the strength of the
job markets) have increased by just 110,000
between September 2003 and September 2004, a growth
rate of just 0.8 percent. This is less than one-third
the number of payroll jobs that would normally be
expected at this stage of an expansion.
As we have indicated in previous forecasts, the separate survey of households (which is mainly
used to calculate the unemployment rate) shows
significantly more job growth. Using this alternative
measure, the total number of jobs in California has
increased by over 300,000 in the past year, a more
respectable 2 percent growth. The discrepancy
between the two job measures may reflect an
increase in the number of individuals working as
independent contractors. Such workers would be
counted in the household survey but not necessarily
included in the survey of employers. While the higher
job growth totals in the household survey is
encouraging, its exact implications for the economy are
uncertain. This is because little is known from
the household survey about the nature of the nonpayroll jobs—for
example, whether they are full or part time, or their pay and benefit
levels. In any event, the reluctance of employers to expand their
permanent work force remains a concern in the outlook.
Looking ahead, we forecast that job growth will
improve modestly, from 0.9 percent in 2004 to 1.4 percent in 2005
(an increase of 210,000 jobs), as businesses step up hiring
to meet continued growth in output and sales. Over the
2006-through-2010 period, job growth is forecast to
average 1.7 percent per year (about 240,000 jobs annually), a
rate that is roughly consistent with projected adult
population growth and thus labor force expansion.
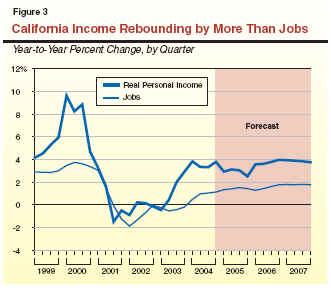
Personal Income Growth Has Been More
Positive. While California's job
performance has been disappointing, the recent rebound in personal
income has been more positive. As shown in Figure 3, after falling sharply in the 2001 recession, real
personal income growth jumped sharply to almost 4 percent
in early 2004, due to healthy increases in wages and
business earnings. Although we project a modest slowdown in
personal income during 2005, growth should remain in the solid
3 percent to 4 percent range through the forecast period.
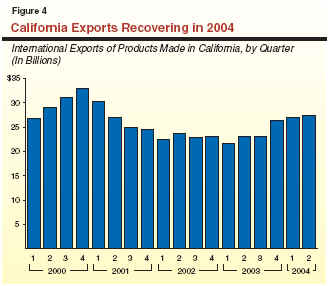
International Exports Finally
Improving. Exports are an important element
of California's economy. In 2003, international sales of
California-produced goods totaled about $95 billion, directly
accounting for about 7 percent of California's gross state
product. Over one-half of California's exports related to
high-tech goods, such as computers, electronics, and aerospace
products. Other key export categories include paper,
chemicals, and pharmaceuticals.
As shown in Figure 4, after lagging since 2001,
international exports jumped to a quarterly level of over $27 billion (over
20 percent growth) in the first half of 2004. Key factors
behind the growth are the declining value of the U.S.
dollar (which makes U.S. goods more competitive in
foreign markets), major growth in the economies of China and other developing nations on the
Pacific Rim, and a long-awaited acceleration in
Japan's economy. We expect export growth to continue
in 2005 and 2006, although at a slower pace than
in 2004.
A Key Factor In California's
Outlook—Housing. California's housing market has been booming,
as evidenced by record sales levels, dramatic price
increases, and strong levels of new construction. As
of September 2004, the median price of a detached single-family home in California was $465,000,
up over 20 percent from the prior year. Home
construction will likely exceed 200,000 units in 2004, the
strongest level in 15 years.
Our forecast assumes that prices will level off
and that sales and new construction will retreat
modestly from 2004 levels. As shown in Figure 5, we
assume that permits for new construction will fall slightly below 200,000 in 2005, and slide a bit
further to around the 180,000-to-190,000 range for
the remainder of the forecast period. Our forecast
assumes that interest rates will increase only
modestly, and that underlying population and income
growth result in continued strong demand for new
housing. This forecast is vulnerable, though, to a
larger-than-expected climb in interest rates. Given that
many recent home buyers are already financially
stretched by large mortgages, rising rates on variable
interest rate loans could further squeeze their
household budgets. For prospective buyers, such higher
rates would further reduce the affordability of new
homes, resulting in fewer sales and downward pressure
on home prices. These developments could depress
construction activity, and potentially reduce levels
of spending and income in other areas of the economy.
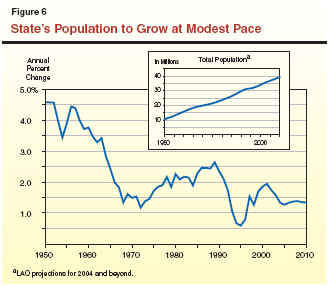
California's population currently totals
over 36 million persons. During the six-year forecast
period covered in this report, Figure 6 shows that the state's population growth is
projected to average about 1.3 percent annually. In terms
of numbers of people, this annual growth
translates into about half-a-million people and is
roughly equivalent to adding a new city the size of Long
Beach to California each year. As a result, California
will add roughly 3 million people over the forecast
interval and reach over 39 million by 2010.
The population growth rate we are projecting is somewhat slower than that experienced in the
late 1990s and early 2000s, when growth was
averaging about 1.6 percent. This reflects both the
dampening effects of the slower economy of recent years on
in-migration, plus a continuing downward trend in birth rates.
California's population growth can be broken
down into two major components—natural
increase (the excess of births over deaths) and
net in-migration (persons moving into California from
other states and countries, minus those leaving California for
out-of-state destinations). On average, these two components
have tended in the past to contribute about equally over time
to the state's population growth. However, their relative
shares can vary significantly from one year to the next
depending largely on the strength of the net in-migration
component—by far the most volatile element.
Natural Increase. We project that the
natural-increase component will average close to
300,000 new Californians annually over the forecast
period. This net natural gain reflects an annual average
of around 550,000 births partially offset by about 250,000 deaths.
Our forecast incorporates the well-documented trend of declining birth rates that has been
occurring for essentially all ethnic groups in recent
years in California. Despite these declining birth
rates, however, the number of new births in our
forecast actually trends up a bit through 2010. This is due
to significant growth in the female population of
child-bearing age groups in the faster-growing
segments of California's population, including Hispanic
and Asian women. As a result, even after accounting
for growth in the number of deaths occurring
annually in California, we project that the natural
increase component will grow slightly during the latter
half of the forecast period.
Net In-Migration. We project that combined
domestic and foreign net in-migration will average roughly 206,000 annually over the next six
years. This is weaker than during the latter half of the
1990s and early 2000s when annual net in-migration
averaged about 260,000. It also is considerably less
than the projected 300,000 natural-increase
component noted above.
Figure 7 shows our population growth projections by broad age categories, including both numerical and percentage growth.
Baby Boomers Swelling 45-64 Age Group. The 45-to-64 age group
(largely the "baby boomers") continues to be by far the
fastest growing segment of the population. Nearly 1.6 million additional people are expected in
this age category over the next six years.
Slow Growth for Children. At the other
extreme, slow growth is anticipated for preschoolers and
the K-12 school-age population. This reflects several
factors. One is the movement of children of the
"baby boom" generation beyond the upper-end of the 5-to-17 age group, which partially explains the above-average growth in the 18-24 age
category. Other factors include the slower rate of net
in-migration, and the decline in birth rates in recent
years that has reduced the number of children
moving into the preschool and school-age categories.
These various age-group demographic projections can have significant implications for the
state's revenue and expenditure outlook. For
example, strong growth of the 45-64 age group generally
benefits tax revenues since this is the age category
that routinely earns the highest wages and salaries.
Likewise, the growth in the young adult population
affects college enrollments, while that for the
0-to-4 and 5-to-17 age groups drives K-12
enrollment growth.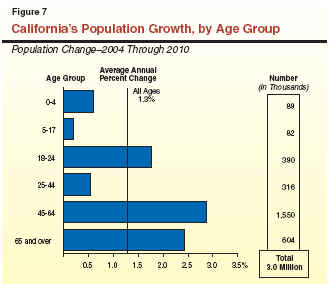
The revenues that finance California's state General Fund budget come from numerous sources, including taxes, fees, licenses, interest earnings, loans, and transfers. However, over 90 percent of the total is attributable to the state's "big three" taxes—the personal income tax (PIT), the sales and use tax (SUT), and the corporation tax (CT). In this chapter, we summarize our updated General Fund revenue projections and provide detail behind our key revenue-related assumptions.
Before presenting our revenue forecast, it is first useful to review where things currently stand in terms of recent revenue-related trends that serve as the "springboard" to our revenue projections.
Total cash receipts from major taxes during the first four months of this fiscal year have exceeded the 2004-05 budget projection by over $900 million, largely reflecting much-stronger-than-expected CT receipts. Despite the mild slowdown in overall economic activity that we are projecting for 2005, we believe that the stronger revenue trend will hold through the remainder of this fiscal year, and that total revenues through June 30, 2005, will exceed the budget estimate by slightly over $2 billion. About $430 million of this increase is attributable to final returns for 2003 tax liabilities, and thus will be accrued back to 2003-04. The balance will be reflected as higher revenues in the current year.
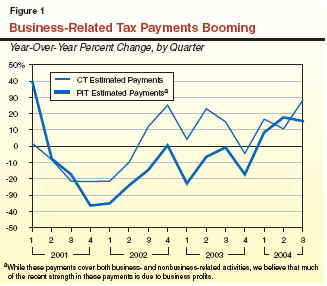
Figure 1 shows that estimated tax payments under the CT were up from the prior year by 28 percent in the third quarter of calendar-year 2004. These higher payments were primarily attributable to large increases by firms in the petroleum, finance, and high-tech manufacturing industries. The figure also indicates that PIT-related estimated tax payments were up by over 15 percent in the third quarter from the same time in the prior year. We believe that this increase was likewise due to strong business payments—in this case, those related to earnings of the subset of businesses that file under the PIT (such as S-corporations, partnerships, and sole proprietorships).
Revenue collections from other sources have been growing at a more subdued, but still healthy, rate in 2004. For example, Figure 2 shows that after a strong performance in late 2003 and early 2004, the growth in PIT-related withholding payments—which are attributable to employee wages, salaries, stock options, and bonuses—moderated to about 6 percent as of the third quarter of 2004. These recent increases are generally consistent with solid wage gains but relatively subdued employment gains over the past year. We believe that some of the recent slowdown is related to a slackening of stock option-related activity since the stock market peaked in early 2004.
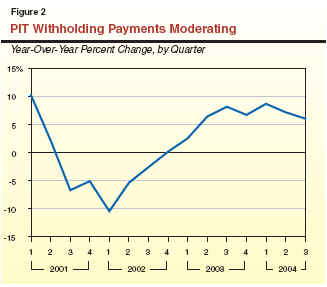
Figure 3 presents our updated revenue projections for the period 2003-04 through 2009-10.
|
Figure 3 The LAO�s General Fund
Revenue Forecast |
|||||||
|
(Dollars in Millions) |
|||||||
|
Revenue Source |
2003-04 |
2004-05 |
2005-06 |
2006-07 |
2007-08 |
2008-09 |
2009-10 |
|
Personal Income Tax |
$36,200 |
$39,640 |
$42,210 |
$44,810 |
$47,960 |
$51,400 |
$55,050 |
|
Sales and Use Tax |
23,720 |
25,340 |
26,630 |
28,150 |
29,870 |
31,570 |
33,400 |
|
Corporation Tax |
7,480 |
8,730 |
9,170 |
9,730 |
10,270 |
10,860 |
11,510 |
|
Other Revenues and Transfers |
7,600 |
5,174 |
4,237 |
4,659 |
4,996 |
4,459 |
5,043 |
|
Total
Revenues and Transfers |
$75,000 |
$78,884 |
$82,247 |
$87,349 |
$93,096 |
$98,289 |
$105,003 |
|
(Percentage Change) |
� |
5.2% |
4.3% |
6.2% |
6.6% |
5.6% |
6.8% |
2003-04 Revenues. We estimate that revenues and
transfers totaled $75 billion in 2003-04. This is up $430 million from the 2004-05 budget
estimate. The increase is mainly due to
higher-than-expected payments related to CT and PIT final returns for 2003.
Even though many of these returns are filed in 2004-05,
under California's modified accrual system of revenue
accounting their associated payments are accrued back to 2003-04.
2004-05 Revenues. We project that revenues and
transfers will total $78.9 billion in 2004-05. This is up slightly
over $1.6 billion from the 2004-05 budget estimate. The
major taxes are up by $2 billion, mainly reflecting the
stronger-than-expected tax payments from business earnings
discussed above. Specifically, we estimate that CT taxes will be
up by about $1.2 billion in the current year and that PIT
revenues will exceed the budget estimate by about $670 million. We
also expect that sales taxes will exceed the budget estimate by just under $200 million.
The increase in major tax receipts will be
partly offset by lower receipts from nontax sources.
Specifically, we estimate that tribal gaming revenues
will total about $100 million in 2004-05 instead of
the $300 million anticipated in the budget. We also
expect that General Fund proceeds from asset sales will be $50 million, which is $164 million less
than assumed in the budget. Our estimates continue
to assume $560 million in General Fund revenues
from the sale of $950 million in pension obligation
bonds, which are subject to legal validation. (The
remaining portion of the bond proceeds shows up on
the expenditure side of the budget.)
2005-06 Revenues. We forecast that total
revenues and transfers will be $82.2 billion in 2005-06, a 2006-07 Through 2009-10. We project that
total revenues will increase at an average annual rate
of 6.3 percent, or slightly faster than the 6.1
percent average growth in personal income, during the
period. For this interval, we are projecting that
PIT revenues will grow moderately faster than the
overall economy, reflecting the interaction of rising
real incomes with California's progressive PIT rate
structure. In contrast, we are projecting receipts
from the remaining income sources to grow slightly slower than personal income during this period.
4.3 percent increase from the current year. This
relatively modest growth rate reflects the projected
economic slowdown in 2005 as well as a decline in
nontax revenues. As indicated in Figure 3, we estimate
that revenues from the major nontax sources will
fall from $5.2 billion this year to $4.2 billion next
year. This decline is related to the drop-off in
one-time revenues from pension obligation bonds, as well
as an assumed loan repayment to a transportation
special fund. Absent these special factors,
"underlying" revenues are expected to increase by a
moderately stronger rate of 5.8 percent.
The revenue totals shown in Figure 3 are affected by both the state's economy and numerous policy-related actions taken in conjunction with recent budgets. While the magnitude of these special factors in 2004-05 is considerably less than in the 2001-02 through 2003-04 period, they nevertheless will have a significant impact on both the revenue totals and the year-to-year changes in receipts for 2004-05 and beyond. Key examples of these special factors include:
As shown in Figure 4, special factors combined to raise General Fund revenues and transfers by about $4 billion in 2003-04 and by another $1.8 billion in 2004-05. In future years, the figure also shows that the impact of special factors will reduce annual revenues modestly, mainly because of the loan repayments that are due at various points in time.
We forecast PIT receipts will increase from $36.2 billion in 2003-04 to $39.6 billion in
2004-05. These estimates are up from the levels assumed
in the 2004-05 Budget Act by about $200 million
and $670 million, respectively. We project that PIT
revenues will grow moderately to $42.2 billion in 2005-06, and at an average annual rate of 6.9 percent during the balance of the forecast period.
Key Forecast Factors. Our upward PIT
revision from the 2004-05 Budget Act forecast is the net
result of three main factors:
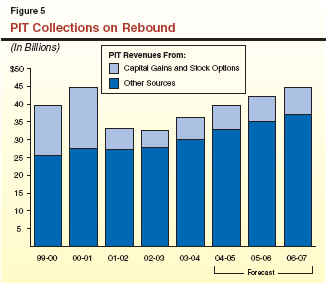
Capital Gains and Stock Options—Moderate Growth Assumed. Figure 5 depicts the important role that stock options and capital gains have played in the PIT revenue totals during recent years. It shows that the dramatic decline in revenues from these two sources—from nearly $17 billion in 2000-01 to below $5 billion by 2002-03—was the principal cause of the over-25 percent decline in total PIT collections during this period. It appears that revenues from these sources partially rebounded to $6.2 billion in 2003-04, but still remain at just over one-third of their 2000-01 peak. Looking ahead, we expect that revenues from these sources will grow by about 8 percent (to $6.7 billion) in 2004-05, and by roughly 6 percent to 7 percent in subsequent years, reflecting assumed moderate future gains in stock market valuations.
We estimate that SUT receipts will total $25.3 billion in 2004-05, a 6.8 percent increase from the
prior year. Our updated forecast is up by $194 million from the 2004-05 Budget Act. We
project that SUT receipts will grow further to $26.6
billion in 2005-06, and at an average annual rate of 5.8
percent during the balance of the forecast period.
Key Forecast Factors. The main determinant
of SUT receipts is taxable sales. About two-thirds
of these sales are related to retail spending by
consumers and the remainder is related to building
materials that go into new construction and to
business-to-business transactions.
Taxable sales grew by slightly more than 6 percent during the first half of calendar-year
2004, which was nearly double the pace for all of
2003. The main factors responsible for the
acceleration are: (1) increases in both the prices and sales
quantities of lumber and building materials, (2) the
sharp rise in gasoline prices, (3) strong increases in
equipment spending by businesses, and (4)
continued moderate growth in retail spending by
consumers. For 2004 as a whole, we project that taxable
sales will be up by 6.4 percent from the prior year.
Looking ahead, we anticipate that sales growth will
slow to 5.6 percent in 2005, reflecting the negative impacts
of higher interest rates and gasoline prices on both
consumer confidence and household spending on sales
of nongasoline goods. In subsequent years, we project
that taxable sales will increase at an average annual rate of
5.9 percent through the end of the forecast period. This
reflects moderate gains in consumer spending and
continued healthy growth in business investment.
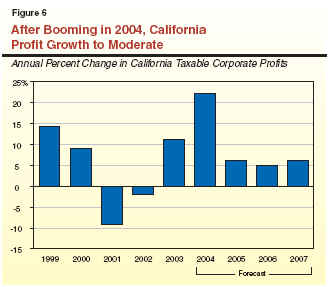
We estimate that CT receipts will increase
from roughly $7.5 billion in 2003-04 ($200 million
more than assumed in the 2004-05 Budget Act) to $8.7
billion in 2004-05 (up by $1.2 billion from the
2004-05 Budget Act estimate). We forecast that CT tax
receipts will grow to $9.2 billion in 2005-06, and will increase at an
average annual rate of 5.8 percent during the remaining
four years of the forecast.
Key Forecast Factors. Two categories of
factors are of special importance in our updated forecast
of CT receipts:
Regarding NOL deductions, legislation
passed in conjunction with the 2002-03 Budget
Act suspended NOL deductions for both 2002 and
2003. This legislation, however, also reinstated the
deductions in 2004, with the percentage of losses that
can be deducted against future earnings
permanently increasing from 65 percent to 100 percent
effective beginning in 2005. These provisions raised
revenues by $600 million in 2003-04. We estimate that
the reinstatement and expansion of NOLs will
reduce collections by about $300 million in 2004-05 and
by modestly higher amounts in subsequent years. We would note, however, that there is considerable
uncertainty surrounding this estimate. This is
because the exact timing and amount of losses from
2002 and 2003 that will be used to offset future tax
liabilities is not known.
Regarding the MIC, the statute creating this credit in 1994 contained a provision stating that
the credit would sunset following any year after 2000
in which the cumulative growth in manufacturing
jobs (excluding aerospace) from 1994 was less than 100,000. Manufacturing jobs fell below this
threshold in 2003, triggering the expiration of the
MIC effective January 1, 2004. The elimination of
this credit boosted CT revenues by $40 million in
2003-04, $195 million in 2004-05, and by
additional annual amounts increasing to over $400 million
by the end of the forecast period.
This category encompasses all remaining
General Fund revenue sources. It includes taxes on
insurance, alcoholic beverages, estates, and
cigarettes. It also includes various fees, interest on
investments, asset sales, pension bond proceeds, as well as
loans and transfers from special funds. Absent special
factors, we would expect revenues from these
categories to currently total roughly $4.5 billion.
However, this category has been much larger in
recent years, due to various one-time solutions adopted
to address the budget shortfall.
As shown previously in Figure 3, combined receipts in this category totaled $7.6 billion in
2003-04, of which $2.2 billion was related to the
proceeds of a tobacco securitization bond sale. The
total drops off to $5.2 billion in 2004-05, reflecting
a smaller, though still significant, amount of
one-time revenues from pension bonds. Projected
revenues from the nonmajor tax sources falls further to $4.2 billion in 2005-06, and then fluctuates
between roughly $4.5 billion and $5 billion over the
balance of the forecast period. The annual totals shown
reflect steady-though-modest increases in tax and
fee revenues, and incorporate various scheduled
loan repayments from the General Fund to special
funds over time.
In this chapter, we discuss our General Fund expenditure estimates for 2003-04 and 2004-05, as well as our projections for 2005-06 through 2009-10. We first look at general budgetary trends and then discuss in more detail our expenditure projections for individual major program areas.
Figure 1 shows our forecast for major General Fund spending categories. We forecast that General Fund expenditures will grow from $79.5 billion in 2004-05 to $89.5 billion in 2005-06, an increase of 12.6 percent. Roughly one-half of this large increase is an anomaly related to one-time savings in 2004-05 that temporarily depress General Fund expenditures in that year. These savings include the use of deficit-financing bond proceeds to support General Fund programs, the assumed use of pension obligation bond proceeds to cover a portion of the state's retirement contributions, the deferral of mandate payments to localities, a deferral of Proposition 42 transportation payments, and a delay in cost-of-living adjustments (COLAs) for CalWORKs and SSI/SSP recipients.
|
Figure 1 Projected General Fund
Spending for Major Programs |
|||||||||
|
(Dollars in Millions) |
|||||||||
|
|
Estimated |
|
Forecast |
Average
Annual Growth From |
|||||
|
2003‑04 |
2004‑05 |
2005‑06 |
2006‑07 |
2007‑08 |
2008‑09 |
2009‑10 |
|||
|
Education
programs |
|
|
|
|
|
|
|
|
|
|
K-14�Proposition 98 |
$30,277 |
$33,693a |
|
$36,300 |
$38,767 |
$40,252 |
$42,216 |
$43,831 |
4.8% |
|
CSU |
2,630 |
2,448 |
|
2,456 |
2,529 |
2,611 |
2,700 |
2,810 |
3.4 |
|
UC |
2,868 |
2,721 |
|
2,667 |
2,766 |
2,874 |
2,987 |
3,093 |
3.8 |
|
Financial aid |
672 |
637 |
|
839 |
892 |
952 |
1,007 |
1,047 |
5.7 |
|
Health
and Social Services |
|
|
|
|
|
|
|
|
|
|
Medi-Cal benefits |
$9,254 |
$11,214 |
|
$12,169 |
$12,858 |
$13,637 |
$14,416 |
$15,056 |
5.5% |
|
CalWORKs |
2,053 |
2,187 |
|
2,220 |
2,402 |
2,550 |
2,763 |
2,984 |
7.7 |
|
SSI/SSP |
3,157 |
3,474 |
|
3,740 |
4,032 |
4,296 |
4,559 |
4,847 |
6.7 |
|
IHSS |
1,117 |
1,181 |
|
1,330 |
1,483 |
1,649 |
1,829 |
2,025 |
11.1 |
|
DDS |
1,964 |
2,220 |
|
2,426 |
2,669 |
2,881 |
3,158 |
3,468 |
9.3 |
|
Other major programs |
5,005 |
5,107 |
|
5,670 |
5,871 |
5,873 |
6,107 |
6,346 |
2.9 |
|
Department
of Correctionsb |
$4,594 |
$5,557 |
|
$5,797 |
$6,074 |
$6,252 |
$6,414 |
$6,588 |
3.2% |
|
VLF-related
payments |
$2,839 |
� |
|
� |
$1,187c |
� |
� |
� |
� |
|
Prop
42-related payments |
$289 |
� |
|
$1,280 |
$1,351 |
$2,774 |
$2,459 |
$1,476 |
3.6% |
|
Local
mandate reimbursements |
� |
� |
|
$254 |
$588 |
$602 |
$616 |
$630 |
25.5% |
|
Retirement-related
payments |
$1,083 |
$1,901 |
|
$2,360 |
$2,574 |
$2,869 |
$3,157 |
$3,424 |
9.8% |
|
Debt
service |
$2,307 |
$3,538 |
|
$3,949 |
$4,411 |
$5,083 |
$5,657 |
$5,797 |
10.1% |
|
Deficit
bond proceedsd |
$2,012 |
-$2,012 |
|
� |
� |
� |
� |
� |
� |
|
Other
programs/costs |
$5,527 |
$5,660 |
|
$6,084 |
$6,661 |
$6,803 |
$7,071 |
$7,373 |
4.9% |
|
Totals |
$77,649 |
$79,526 |
|
$89,540 |
$97,114 |
$101,958 |
$107,115 |
$110,793 |
5.5% |
|
|
|
|
|
|
|
|
|
|
|
|
|
|||||||||
|
a
2004-05 total reflects appropriations to date. Reserve
funds for Proposition 98 total 1.4 billion. Projections for subsequent
years, however, assume that reserve funds are appropriated. |
|||||||||
|
b
Reflects employee compensation costs. |
|||||||||
|
c
VLF �gap� loan repayment to local governments. |
|||||||||
|
d
Of the amount authorized by the voters in Proposition 57,
about $3.5 billion remains available. |
|||||||||
Moderate Total Growth Projected. The right-hand column of Figure 1 shows our projected
average annual growth in expenditures for major
programs from 2005-06 through 2009-10. We forecast that total spending will increase by an average
rate of 5.5 percent over the period, or slightly less
than statewide personal income growth. This
average growth rate, however, masks divergent
trends among the different individual program areas
that make up the total. Annual spending totals
during the final four years of the forecast period are
affected by deferred payments to local governments and transportation special funds making
year-to-year comparisons difficult.
Highlights for Individual Program
Areas. With regard to some of the major individual
program areas in the budget, the figure shows that:
In the sections that follow, we provide a more detailed discussion of the expenditure outlook for these and other individual major program areas.
State spending for K-14 education (K-12
schools and community colleges) is governed largely
by Proposition 98, passed by the voters in 1988.
Proposition 98 is funded from the state General Fund
and local property taxes, and accounts for about
three-fourths of total support for K-14 education. The
remainder is from a variety of sources including
federal funds, lottery revenue, community college
fee revenues, and other local revenues. Generally,
the Proposition 98 guarantee is increased annually
by the growth in K-12 pupil attendance and the
growth in the economy.
California's public K-12 education system consists of more than 1,000 locally governed school
districts and county offices of education serving
about 6.3 million K-12 students. In addition, these
entities serve infants and preschool students receiving
child care and individuals in adult education
programs. The California Community Colleges (CCC)
provide instruction to about 1.2 million
full-time equivalent students at 109 colleges operated by
72 locally governed districts.
Figure 2 displays our projections of the Proposition 98 minimum guarantee—as well as its General Fund and local property tax funding components—throughout the forecast period. The forecast shows steady increases in funding for K-14 education—between $2.5 billion and $3.2 billion in annual growth. Much of the cost of meeting the minimum guarantee is supported by increased local property tax revenues, which we forecast will grow by $1.2 billion to $1.3 billion annually.
|
Figure 2 The LAO Proposition 98
Forecast |
|||||||
|
(In Billions) |
|||||||
|
|
2004-05 |
2005‑06 |
2006‑07 |
2007‑08 |
2008‑09 |
2009‑10 |
|
|
Budget
Act |
Revised |
||||||
|
Proposition 98 |
|
|
|
|
|
|
|
|
General Fund |
$34.3a |
$35.1b |
$36.3 |
$38.8 |
$40.3 |
$42.2 |
$43.8 |
|
Local property tax |
13.0 |
13.2 |
14.6 |
14.6c |
15.7 |
17.0 |
18.2 |
|
Totals |
$47.3a |
$48.3b |
$50.9 |
$53.3 |
$56.0 |
$59.2 |
$62.0 |
|
Growth |
� |
� |
$2.6 |
$2.5 |
$2.7 |
$3.2 |
$2.8 |
|
|
|||||||
|
a
Assumes appropriation of a $302 million Proposition 98 reserve. |
|||||||
|
b
Assumes appropriation of a $1,357 million Proposition 98 reserve. |
|||||||
|
c
The state will transfer $1.3 billion of local property tax
revenues from schools to local governments in 2006-07. This transfer
roughly offsets the growth of local property taxes for schools in this
year. |
|||||||
Forecast for the Prior Year. An increase in 2003-04 General Fund revenues (see Chapter 3)
results in a $210 million increase in the
Proposition 98 minimum guarantee for that year. The state
will eventually have to provide the additional
$210 million to "settle up" the Proposition 98 guarantee
for 2003-04. However, as part of the budget package
for 2004-05, Chapter 216, Statutes of 2004 (SB
1108, Budget Committee), delayed all settle-up
obligation payments for fiscal years 1995-96 through
2003-04. The delay effectively transforms these
obligations into a loan from Proposition 98 to the General
Fund. Chapter 216 establishes a repayment plan for
this loan, providing $150 million annually beginning
in 2006-07 until the loan is repaid. The estimated
increase of $210 million we forecast is on top of
$1 billion the state already owes to Proposition 98 for
these prior years.
We estimate that local property tax revenues
for 2003-04 increased by $135 million. These
additional funds will reduce the General Fund costs of
Proposition 98 for 2003-04 by a similar amount.
Forecast for the Current Year. Chapter 213,
Statutes of 2004 (SB 1101, Budget Committee), suspended the Proposition 98 minimum guarantee
for 2004-05, providing for spending that is
$2 billion less than would otherwise be required. We
project the 2004-05 suspension will result in annual
savings, growing from $2 billion in 2004-05 to
$2.5 billion by the end of the forecast period. When the
budget was adopted, the state assumed that the
Proposition 98 minimum guarantee would have
been $49.3 billion. Given the suspension, the 2004-05
budget package included $47.3 billion in
Proposition 98 funding (recognizing a $302 million
Proposition 98 reserve).
If the state is to meet the target of providing $2 billion less than the Proposition 98 guarantee,
we estimate it would now need to appropriate an
additional $1.4 billion in 2004-05. Figure 3
summarizes the components of this increase. First, the
Legislature would need to appropriate the $302 million
in the Proposition 98 reserve. Second, we now
forecast that the Proposition 98 minimum guarantee has
increased by $986 million since the budget
was adopted. The increase in the minimum guarantee
is the net effect of two main factors—additional
General Fund revenues and lower K-12 attendance.
We estimate that 2004-05 General Fund tax revenues are $2 billion higher than assumed in the
2004-05 budget package, and that attendance growth is
about a quarter percent lower than assumed in the
budget. Finally, we estimate that forecasted
2004-05 Proposition 98 spending will fall by around
$70 million because lower K-12 attendance growth will
reduce the continuous appropriation for school districts' and county office
of educations' revenue limits. Since less
Proposition 98 resources will be spent on revenue limits, the
state would need to reallocate the $70 million for a
different K-14 use. For purposes of this forecast, we
assume the Legislature provides the additional
$1.4 billion in funding in 2004-05, building the base upon which future Proposition 98 funding increases are added. However,
in the nearby box, we discuss options that the
Legislature has to address current-year Proposition 98
funding given the state's overall fiscal condition.
Figure 3 Additional K-14 Spending
Needed (In Millions) 2004‑05 Budget Act Proposition 98
reserve $302 Increase in guarantee 986 Revenue limit adjustment 70 Total $1,357 a
Assuming the state provides $2 billion less than the minimum
guarantee, per Chapter 213, Statutes of 2004.
Chapter 213 suspended the Proposition 98 guarantee for 2004-05. It also included language that
the state would provide $2 billion less than required by the Proposition 98 minimum guarantee.
Chapter 213, in effect, signals the intent of the Legislature to appropriate additional funding if the
Proposition 98 guarantee increases (as we are forecasting). Because the statute does not provide specific
appropriation authority to meet this requirement, the Legislature would have to take positive action in
the future to do so. Absent such action, the minimum guarantee would "default" to the current level
of appropriations. Because of the language in Chapter 213, we developed our Proposition 98 forecast
assuming that the Legislature would appropriate an additional $1.4 billion in the current year. This amount
increases the Proposition 98 base, resulting in comparable increases in each out-year of the forecast.
Given the state's projected large, ongoing budget problems (see Chapter 1) and the suspension
of the guarantee which has already occurred, we would encourage the Legislature to reconsider the
funding goal laid out in Chapter 213 and instead leave 2004-05 Proposition 98 funding at its current level
of appropriations. (This could be accomplished either by specifically amending Chapter 213 or by
simply not making additional Proposition 98 appropriations in the current year.) This option would
save $2.8 billion in 2004-05 and 2005-06 combined, yet would not reduce the current level of
educational services. In 2005-06, the increase in the Proposition 98 guarantee would fully fund the base program
as adjusted for growth and cost-of-living adjustments (COLAs) and still support limited additional
spending. In the out-years of the forecast, Proposition 98 would provide enough to pay for growth
and COLAs, eliminate the education credit card debts (discussed later in this section), and begin to
expand K-14 programs. While we recognize there are a range of options which the Legislature could
consider regarding Proposition 98 in the current year, we believe this option would not only provide for
reasonable growth in school spending, but would reduce the pressure to suspend Proposition 98 again in
the near future. Forecast for the Budget Year. For 2005-06, we
estimate the Proposition 98 minimum guarantee
will total $50.9 billion. This is $2.6 billion
(5.4 percent) more than we forecast for 2004-05, and
$3.9 billion (8.3 percent) more than provided in the
2004-05 Budget Act. For 2005-06, we forecast that K-14
local property tax revenue will increase by
$1.35 billion. Thus, General Fund costs of meeting the
Proposition 98 minimum guarantee will grow by
$1.25 billion (3.4 percent) from the revised 2004-05
estimate. The slow growth in General Fund costs is a
combination of fast growth in local property tax
revenues and slow K-12 attendance growth.
Out-Years' Forecast. For the remainder of
the forecast period, we estimate that annual growth
in total Proposition 98 spending will average
$2.8 billion (5.1 percent). Strong property tax growth
averaging $1.2 billion annually (8.2 percent) helps
reduce the impact on the state budget, resulting
in General Fund support for Proposition 98
growing around $1.6 billion annually (4 percent).
Proposition 49 Trigger. Approved by voters
in 2002, Proposition 49 requires that the state
appropriate additional funding for after school
programs beginning in 2004-05 if certain conditions are
met. Specifically, the state must appropriate up to an
additional $428 million for after school programs
if total state spending reaches a specified
threshold. Based on our revenue forecast, the state would
not be required under Proposition 49 to augment
after school programs until 2008-09. When the trigger
is reached, Proposition 49 requires that the
additional $428 million be appropriated
above the Proposition 98 minimum guarantee. The additional
costs of funding Proposition 49 are factored into
the Proposition 98 growth estimates in Figure 2
starting in 2008-09.
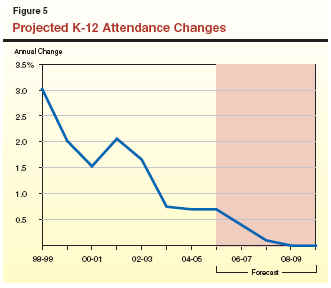
Key Forecast Factors. General Fund
expenditures for Proposition 98 depend on a variety of
factors—including K-12 average daily attendance (ADA),
per capita personal income, per capita General
Fund revenues, and local property taxes. Figure 4
summarizes our assumptions for these factors and
the K-12 COLA rate.
Figure 4 The LAO Proposition 98
Forecast Factors 2004‑05 2005‑06 2006‑07 2007‑08 2008‑09 2009‑10 Proposition 98 �Test� 2 2 2 2 2 2 Annual Percent Change K-12 average daily attendance 0.7% 0.7% 0.4% 0.1%
�
� Per capita personal income 3.3 4.6 4.3 4.6 4.8% 4.9% Per capita General Fund 7.2 4.4 4.4 5.0 5.0 5.0 State population 1.3 1.3 1.4 1.4 1.4 1.4 Local property taxes 9.4a 11.0 9.6a 8.2 7.8 7.0 K-12 COLA 2.4 3.4 3.0 2.6 2.8 2.9 a
Growth rates in 2004‑05 and 2006‑07 reflect the
underlying growth in school districts and community colleges property
tax revenues.
For our forecast:
To Meet Proposition 98 Targeta
Legislature's Current-Year Proposition 98 Options
The state has four main cost pressures to
continue currently required K-14 services over the
forecast period:
(1) growth in K-12 and community college attendance, (2) COLAs, (3) funding ongoing programs for which one-time funds were used in 2004-05, and (4)
funding Proposition 49 after school programs.
Figure 6 shows the annual growth in Proposition 98
resources over the forecast period, and the amount needed to fund these increases in base program costs.
|
Figure 6 Proposition 98 Funds
Available After Maintaining Base Programa |
||||||
|
(In Millions) |
||||||
|
|
2004-05 |
2005-06 |
2006-07 |
2007-08 |
2008-09 |
2009-10 |
|
Resources |
|
|
|
|
|
|
|
Increases in Proposition 98 funding |
$1,357 |
$2,593 |
$2,450 |
$2,674 |
$3,186 |
$2,809 |
|
Base Program Needs |
|
|
|
|
|
|
|
Growth and COLA |
� |
$2,186 |
$1,842 |
$1,693 |
$1,487 |
$1,511 |
|
Backfill for one-time spending |
� |
279 |
� |
� |
� |
� |
|
Proposition 49 |
� |
� |
� |
� |
428 |
�b |
|
Funds available for other purposesc |
$1,357 |
$129 |
$608 |
$981 |
$1,271 |
$1,299 |
|
|
||||||
|
a
Assuming the state provides $2 billion less than the minimum
guarantee, per Chapter 213, Statutes of 2004. |
||||||
|
b
Proposition 49 funded as part of base program beginning this
year. |
||||||
|
c
Such as program expansions or reductions in existing K-14
obligations. |
||||||
Proposition 98 Will Provide Significant Resources Beyond the Base Program. As Figure 6 also shows, Proposition 98 will provide significant new resources beyond those needed to maintain the base program. However, the state created large K-14 fiscal obligations for future years while addressing state budget problems in 2002-03 and 2003-04. Specifically, the state relied heavily on (1) one-time solutions, (2) borrowing from the future by deferring appropriations to future years to support current costs, and (3) a large limited-term reduction in general purpose funding for K-12. The 2004-05 budget provided some funding beyond base program growth and COLAs , but did not begin to address the overall size of these obligations to K-14 education. We have termed these obligations the "K-14 education credit card." Figure 7 shows that the state will face a credit card balance of almost $3.5 billion in K-14 costs in 2005-06, absent corrective actions.
|
Figure 7 K-14 Education Credit Card
Balance |
|
|
(Year-End Balance in Millions) |
|
|
|
2004‑05 |
|
One-Time |
|
|
Revenue limit and categorical deferrals |
$1,083 |
|
Community college deferrals |
200 |
|
Cumulative mandate deferrals |
1,524 |
|
Ongoing |
|
|
Revenue limit deficit factor |
$643 |
|
Total |
$3,450 |
These credit card costs include program funding deferrals, mandate deferrals, and K-12 revenue
limit "deficit factor." This latter obligation was
created when the state temporarily reduced revenue
limit payments to K-12 districts by $643 million in 2003-04. By 2006-07, current law requires the
state to provide the additional $643 million in
revenue limit funding.
Proposition 98 Growth Will Allow for
Program Expansion After Meeting Current
Obligations. If the Legislature meets the Proposition 98 target in
Chapter 213, providing an additional $1.4 billion in 2004-05, the growth in Proposition 98 funding
over the forecast period would allow the state to
maintain the base program and completely eliminate
the education credit card by 2006-07. This
scenario would leave significant resources for program
expansion. Alternatively, if the Legislature
maintains the current Proposition 98 funding level, the
state could still maintain the base program, eliminate
the credit card, and expand programs over the
forecast period. However, the level of program
expansion would be somewhat less.
In addition to community colleges, the
state's public higher education system includes UC
and CSU. The UC consists of nine general campuses
(including a new campus at Merced, which is
scheduled to open in fall 2005), one health sciences
campus, and numerous special research facilities. The
UC awards bachelor's, master's, and doctoral
degrees, as well as various professional degrees. Of the
segments, UC has almost exclusive jurisdiction
over public university research. The CSU consists of
23 campuses and several off-campus centers. The
CSU grants bachelor's and master's degrees and may award joint doctoral degrees with UC under
specified circumstances. Overall, state policy for
higher education is laid out in its Master Plan for
Higher Education, which was originally adopted in 1960.
The Spending Forecast. Our forecast assumes
cost increases which fully fund the projected impacts
of inflation and enrollment growth. As a result,
the segments' budgets grow by an average annual
rate of about 4.2 percent over the forecast period.
General Fund costs, however, grow somewhat more slowly, due to new revenue from the gradual
phase-in of an excess unit surcharge on students
(adopted as part of the 2004-05 budget). Including the
offsetting effect of that revenue, we project that
General Fund spending will increase from $5 billion in 2004-05 to $5.9 billion in 2009-10, for an
average annual increase of 3.8 percent over the period.
Key Forecast Factors. Our forecast is largely
based on three key factors.
Governor's
Compacts. Earlier this year the Governor
developed "compacts" with UC and CSU in which
he commits to seek certain funding increases for
the segments in his future budget proposals.
Because these compacts are neither in statute nor
formally endorsed by the Legislature, we have not
reflected them in our projections for spending at UC and
CSU. The nearby box explains the compacts in more
detail.
Cal Grant Costs Likely to Increase
Substantially. We estimate that General Fund spending for
financial aid programs administered by the Student
Aid Commission will increase from $637 million in 2004-05 to approximately $1 billion in 2009-10.
The bulk of the expected increase is attributable
to growth in the Cal Grant entitlement program, as well as our assumption that all Cal Grant
funding will be covered by General Fund revenue starting
in 2005-06. (In 2004-05, $147 million of Cal Grant
funding is being covered by surplus revenue
available from the Student Loan Operating Fund.) Since
2001-02, the Cal Grant entitlement program has
guaranteed financial aid to recent high school
graduates and community college transfer students under
24 years of age. Because it is still relatively new,
future participation rates remain uncertain. Over the
forecast period, our projections assume that student
participation will continue to grow somewhat
faster than student enrollment.
In May of this year, the Governor and the heads of UC and CSU agreed to pursue specific
annual funding goals for the university systems over the next six years. These goals were expressed in
"compacts," whereby the Governor committed to include the specified funding levels in his annual
budget requests, and the segments agreed to provide annual reports on a variety of activities and
outcomes. There is no clear link, however, between the compacts' funding targets and the Master Plan. In
addition, the Legislature was not party to these compacts, and thus we believe it should be guided by
its own priorities for the segments in its annual deliberations on the state budget.
The compacts seek base increases for the segments of 3 percent in 2005-06 and 2006-07, 4 percent
in 2007-08, and 5 percent for 2008-09 through 2010-11. Cumulatively, these rates would result in a
base funding increase of 21.6 percent during our forecast period. This is almost one and a half times
our estimate of inflation during the period.
The compacts also assume annual enrollment growth of 2.5 percent for both segments. Over
our forecast period, this would result in cumulative growth of 13.1 percent. This is considerably
higher than our estimate of 8 percent, which is based on demographic changes. The compacts also seek
additional, unspecified state funding to cover increases in debt service, retirement contributions,
and annuitant health benefits. Our projections assume such increased costs would be covered through
base inflation adjustments.
Finally, the compacts call for annual student fee increases of 8 percent in 2005-06 and 2006-07.
In subsequent years, the compacts assume fees will increase based on the change in per capita
personal income. The compacts assume that revenue from these fee increases will not offset state General
Fund support, but rather will add to the total funding available to the segments. In contrast, our
forecast assumes that fees will increase annually at the rate of inflation, thus ensuring that both fees and
the General Fund continue to fund their existing shares of total costs.
Overall, we estimate that the funding goals of the compacts would cost the state about
$1.3 billion more than our forecast of state spending for UC and CSU during the period. Similarly, student
fee levels under the compacts would be almost 20 percent higher by the end of the forecast period
than under our assumptions.
Governor's Higher Education Compacts
The Medi-Cal Program (the federal
Medicaid Program in California) provides health care
services to recipients of CalWORKs or SSI/SSP grants,
and other low-income persons who meet the
program's eligibility criteria (primarily families with
children and the elderly, blind, or disabled). The state
and federal governments share most of the program
costs on a roughly equal basis.
The Spending Forecast. We estimate that
General Fund spending for Medi-Cal local assistance
(including benefits, county administration of
eligibility, and other costs) will reach $12 billion in the
current year, about a $100 million increase over
the amount appropriated in the 2004-05 Budget
Act. The increase is mainly due to our estimate of
increased rates paid to nursing homes and increased
Medicare premium costs for persons enrolled in both
Medi-Cal and the federal Medicare program. These
increases are partially offset by
lower-than-anticipated caseloads for certain beneficiary categories.
We project that General Fund support would grow to $13 billion in 2005-06, an 8 percent
increase from current-year expenditures. This is largely
due to the General Fund backfill of two major
one-time technical funding changes that reduced
program costs in 2004-05. The full-year effect of prior
cost-reduction actions is assumed to partly offset
these additional costs. By the end of the forecast period
in 2009-10, we estimate that General Fund spending for Medi-Cal will reach $16 billion, an average
annual increase of 4.2 percent over the projection
period.
Key Forecast Factors. Several factors play a
significant role in our forecast:
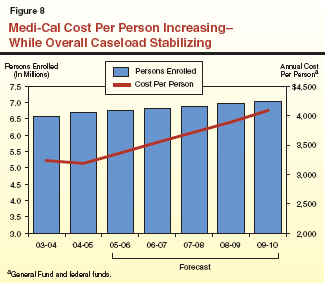
The Healthy Families Program (HFP)
implements the federal State Children's Health
Insurance Program, enacted in 1997. Funding generally is on
a two-to-one federal/state matching basis. The program offers health insurance to eligible children
in families with incomes below 250 percent of the
federal poverty level (FPL). To participate in HFP,
families pay a relatively low monthly premium and
are offered coverage similar to that available to
state employees. Beginning this year, the federal
government has also authorized the use of federal funds
to cover children up to age two in families with
incomes below 300 percent of FPL who have transferred
to HFP from the state's Access for Infants and
Mothers program.
The Spending Forecast. We estimate that
overall General Fund spending for HFP local assistance
will be $325 million in 2004-05. We further estimate
that overall General Fund spending for the program
will increase to about $360 million by 2005-06 and
that by 2009-10 the program will have an annual
General Fund cost of about $490 million. The
average annual growth in expenditures over the forecast
period is projected to be about 9 percent.
Key Forecast Factors. Compared to prior
years, the 2005-06 forecast reflects a greater growth rate
in program spending, which is due in part to
projected increases in medical costs. Our projection also
takes into account a policy change adopted as part of
the 2004-05 budget plan that partially offsets the
growth in program spending. Specifically, beginning in 2005-06, the premiums for children paid by
families with incomes between 201 percent and
250 percent of FPL will generally increase from the present
level of $9 per child to $15. Our projection takes into
account both revenues resulting from the premium increase and the effect of the increase on
program caseloads.
The state provides a variety of services and
supports to individuals with developmental
disabilities, including mental retardation, cerebral palsy,
epilepsy, autism, or other similar disabling
conditions. The DDS, which oversees the programs,
operates five developmental centers (DCs) and two
smaller facilities which provide 24-hour institutional
care, and contracts with 21 regional centers (RCs) to
coordinate and deliver community-based services.
The Spending Forecast. We estimate that
General Fund spending for developmental services
in 2004-05 will total $2.2 billion, the same amount
of funding appropriated in the 2004-05 Budget
Act. Of that total, about $1.8 billion will be spent by
RCs for community services and about $368 million,
excluding Proposition 98 funds, will be spent for
operating the DCs.
We further estimate that General Fund spending for developmental services will grow by about
9 percent in 2005-06 to approximately $2.4 billion.
Between now and 2009-10, we estimate that General Fund spending for the developmental
services program will grow by $1.3 billion and reach a
total of almost $3.5 billion. This expenditure growth
is due almost entirely to the RCs. We estimate
there will be various one-time administrative and
programmatic costs in 2006-07 as a result of the
closure of Agnews DC followed by an ongoing reduction
in DC operating costs. Spending for DCs is
projected to remain relatively flat over the rest of the
forecast period.
Key Forecast Factors. Our forecast of
significant growth in RC spending reflects historical
increases both in caseload and in the average cost of
serving each RC client. Specifically, our forecast assumes
that RC caseloads will continue to grow at an
annual average rate of 5.4 percent and that costs will
continue to grow at an annual average rate of
5.9 percent.
The CalWORKs program provides cash
grants and welfare-to-work services to families with
children whose incomes are not adequate to meet
their basic needs.
CalWORKs is primarily funded by state General Fund and federal funds that the state receives as
part of its Temporary Assistance for Needy
Families (TANF) block grant. In order to receive these
federal funds, the state must meet a maintenance of
effort (MOE) requirement, which is largely
satisfied through state and county spending on CalWORKs.
The Spending Forecast. General Fund
spending for the CalWORKs program is estimated to
be $2.2 billion in 2004-05, a $134 million increase
from the prior year. We project spending to increase
by $33 million in 2005-06 and an additional $181 million in 2006-07. For the remainder of
the forecast, we project that spending will increase
by an average of about 7.5 percent each year,
reaching a total of nearly $3 billion in 2009-10.
Key Forecast Factors. Our forecast
includes $222 million in 2005-06 for retroactive payment
of the October 2003 COLA for 2002-03 and 2003-04, because a district court has ruled that the
October COLA is required by current law. We note that
the administration has appealed this decision and a
ruling on this matter is expected in summer 2005.
The cost of retroactive COLA payments will be more
than offset by anticipated carryover of funds from
the prior year.
The substantial increase in General Fund expenditures in 2006-07 is due to the reduction in
available TANF carry-in from the prior year. The
increase in program costs in the out years is primarily due
to COLAs and small increases in grant costs
consistent with projected demographic changes.
Given the projected program spending and the reduction in available carry-in funds,
California would have to spend significantly above the
General Fund federal MOE requirement beginning in 2006-07 in order to fund the program at
current services levels without reducing grants.
Beyond the estimated reduction in unexpended federal TANF funds, our spending projection
is largely based on our caseload projections. Other
key assumptions include receipt of $3.7 billion in
federal TANF block grant funding and the state providing the statutory COLA (based on the increase
in the California Necessities Index) each year.
Caseload Trends and Projections. From
1994-95 through 2003-04, the CalWORKs caseload
declined by 48 percent. This decline in caseload is
attributable to a number of factors including the
strong economy of the late 1990s, annual reductions in
the teen birth rate, and CalWORKs program changes, which emphasized welfare-to-work services.
Since October 2002, the caseload has remained
relatively flat on a quarterly basis, with a quarterly average
of about 480,000 cases. The most recent caseload
figures (through July 2004) have shown a slight increase in caseload
beginning in March 2004. However, given the long period
of relatively flat caseload, our projection assumes that caseload
in the out years would remain stable, growing only by the
projected increase in 18 to 44 year olds (on average, about
1 percent annually).
The SSI/SSP provides cash assistance to eligible aged,
blind, and disabled persons. The SSI component is federally
funded and the SSP component is state funded.
The Spending Forecast. General Fund
spending for SSI/SSP is estimated to be $3.5 billion in 2004-05, an increase of 10 percent compared to
the prior year. For 2005-06, we project a 7.6 percent
increase, raising total expenditures to
$3.7 billion. From 2005-06 through 2009-10, spending for
SSI/SSP will increase by an annual average rate of
6.7 percent, eventually reaching a total of over $4.8 billion.
Key Forecast Factors. The two primary cost
drivers for SSI/SSP are caseload growth of about
2.7 percent and the cost of providing the statutory
COLA. The 2004-05 budget delayed the January 2005
state COLA until April 2005, but did "pass through"
the January federal COLA. For 2005-06,
annualization of the April COLA costs $74 million and the
January 2006 COLA amounts to an additional
$103 million. In 2006-07, total state COLA costs are
estimated to be $177 million. Beyond 2006-07, annual
COLA costs are expected to moderate to about
$120 million per year, primarily attributable to
anticipated reductions in the rate of inflation. Finally, we
note that beginning in 2006-07, the cost of providing
state-only SSI/SSP benefits to noncitizens who
immigrated to the United States after August 1996
substantially increases. This is because sponsor's income will
no longer be counted as an offset to the grant amount.
Caseload Trends and Projections. During the
late 1980s and early 1990s, the caseload grew
rapidly, with most of the growth in the disabled
component of the caseload. In the mid-to-late 1990s,
the caseload leveled off and actually declined in 1997-98, in part due to federal policy changes
which restricted eligibility. From 1998 through 2003,
the caseload grew at a steady rate of just over
2 percent per year. However, in the past year, caseload
growth has begun to edge up past 2.5 percent. Given
this recent modest up-tick in caseload growth and
anticipated growth in the aged population, we
project caseload growth to approach 3 percent by the
end of the forecast period.
The IHSS program provides various services
to eligible aged, blind, and disabled persons who
are unable to remain safely in their homes without
such assistance.
The Spending Forecast. General Fund spending
for IHSS is expected to be $1.2 billion in 2004-05, an increase
of 5.8 percent over the prior year and an increase of
2 percent above the current-year appropriation. For 2005-06,
we project that costs will increase by about 13 percent to a
total of $1.3 billion. For the remainder of the forecast, we
expect costs to increase an average of 11 percent each year,
resulting in General Fund expenditures of $2 billion in 2008-09.
Key Forecast Factors. In August 2004, the U.S.
Department of Health and Human Services approved California's proposed Section 1115
Medicaid waiver to provide federal financial
participation for approximately 75,000 state-only IHSS
recipients. This waiver results in General Fund
savings of $216 million during 2004-05 and is
authorized through 2008-09. For 2004-05, our
forecast includes approximately $16 million to cover
state costs associated with a wage increase for IHSS
workers recently granted by Los Angeles County and about $6 million for certain state-only IHSS
recipients who are not covered by the waiver.
In the budget year and beyond, the primary cost drivers for IHSS are caseload growth of
about 8.5 percent per year and increases in provider
wages. For this forecast, we have assumed annual
increases in state costs of $40 million per year as
counties gradually increase wages paid to IHSS providers.
Figure 9 presents recent trends and our
projections of IHSS costs per person. From 1996-97 through 2003-04, the cost per case more
than doubled, primarily due to increases in
provider wages and the hours of services provided to
recipients. We anticipate modest increases in the cost
per case during the projection period, with about
half of these increases supported through federal funds.
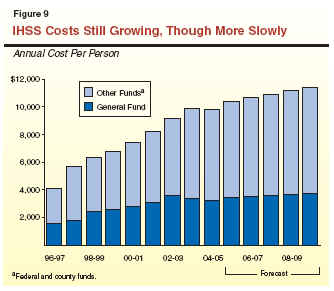
The major state judiciary and criminal justice programs include support for three departments in the executive branch—the California Department of Corrections (CDC), Department of the Youth Authority, and the Department of Justice—as well as expenditures for local trial courts and appellate courts. The two largest expenditure programs—CDC and Trial Court Funding—are discussed in more detail below.
The CDC is responsible for the incarceration
and care of adult felons and nonfelon narcotics
addicts at 32 state prisons. The CDC also supervises
and provides services to parolees released to the
community.
The Spending Forecast. The CDC
expenditures for 2004-05 are estimated to be about
$200 million more than appropriated in the budget primarily
due to delays in implementing policies aimed at
reducing the inmate population as well as parolee
recidivism. These policy changes include, for example,
the expansion of work credits to certain reception
center inmates, and the use of intermediate
sanctions for some parole violators who would otherwise
be returned to prison.
Spending is projected to increase by
4.3 percent to $5.8 billion in 2005-06, and by 4.8 percent
to $6.1 billion in 2006-07. For the remainder of the
forecast period, General Fund spending is projected
to increase by an average of 2.7 percent each year,
reaching $6.6 billion in 2009-10. This is a
substantially slower growth rate than in the past when
increases exceeded 10 percent. This slower growth rate
reflects a continuing trend of slower population growth
that began in the late 1990s, as well as recent policy
reforms targeting the inmate and parole
populations. (Our estimates for the forecast period include
adjustments for employee compensation increases,
but do not include General Fund support for
capital outlay and debt service, which are accounted
for elsewhere in our projections.)
During the forecast period, the department's General Fund costs are assumed to be partially
offset by $78 million in annual reimbursements
from the federal government for a portion of the
state's costs of housing undocumented immigrants
convicted of felonies in California.
Key Forecast Factors. The projected increases
in General Fund support for CDC are driven by a
combination of factors, including salary increases;
inflation on operating expenses and equipment; and growth in the prison population. During the
forecast period, salaries are projected to increase
by nearly $600 million, which represents about
56 percent of the total growth in General Fund
spending for the department between 2004-05 and
2009-10. Price adjustments for operating expenses and
growth in inmate health care costs are projected to
account for about 28 percent of the total increase. The
remainder (16 percent) consists of several factors,
including population growth; the implementation of health care improvements pursuant to court
orders; and costs for collection of DNA samples
pursuant to Proposition 69.
As Figure 10 shows, the prison population is
projected to increase by approximately 5,200
inmates during the forecast period. This relatively
slow growth (less than 1 percent annually) reflects a
recent trend of increasing court commitments,
partially offset by inmate population decreases that
are expected to result from recent policy changes
aimed at reducing the inmate population and parolee
recidivism.
The Trial Court Funding program
provides funds for support of the state's trial courts.
California has 58 trial courts, one in each county.
Chapter 850, Statutes of 1997 (AB 233, Escutia
and Pringle), shifted fiscal responsibility for the
trial courts from the counties to the state.
The Spending Forecast. Trial court
expenditures for 2004-05 are estimated to exceed the budget
appropriation by about $90 million in order to
fully fund court employee negotiated salary and
benefit increases. General Fund spending is projected to
increase by 13 percent to $1.5 billion in 2005-06,
in part due to the restoration of one-time funding
reductions. For the remainder of the period,
General Fund spending is projected to increase by an
average of about 8 percent each year, reaching
$2 billion in 2009-10. This is a faster growth rate than in
the past five years during which General Fund
spending increased an average of 4.5 percent each year.
Key Forecast Factors. Current law requires
that most of the trial court budget be adjusted by
the annual change in the state appropriations limit.
This requirement accounts for approximately
90 percent of the projected growth in funding for the
trial courts. Our projection also reflects a partial
offset due to increased revenues from court fees and
surcharges over the period.
The 2004-05 budget package enacted significant changes to state-local finance, including (1) a shift of $1.3 billion of city, county, special district, and redevelopment property taxes to K-14 school districts in 2004-05 and in 2005-06 for the fiscal benefit of the state and (2) a swap of $4.1 billion of city and county vehicle license fee "backfill" payments from the state for an equal amount of increased property taxes from K-14 school districts. These major changes to state-local finance enacted in the 2004-05 budget package are consistent with Proposition 1A, the local government revenue measure approved by the statewide electorate in November. As a result, we reflect these changes in the property tax revenue numbers in our Proposition 98 forecast.
Over the last three years, the state has
required cities, counties, and special districts to
implement several dozen state mandates, but deferred
funding to reimburse local governments for these
mandates to an unknown future date. In May 2004, the
State Controller reported the state owed over
$1 billion to cities, counties, and special districts for
mandated programs. The 2004-05 budget package and Proposition 1A enacted major changes
regarding state payment of noneducation mandate costs.
Specifically, Chapter 211, Statutes of 2004 (SB
1096, Committee on Budget), codified the state's
commitment to pay all outstanding city, county, and
special district mandate costs over a period of not
more than five years, beginning in 2006-07. In
addition, Proposition 1A amended the Constitution to
limit the state's options regarding payment of
local government's annual costs to implement noneducation mandates. Under Proposition 1A,
the Legislature must take one of the following
actions regarding every local government mandate: (1)
fully fund the annual cost of the mandate in the
budget, (2) include language in the budget suspending
local government obligations to carry out the
mandate in the fiscal year, or (3) repeal the mandate.
The only exception to this requirement is for noneducation state mandates relating to
employee rights.
The Spending Forecast. Given the new
statutory and constitutional provisions, we have assumed
that the state will pay the annual cost for all noneducation mandates (with the exception of
those the Legislature has suspended annually in the
past) beginning in 2005-06—about $250 million. We
also assume that the state will pay its outstanding
mandate liabilities in five equal installments
beginning in 2006-07—about $300 million annually.
While departments' budgets include base
costs for the compensation of state employees, the
budget typically includes a lump sum for any
additional compensation items that take effect in the
budget year. Most collective bargaining units
renegotiated existing contracts in 2003-04 to postpone
scheduled salary increases until 2004-05. As a result, the 2004-05 Budget Act includes $405 million from
the General Fund to pay for these costs in the
current year. For bargaining units that did not
renegotiate existing contracts, the budget did not
appropriate funds to pay for new spending provisions
included in those contracts. Instead, departments were
required to accommodate these increased employee costs within existing appropriations.
The Spending Forecast. For employee
compensation costs not already in departmental
budgets, we estimate that costs will increase from
$405 million in 2004-05 to almost $1.5 billion in
2009-10. This reflects the costs associated with existing
collective bargaining agreements and projected
compensation increases over the forecast period.
Key Forecast Factors. Most General
Fund-supported employees received a 5 percent salary
increase this year, with the state also paying 80 percent
of health insurance premiums. The major exception
is correctional officers (Unit 6) and their
supervisors and managers. Under the terms of a
renegotiated agreement approved earlier this year, this group
will receive:
We anticipate that as contracts expire, the state will incur additional employee compensation costs over the forecast period due to new collective bargaining agreements. In those years beyond scheduled pay raises, we assume compensation costs for all bargaining units will increase at the same rate as inflation.
In typical years, the budget includes funding
for state costs related to retirement in three areas: (1) contributions to the Public Employees' Retirement System (PERS), (2) contributions to the
State Teachers' Retirement System (STRS), and (3)
the state portion of retirees' health and dental
insurance premiums. In place of a portion of the
state's annual retirement contribution to PERS, the
2004-05 budget authorizes the issuance of a
$0.9 billion pension obligation bond. In addition, state
retirement law was amended this year with the intent
of generating savings to offset the debt service cost
of the bonds. Under the plan, the state will not
make retirement contributions for new employees for
two years. After the two-year period, these
employees will then choose whether to (1) transfer the funds
in their account to PERS or (2) cash out their
account. If an employee chooses to transfer the proceeds
to PERS, that employee will receive retirement
service credit for the two years. The state will bear any
additional financial liability (beyond the
transferred funds) for the retirement costs associated with
the two years of service. This increased liability will
be paid through increases in future employer
contribution rates.
The Spending Forecast. In 2003-04 and
2004-05, the state has reduced retirement-related expenses
by a total of $1.4 billion using one-time budget
solutions—through the pension bond and a
reduction in a scheduled payment to STRS. Beginning in 2005-06, the state will once again face its full
retirement obligations. From 2005-06 to 2009-10,
we project retirement-related costs will rise
steadily—by about $1 billion over the five-year period.
Key Forecast Factors. Last year, a Superior
Court ruled that the state could not sell a pension
obligation bond without voter approval. For the
purposes of our forecast, we have assumed that the
administration successfully issues the pension
obligation bond authorized in 2004-05. Another adverse
court decision, however, would worsen the state's
General Fund condition by $0.9 billion in 2004-05.
In future years, we project that state
retirement contributions to PERS will continue their
upward trend for the forecast period. This is because of (1) recent years' poor investment returns that
must still be fully recognized in contribution rates
(despite good returns in 2003-04) and (2) the
anticipated rate impact of the retirement changes for
new employees. With respect to STRS, we assume the
state contribution—a statutory percentage of
teacher payroll—will grow at the same rate as
Proposition 98 expenditures. Finally, we assume General Fund
expenditures for the state portion of retirees'
health and dental insurance premiums will grow with
medical inflation and enrollment. We estimate these
premium costs of $796 million in 2004-05 will grow
to $1.3 billion by 2009-10.
Punitive Damages. The 2004-05 Budget Act assumes that General Fund spending in 2004-05
will be offset by $450 million in punitive damage
award revenues transferred to the state. However,
based on our analysis of prior punitive damage
awards, our forecast assumes a significantly lower
General Fund offset of $60 million in both 2004-05 and
2005-06. The punitive damages provisions expire in
July 2006.
Other. The 2004-05 Budget Act
included $396 million in General Fund savings from:
To date, no specific savings have been identified by the administration. Consequently, any reductions in the current year would likely not produce full-year savings. Over the remaining forecast period, we project that savings will increase somewhat but still significantly fall short of the targeted amounts.
| Acknowledgments
The Legislative Analyst's Office (LAO) is a nonpartisan office which provides fiscal and policy information and advice to the Legislature. |
LAO Publications
To request publications call (916) 445-4656. This report and others, as well as an E-mail subscription service, are available on the LAO's Internet site at www.lao.ca.gov. The LAO is located at 925 L Street, Suite 1000, Sacramento, CA 95814. |