![]()
This report provides our projections of General Fund revenues and
expenditures for 2003-04 through 2008-09. It includes our independent assessment of the outlook for California's economy, demographics,
revenues, and expenditures.
Chapter 1 contains our principal findings and conclusions. Chapter 2 presents our economic and demographic projections, Chapter 3 our revenue
forecasts, and Chapter 4 our expenditure projections.
Our fiscal projections reflect current-law spending requirements and tax
provisions. They are not predictions of future policy decisions by the Legislature, nor are they
our recommendations as to what spending and revenue levels should be.
This report, in its ninth year of publication, reflects the historical mission of
the Legislative Analyst's Office to assist the Legislature with its fiscal planning by
assessing the revenues and expenditures of the state. The report is part of an
ongoing series and is updated periodically.
Chapter 1: The Budget Outlook 1
Chapter 2: Economic and Demographic Projections 11
Chapter 3: Revenue Projections 21
Chapter 4: Expenditure Projections 27
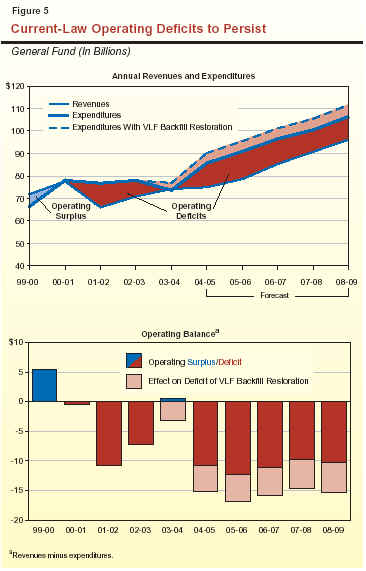
As was the case last year, California's policymakers will face a substantial challenge in crafting next year's General Fund budget. According to our updated projections, the state is facing a year-end shortfall of $10.2 billion in 2004-05 assuming the vehicle license fee (VLF) rate increase remains in effect, and substantially more if the rate is rolled back and the state resumes backfill payments to localities. Over the longer term, absent corrective actions, the state faces annual current-law operating deficits (that is, excesses of expenditures over revenues) that remain over $9 billion through the end of the forecast period—and $14 billion if the VLF rate is rolled back.
The persistent nature of the out-year
operating shortfalls—even in the face of an
improving economy—indicates that the state will not be
able to "grow its way out" of its budget problems
on the natural. The "good news," though, is that
the projected operating shortfalls do start to
narrow over time. This means that once the basic gap
between annual expenditures and revenues is closed by ongoing solutions, we would expect future
revenue growth to be sufficient to cover program
costs over the forecast period.
In the paragraphs below, we (1) briefly review the 2003-04 budget signed by the Governor
in August, (2) discuss the subsequent budget-related developments that have occurred, and
(3) present our updated budget projections for 2003-04 through 2008-09.
In confronting the 2003-04
budget, policymakers faced an enormous fiscal
shortfall that the administration estimated was as high
as $38 billion. This shortfall was the product of
three years' worth of major imbalances between
revenues and expenditures, which first opened up when revenues plunged during the 2001
economic downturn and stock market decline.
As Figure 1 shows, the majority of the
2003-04 budget solutions were clearly one-time in
nature, consisting of borrowing, deferrals, funding
shifts, and revenue accelerations. The budget plan
did include ongoing savings from various program
reductions and a VLF rate increase (the latter
triggered by the "insufficient funds" provision in
current law).
Figure 1 Main Elements of 2003-04
Budget Plana �
Borrowing and Deferrals ($18.3 billion) �
Deficit financing, pension obligation bonds. �
Local mandates, education, and transportation deferrals. �
Special funds loans. �
Program Savings ($9.2 billion) �
Education. �
Medical services and reimbursement rates. �
Social services cost-of-living adjustments. �
New/Accelerated Revenues ($4.5 billion) �
Tribal gaming. �
Tobacco securitization. �
VLF Rate Increase ($3.4 billion) �
Shifts to Other Funds ($4.1 billion) �
Federal funds. �
Fees. �
a
Dollar estimates as of time budget was enacted.
Ongoing Operating Shortfalls Not Fully
Addressed. Assuming that all of the budgetary
savings and borrowing actions included in the 2003-04 budget plan would be realized, that plan
estimated that the huge 2003-04 shortfall would be closed and the state
would end the year with a reserve of about
$2.2 billion. However, since so much of the adopted 2003-04
budget solution involved borrowing, deferrals, and
other one-time actions, it also was acknowledged that
the disappearance of such solutions the next year would leave a large
"budget hole" and thus a major operating shortfall
of roughly $10 billion would automatically reemerge
in 2004-05. The added debt-service costs
associated with repayment of the deficit financing and
pension bonds that the budget plan authorized also
contributed to the projected shortfall in 2004-05. Taking
into account the carryover $2.2 billion reserve
projected for the end of 2003-04, the year-end
2004-05 budget shortfall was expected to be about
$8 billion, absent further corrective actions.
As Figure 2 shows, there have been both positive and negative developments on the budget front since the summer that we have taken into account in updating our fiscal projections.
|
Figure 2 Developments Since the
2003-04 Budget�s Enactment |
|
|
|
Underlying Revenue Outlook Improving . . . |
|
�
Economy and stock market up. �
Recent tax collections higher-than-expected. |
|
. . . But New Tax Revenues Consumed by Other Budget
Related-Factors |
|
�
One-half of added revenues goes to Proposition 98. �
Pension obligation bonds invalidated by Superior Court. �
Tribal gaming revenues overestimated. �
Major deficiencies in Department of Corrections and Medi-Cal. �
Costs for Southern California fires. �
Shortfall in other budget savings. |
On the positive side, recent economic developments and cash receipts trends have been more favorable than expected. These positive developments, which are discussed in Chapter 2, include (1) a sharp improvement in business investment spending documented in the third quarter's gross domestic product report, which should benefit California firms; (2) healthy business earnings reports; and (3) higher state tax collections from withholding and quarterly estimated income tax payments during the first four months of 2003-04. As a result of these and other developments, we have revised upward our projections of major tax revenues by modestly over $2 billion in both 2003-04 and 2004-05.
On the negative side, however, the added revenues from these positive developments have been more than offset by added costs in the state budget. These include the effects on pension-related costs of an adverse court ruling involving the planned pension obligation bond sale, various costs related to the Southern California fires, higher Proposition 98 spending (triggered by the gains in revenues), and budget deficiencies in corrections, Medi-Cal, and state operations. In addition to these costs, we expect tribal gaming revenues to be considerably less than previously assumed.
Taking into account both the positive economic and revenue developments and the more-than-offsetting cost increases, the budget outlook is modestly worse than previously thought for 2003-04 and 2004-05 although modestly better over the longer term. Despite these recent developments, however, the key point for policymakers is the same as before—namely, the state faces a major mismatch between revenues and expenditures, and this will ultimately need to be addressed through spending reductions and/or revenue enhancements if the state is to regain fiscal balance.
Figure 3 presents our updated estimates of the General Fund's condition for 2002-03 through 2004-05. These estimates take into account our revised projections of current-law revenues and expenditures discussed in Chapter 3 and Chapter 4, respectively. The basis for our estimates, including their underlying methodology and assumptions, is summarized in the accompanying box (see page 7). The estimates shown in Figure 3 assume that the VLF rate increase (effective October 1, 2003) remains in effect in both 2003-04 and 2004-05, as provided for in current law. Our projections indicate the following.
|
Figure 3 LAO Projections of General
Fund Condition |
|||
|
2002-03 Through 2004-05a |
|||
|
|
2002-03 |
Forecast |
|
|
2003-04 |
2004-05 |
||
|
Prior-year fund balance |
-$1,983 |
$1,513 |
$2,003 |
|
Revenues and transfers |
70,852 |
74,165 |
74,968 |
|
Deficit financing bond |
10,675 |
� |
� |
|
Total
resources available |
$79,544 |
$75,678 |
$76,971 |
|
Expenditures |
$78,031 |
$73,675 |
$85,727 |
|
Ending fund balance |
$1,513 |
$2,003 |
-$8,756 |
|
Encumbrances |
$1,402 |
$1,402 |
$1,402 |
|
Reserve |
$111 |
$601 |
-$10,158 |
|
|
|||
|
a
Detail may not total due to rounding. |
|||
Vehicle License Fee (VLF)BackgroundThe state law enacting a VLF rate reduction beginning in 1999 included three accompanying
provisions which are of significance to the current fiscal outlook: (1)
it required that the state backfill local governments for their revenue losses resulting from the lowered rates, (2)
it required that the VLF rate be increased whenever there were insufficient moneys in the General Fund to pay for the backfill, and (3)
it stated that, from 2000-01 through 2003-04, California Work Opportunity and Responsibility
to Kids
(CalWORKs)
cost-of-living adjustments (COLAs) would be granted only in fiscal years in which VLF tax relief is granted.
Several VLF-related actions were taken in conjunction with the 2003-04 budget which are having
an impact on General Fund expenditures. In June 2003, the Director of Finance made the determination
that there were insufficient moneys in the General Fund for the backfill, thereby terminating backfill
payments and triggering a rate increase (from 0.65 percent to 2 percent) for VLF payments due on or after October
1, 2003. Backfill payments to local governments (with a few minor exceptions) ceased after June 20,
2003, saving the General Fund about $4 billion in 2003-04. The revenue loss to local governments during
the time period between when the backfill ceased and additional revenues from the rate increase started
flowing is being treated as a loan. The loan is scheduled to be repaid by mid-2006.
The 2003-04 budget included language which sets the VLF backfill at $1,000 for 2003-04, regardless
of the tax rate's level. Presumably, this language would hold the backfill to $1,000, absent legislative
action, even if the tax rate were rolled back this year. Also, because tax relief was eliminated, the CalWORKs
COLA for 2003-04 was suspended.
Our VLF Expenditure Forecast
Given the large operating shortfalls that we are projecting through 2008-09, we are assuming that
the "insufficient moneys" provision holds through the forecast period, and the higher VLF rate therefore
remains in effect as provided for in current law. Thus, our estimates include no VLF backfill payments
other than a loan repayment in 2006-07. We also include no 2003-04 COLA for CalWORKs recipients,
again reflective of current law.
What Happens if New Administration Rolls Back the VLF Rate?
The Governor-elect has stated his intent to roll back the VLF tax rate once he takes office. The fiscal impact of this rollback, particularly
in 2003-04, would depend on exactly how such a reduction were implemented. Figure 4 shows the potential effects
in 2003-04 under three alternative scenarios regarding the timing of the rollback and which
governmental level—the state or localities—bears the revenues losses from the rollback.
In Scenario A, the rate is rolled back effective February 1, 2004, but legislation is not passed which restores the backfill to local
governments. Under this scenario, local governments would shoulder the full cost of the rate reduction in
2003-04—$1.8 billion. In Scenario
B, the rate reduction is also effective February 1, 2004 but legislation is
passed restoring the backfill. Under this scenario, the State General Fund would bear the costs of the tax
reduction. In Scenario C, the rate reduction would apply retroactively to everyone that paid the higher rate in
2003-04, through a rebate mechanism. Assuming that the backfill is also restored, the 2003-04 cost to the
General Fund would be about $3.2 billion.
Figure 4 Potential Impacts of VLF
Rate Rollback in 2003-04a (In Billions) Vehicle
Owner Governmental
Cost State Localb Scenario A�Rate reduction effective February 1,
2004 but no backfill in 2003-04. $1.8 � $1.8 Scenario B�Rate reduction effective February 1,
2004 and backfill restored through legislation. 1.8 $1.8 � Scenario C�Rate reduction made 3.2 3.2 � a
Fiscal effects in subsequent years are identical for all
scenarios at $4.2 billion in 2004-05, $4.4 billion in 2005-06, $4.6
billion in 2006-07, $4.8 billion in 2007-08, and $5 billion in 2008-09. b
The cost shown is in addition to the $960 million reduction in
backfill payments already being
In all three scenarios, the out-year costs of a VLF rollback would be identical, as current law would
again require backfill payments to local governments beginning on July 1, 2004. These
backfill payments would be about $4.2 billion in 2004-05, increasing modestly in subsequent years.
Impact on CalWORKs Costs. The rollback of
the VLF rate would have no impact on General Fund
expenditures on CalWORKs in 2003-04. The additional costs
would be covered from federal reserve funds.
However, there would be costs of roughly $223 million
in 2004-05 and about $130 million in subsequent
years, as the federal reserves are depleted and the
added CalWORKs costs are borne by the General Fund.
|
||||||||||||||||||||||||||||||||||||||
Based on our updated projections, 2003-04 General Fund revenues will total $74.2 billion, expenditures will be $73.7 billion, and the year will end with a positive reserve balance of $601 million. This compares to the $2.2 billion reserve that was anticipated when the 2003-04 budget was enacted. If the VLF rate were rolled back and refunds were provided to motorists that have paid the higher rate since it went back into effect, current-year expenditures would be $3.2 billion higher than the baseline, and the year would end with a deficit of $2.6 billion, absent corrective actions. Please see nearby box for a discussion of the VLF situation and its potential fiscal impacts.
For 2004-05, revenues are projected to be $75 billion, or $10.7 billion less than the projected expenditure total of $85.7 billion. As a result of the reemergence of the mismatch between revenues and expenditures, the budget faces a year-end deficit of $10.2 billion, absent corrective actions. If the VLF rate increase were rolled back and the backfill resumed beginning this year (2003-04), the cumulative impact on the 2004-05 reserve would be a $7.4 billion deterioration—the $3.2 billion noted above for the current year and another $4.2 billion in 2004-05. (This assumes no other offsetting savings were achieved.) In addition, California Work Opportunity and Responsibility to Kids (CalWORKs) cost-of-living adjustment (COLA) costs would increase by $223 million. Thus, the rollback would increase the projected cumulative year-end shortfall for 2004-05 to $17.8 billion.
Figure 5 presents our revenue and expenditure forecasts through 2008-09, both with and without a rollback in the VLF rate. It indicates that, for example, assuming no rollback, the operating deficit grows to a peak of $12.3 billion in 2005-06. This primarily reflects the large scheduled repayment of a transportation loan and the resumption of local mandate reimbursements in that year. In the following three years, the gap narrows somewhat, as ongoing revenue growth modestly outpaces ongoing growth in program expenditures. As of 2008-09, however, the gap would still remain in the range of $10 billion assuming the VLF increase remains in place, and $15 billion if it is rolled back (the difference due to the amount of the backfill).
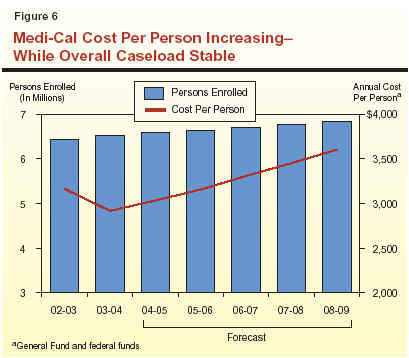
This is the third consecutive year that we have projected in our fiscal forecast a persistent current-law budget shortfall extending throughout the forecast period. This indicates that the state has not yet met the fundamental challenge of getting expenditures and revenues in line. In the preceding two reports, we also identified a group of budget-balancing principles, strategies, and tools that we again offer, as summarized in Figure 6 (see next page). Although the specific numbers in this year's report differ from those provided previously, we believe that these items still merit the Legislature's attention. This is because the state's basic budget problem is still essentially the same—namely, current-law expenditures exceed current-law revenues.
|
Figure 6 Basic Budget-Balancing
Principles, Strategies, and Tools |
|
Key Principles |
|
�
Wide range of budget solutions should be considered. |
|
�
Out-year repercussions should be assessed. |
|
�
Budget solutions should �make sense.� |
|
�
Current-year solutions should play a key role. |
|
Basic Strategies |
|
�
Determine the relative roles of spending and revenue
options. |
|
�
Identify the appropriate contributions of different
program areas. |
|
�
Establish the desired mix of one-time versus ongoing
solutions. |
|
�
Be cautious about additional borrowing. |
|
Individual Tools |
|
�
Spending-related options. |
|
�
Eliminate or modify programs. |
|
�
Suspend/reduce COLAs. |
|
�
Shift funding from the General Fund. |
|
�
Implement improvements and efficiencies. |
|
�
Revert or disencumber funds. |
|
�
Revenue-related options. |
|
�
Eliminate or modify tax expenditures. |
|
�
Broaden basic tax bases. |
|
�
Raise tax rates. |
|
�
Transfer special fund balances. |
|
�
Improve tax compliance and collections. |
Among other things, we recommend that the Legislature:
In the coming months, our office will be assisting the Legislature in developing possible budget-balancing expenditure and revenue strategies and options to help address both the large projected 2004-05 shortfall and the ongoing operating imbalances projected for future years.
Basis for Our EstimatesAs noted in past reports, our revenue and expenditure forecasts are based primarily on
the requirements of current law, including constitutional and statutory funding requirements
(such as the Proposition 98 funding guarantee). Our estimates also reflect projected changes in
caseloads, federal reimbursements, and other factors affecting program costs.
For the current forecast, we have also taken into account language included in the
2003-04 budget plan stating the Legislature's intent that the administration
not include certain funding adjustments in developing the 2004-05 budget. These include funding for: (1) University of
California (UC) and California State University (CSU) salary increases and enrollment growth; Our basic estimates included in Figure 3 assume that the VLF rate increase, triggered by
the insufficient funds provision of current law, remains in place through the forecast. Because
the Governor-elect has stated his intent to roll back the increase, we discuss the incremental impact
of that change separately. Our out-year estimates also include scheduled loan repayments to
special funds as well as payments to cover accumulated local government mandate claims.
Projections, Not Predictions. Our estimates are not predictions of what the Legislature
and Governor will adopt as policies and funding levels in future budgets. Rather, our estimates
are intended to be a reasonable "baseline" projection of what would happen if current-law
policies were allowed to operate in the future. In this regard, we believe that our forecast provides a
meaningful starting point for legislative deliberations involving the state's budget. |
As indicated earlier, the 2003-04 budget relied on a variety of different types of borrowing-related actions to help close the budget gap. Among others, these included the use of deficit financing and pension bonds, direct loans from special funds, deferrals of spending obligations such as for transportation and local mandates, tobacco bonds to accelerate the state's receipt of future revenues, and refinancing of existing general obligation bond principal repayments. Altogether, we estimate that there was close to $20 billion of these and other different types of borrowing incorporated in the adopted 2003-04 budget plan. This budget-related borrowing is in addition to the more traditional types of borrowing that use general obligation and lease-revenue bonds to finance the state's outlays for infrastructure and other capital needs, as well as the internal and external borrowing needed for cash-flow purposes.
Budget-related borrowing of course helps the General Fund's condition in the years when it
is undertaken. However, it generally is a one-time savings, and thus creates a "budgetary hole" to
fill the next year. In addition, the effect of borrowing eventually becomes a drag on the budget,
because debt service expenses for past spending will interfere with providing
current public services.
A significant portion of the General Fund operating shortfalls that we project for 2004-05
and beyond is associated with such debt repayments. For example, in 2005-06, debt service on
the deficit financing bond and the scheduled payment of the transportation loan totals about
$3.9 billion, or one-third of the projected operating shortfall for that year.
There is no "hard and fast rule" to identify what amount of borrowing is "right" for the
Legislature to use in addressing budget shortfalls. As a general policy, however, we believe that
budget-related borrowing—particularly from private markets—should be relied on only as a last
resort. Actions to bring spending and revenues into line should be the top priority.
This is not to say that there are no instances where some borrowing makes sense.
Examples might be when the size of a deficit is simply too large to handle all at once, or when a
budget shortfall will likely be quickly eliminated by a strongly rebounding economy. We do not
believe that either of these situations currently exists. Engaging in budget-related borrowing to avoid
spending cuts and tax increases, or to finance additional spending and tax cuts—is a slippery slope.
Given the large amount of budget-related borrowing already authorized, we caution
against the state engaging in new borrowing—particularly from private markets—to cover the
projected 2004-05 operating shortfall.
Economic and demographic developments are typically two of the most important determinants of California's fiscal condition through their impacts on both tax revenues and state expenditures. This chapter presents our economic and demographic projections for 2003 through 2009, which will affect California's fiscal condition during fiscal years 2003-04 through 2008-09.
We believe that California, like the nation,
has "turned the corner" economically and is
now embarking on a period of faster and more-balanced expansion as 2003 comes to a close.
This acceleration is due to (1) a long-awaited improvement in business investment
in computers, software, and other high-tech goods produced and designed in this state; and
(2) ongoing strength in home construction and consumer spending. A key assumption in
our outlook is that this faster economic expansion
will finally result in an improvement in the jobs outlook, which has lagged thus far during
the current rebound.
Our forecast assumes that the massive October fires in Southern California, while having
tragic personal and economic consequences for
those directly affected, will not have a major net
adverse impact on the overall state economy. We
anticipate that the loss in wealth and income in the
regions affected will be roughly balanced by a surge
in rebuilding financed by federal funds and
private insurance payments. Figure 1 (see next
page) summarizes the details of our economic
forecast. In subsequent sections, we discuss in more
detail major factors underlying our projections.
Figure 1 The LAO�s Economic
Forecast Percentage Change (Unless Otherwise Indicated) 2003 2004 2005 2006 2007 2008 2009 United States Real
gross domestic product 3.0% 4.2% 3.7% 3.7% 3.5% 2.9% 2.8% Personal
income 3.2 5.3 5.7 5.9 5.8 5.3 5.3 Wage
and salary jobs -0.3 1.1 2.4 1.8 1.5 1.1 1.2 Consumer
Price Index 2.4 2.0 2.4 2.5 2.6 2.6 2.7 Unemployment
rate (%) 6.1 6.1 5.9 5.8 5.7 5.6 5.6 Housing
starts (000) 1,775 1,680 1,640 1,620 1,640 1,620 1,590 California Personal
income 4.2% 5.9% 6.3% 6.2% 6.0% 5.9% 5.9% Wage
and salary jobs -0.4 1.3 2.6 2.2 1.9 1.7 1.6 Taxable
sales 2.4 5.9 6.3 6.2 5.9 5.7 5.7 Consumer
Price Index 2.8 2.3 2.7 2.7 2.8 2.8 2.9 Unemployment
rate (%) 6.6 6.1 5.6 5.5 5.6 5.5 5.5
New
housing permits (000) 188 179 180 178 175 173 170
2003 Through 2009
Although the recession officially concluded
in late 2001, the ensuing recovery was weak and unbalanced through 2002 and into early 2003.
Low interest rates and federal tax reductions kept consumer spending and housing activity on
an upward track. However, business spending and hiring remained soft during this period,
reflecting chronic overcapacity in many key industries,
weak foreign demand, and a loss of confidence by corporate executives who make
investment decisions.
The improvement in business spending finally materialized in the third quarter of this year
(see Figure 2). This increase, coupled with sharp
gains in consumer spending and strong housing construction, boosted real gross domestic
product (GDP) by a 7.2 percent annual rate in the
July-through-September period. Of particular importance to California was the
jump experienced in spending on computers and software, as the business sector began to
upgrade systems that had not been replaced since 1999.
Gross domestic product data on consumption and business investment are not available at the state level, so it is not possible to directly determine how the recent national improvement in GDP growth has affected our state. However, various industry and tax-related data suggest that California's economy clearly is participating in the national recovery. For example:
While these gains are encouraging, an important uncertainty concerning the durability of the current expansion—both at the national and state levels—is whether the recent improvements in spending and output will translate into more jobs in the months ahead. The jobs outlook is particularly clouded by the differing trends in employment data that the two main information sources are exhibiting, with the "household survey" showing growth but the "payroll survey" showing continued declines (see box on page 15). We examine California's job picture in more detail below, comparing its current performance to that of past recession/recovery periods and to the nation as a whole.
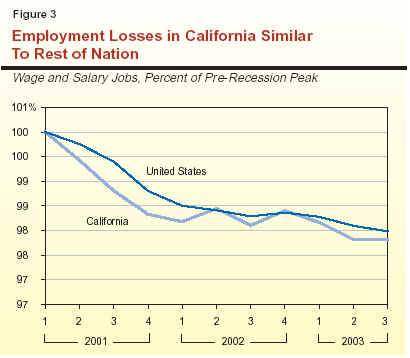
California Relative to the Nation. The job losses experienced in California since early 2001 (when the most recent recession began) are not out of line with the rest of the nation. As shown in Figure 3, the cumulative job loss over the past 30 months is about 2.2 percent in California, compared to 2 percent for the nation as a whole. Within California, the percentage reduction in the San Francisco Bay Area has been considerably greater than for the nation, but losses in Southern California and the Central Valley regions of the state have been proportionally less.
Current Performance Compared to Past
Recessions. As indicated in Figure 4, the
cumulative job losses associated with the 2001 recession
and its aftermath are roughly on a par with those
of the early 1980s' recession, but considerably
less severe than the early 1990s' downturn. In terms
of duration, however, job declines in the current period have been prolonged compared to the
1980s' experience. For example, the cumulative 2
percent decline in jobs during the 30 months following
the start of the 2001 recession compares
unfavorably to the 4 percent net gain in jobs that had
occurred 30 months after the beginning of the 1981 recession. In this regard, the current downturn
is more similar to the 1990s' recession.
Thus, while many indicators are pointing toward improved sales, production, and income
in the state, the lack of job growth thus far remains
a key concern regarding the durability of the expansion.
There are two surveys used to measure employment performance at the national and state
levels. The first is the household
survey, which is drawn each month from interviews with members of
a selected sample of households. The resulting data are then used to develop detailed estimates of
the employment and unemployment characteristics of individuals in the labor force. The second
source is the payroll survey, which is based on information collected from employers that file
withholding and unemployment insurance reports. These latter data are used primarily for estimates of
aggregate employment totals and job performance within various industry categories, and indeed are what
we are referring to in our discussion of current employment trends.
Historically, the above two employment series have usually moved in concert with one
another over economic cycles, although the household series has shown more month-to-month variation
due to its smaller sample size. As shown in Figure 5, however, the two series have significantly
diverged from one another in 2003, with the payroll survey showing year-to-year
declines averaging about
The payroll survey is traditionally considered to be a more reliable indicator of employment
trends due to its more extensive coverage and greater detail. However, at the present time, the
household survey seems to be more consistent with the more upbeat data on spending and production in
the economy. One of the possible explanations for the current difference between the two surveys'
results may be an increase in the use of contract
workers by employers that are reluctant to add to
their permanent workforce. These contract workers would show up in
the household survey as employed but may be excluded from
the industry survey, which is based on actual
company payrolls. While the contract jobs are more likely to be part time
and have less pay and fringe benefits than
traditional jobs, the growth in this sector provides
some positive evidence that businesses are taking
the first step toward renewed hiring.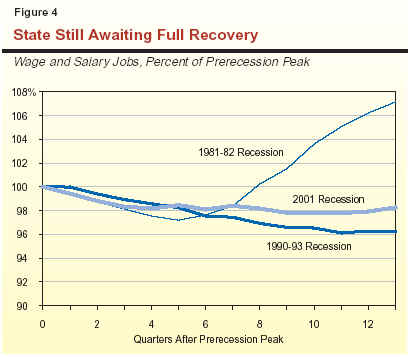
So—What's the True Picture Regarding Employment Strength?
0.5 percent, and the household survey showing year-to-year
increases averaging about 1.2 percent. A similar discrepancy is evident at the national level.
Our updated forecast assumes that
U.S. economic growth will pick up somewhat and expand at a very healthy pace through 2004,
before settling into a somewhat more moderate
though sustainable pace in subsequent years. During
the next year, the economy is expected to benefit
from continued improvements in business investment and foreign trade, as well as ongoing expansion
in consumer spending. Overall, we forecast that growth in U.S. GDP will accelerate from 3
percent in 2003 to 4.2 percent in 2004, before
moderating some in subsequent years. The unemployment
rate is projected to slowly decline from the current
level of around 6.1 percent down to 5.6 percent by 2008.
What About Large Budget Deficits? Clearly,
the large U.S. budget deficits that federal
officials project for the future imply that the
borrowing needs of the federal government will be
substantial in the years ahead. At present, U.S.
government borrowing is being easily accommodated in
the credit markets, due to the large amount of
liquidity in the financial system and the fact that
businesses have large amounts of cash on hand to finance
new investments. However, the large federal budget deficits will likely put upward pressure on
interest rates once private demand for borrowing picks
up. This will push interest rates slowly upward
over the forecast period, and these higher rates
will eventually work to moderate economic performance in such areas as business
investment, consumer spending, and housing activity.
We forecast that California's economy will
grow in line with the national economy over the
next several years, reflecting the positive effects
of improving business investment and foreign trade on our manufacturing and high-tech
service industries. After falling for most of 2003, we
expect that wage and salary employment will stabilize
late in the year and grow modestly in 2004 and thereafter. On an average annual basis, we
forecast that jobs will fall by 0.4 percent in 2003
before expanding by 1.3 percent in 2004 and 2.6
percent in 2005.
Reflecting the improvement in jobs, wages, and business earnings, we project that personal
income will accelerate from 4.2 percent this year to 5.9 percent in 2004 and 6.3 percent in 2005.
Finally, we forecast that taxable sales will accelerate
from 2.4 percent this year to 5.9 percent in 2004 and 6.3 percent in 2005. These projected strong
taxable sales gains are in part reflective of the
expected improvement in the roughly one-third of
taxable sales that are related to business spending.
We expect that housing construction will remain near current levels through the
forecast period. While this is well above the rates
achieved over the past decade, our projected pace
of residential building construction remains below what many economists consider the
amount needed to fully accommodate the state's
ever-expanding population. The shortfall between
the available supply and demand for housing, which is partly related to the limited availability
of developable land in key areas of the state,
will continue to put upward pressure on home
prices in future years.
We see two primary risks to the
near-term economic outlook. These involve:
Lack of Job Growth. While our forecast
assumes that the recent growth in business spending
and output will translate into added jobs in the
U.S. and California economies, we have yet to see
firm evidence that this is occurring. On the one
hand, the fact that businesses have been able to
increase output and sales without adding to the
workforce suggests that productivity gains in the economy
are even better than anticipated. This, by itself,
has positive implications for the long-term
achievable growth in output, income, and wealth in the
nation and state. However, persistent softness on the
job front poses a significant near-term risk, in that
the lack of job creation may undermine consumer confidence and spending, and in turn undercut
the economic expansion. The lack of job growth is
an especially significant risk in California,
where concerns about business costs could translate
into more out-of-state outsourcing and less
expansion in the state than would normally be
expected during a growth period.
Potential Home Price Bubble. A second key
risk to California's outlook involves the pattern
of extraordinary increases in home prices.
Following four years of uninterrupted increases, the
median home price statewide is now over $400,000,
with many major metropolitan areas being above $500,000. The key question this raises is
whether the state faces a home price "bubble" that
will deflate or even burst in the near future.
Many economists and real estate analysts currently believe that the price jumps being experienced
are not due primarily to speculative excesses.
Rather, they attribute them as largely reflective of
limited housing supply in many regional markets
and ongoing growth in the state's population.
However, there is no doubt that the recent price
increases make the housing market more vulnerable
to adverse economic developments than otherwise, such as a significant upturn in interest rates.
To the extent that the increased household wealth associated with home price increases has been
a positive factor underlying consumer spending during the past two years, a sharp reversal in
home prices could have a significant negative effect
in the future.
California's population currently totals
slightly over 36 million. During the six-year forecast
period covered in this report, the state's population
is projected to grow annually by about 1.3
percent, or close to half a million persons yearly. (This
is roughly equivalent to a city the size of Long Beach.) Thus, California will add
roughly 2.9 million people over the forecast interval
and reach almost 39 million by 2009.
The population growth rate we are projecting is somewhat slower than that experienced in
the latter part of the 1990s, when growth was
averaging about 1.6 percent. This reflects both
the dampening effects of the slower economy of
recent years on in-migration, plus a continuing downward trend in birth rates.
California's population growth can be
broken down into two major
components—natural increase (the excess of births over deaths) and
net in-migration (persons moving into
California from other states and countries, minus
those leaving California for out-of-state
destinations). On average, these two components have
tended to contribute about equally over time to the
state's population growth. However, their relative
shares can vary significantly from one year to the
next depending largely on the strength of the net
in-migration component—by far the most
volatile element.
Natural Increase. We project that the
natural-increase component will average about
275,000 new Californians annually over the forecast
period. This amount is slightly less than in the late
1990s and early 2000s, when it averaged about
295,000. This softening reflects the ongoing decline in
birth rates being experienced by all ethnic
groups. Despite these declining birth rates, however,
the natural-increase component still will grow
slightly during the latter half of the forecast period.
This is due to significant growth in the female population of child-bearing age groups in
faster-growing segments of the population,
including Hispanic and Asian women.
Net In-Migration. We project that net
in-migration will average nearly 215,000 annually over the next six years. This is weaker than
during the latter half of the 1990s and early 2000s
when annual net in-migration averaged about
260,000. It also is considerably less than the
projected natural-increase component. As shown in
Figure 6 (see next page), this reflects a projected drop
in domestic net in-migration that we believe
will follow California's period of economic
softness. In contrast, foreign net in-migration—which
has been relatively stable over the past decade and
has proved to be less sensitive to the
economy—is projected to remain relatively flat.
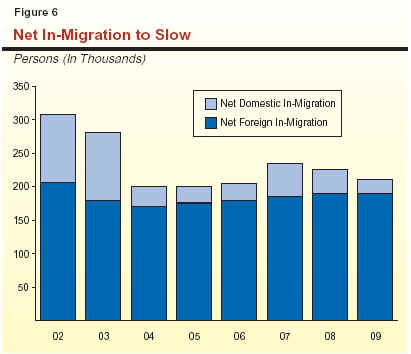
Figure 7 (see next page) shows our population growth projections by broad age categories, including both numerical and percentage growth.
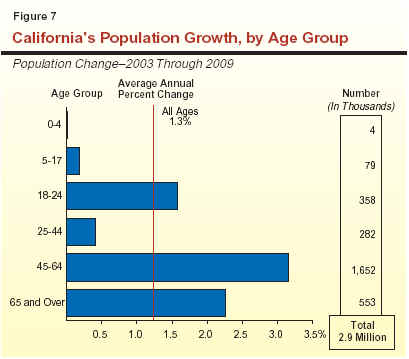
Ranks of Baby Boomers to Dramatically
Swell. The 45-to-64 age group (largely the
"baby boomers") continues to be by far the fastest growing
segment of the population. Over 1.7 million new people
are expected to move into this age category over the next
six years. At the other extreme, slow growth is anticipated
for preschoolers and the K-12 school-age population.
This reflects several factors. One is the movement of children
of the "baby boom" generation beyond the upper-end of
the 5-to-17 age group. Other factors include the slower
rate of net in-migration, and the decline in birth rates in
recent years that has reduced the number of children
moving into the preschool and school-age categories.
These various age-group demographic projections
can have significant implications for the state's revenue
and expenditure outlook. For example, strong growth of
the 45-64 age group generally benefits tax revenues since
this is the age category that routinely earns the
highest wages and salaries. Likewise, the growth in the young
adult population affects college enrollments, while that for
the 0-to-4 and 5-to-17 age groups drives K-12
enrollment growth.
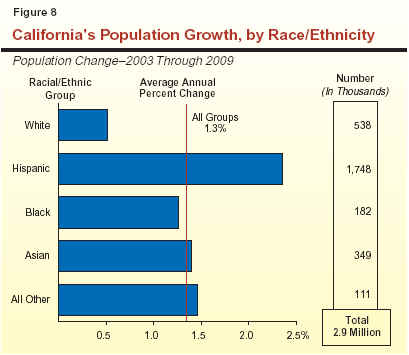
In addition to age, projected population growth will also differ markedly along other dimensions. For example:
The revenues that finance California's state General Fund budget come from a wide variety of sources, including taxes, fees, licenses, interest earnings, loans, and transfers. Over 90 percent of the total, however, is attributable to the state's three major taxes—the personal income tax (PIT), the sales and use tax (SUT), and the corporation tax (CT). In this chapter, we summarize our updated revenue projections and provide detail behind our key revenue-related assumptions.
In welcome contrast to our updates for the past two years when the key revenue-related development involved downward revisions, we are forecasting a significant improvement in the state's revenue picture compared to what was anticipated when the 2003-04 budget was adopted. Figure 1 presents our updated revenue projections.
|
Figure 1 The LAO�s General Fund
Revenue Forecast |
|||||||
|
(Dollars in Millions) |
|||||||
|
Revenue Source |
2002-03 |
2003-04 |
2004-05 |
2005-06 |
2006-07 |
2007-08 |
2008-09 |
|
Personal
income tax |
$32,442 |
$35,580 |
$38,270 |
$40,920 |
$43,840 |
$46,860 |
$50,090 |
|
Sales
and use tax |
22,330 |
23,540 |
24,850 |
26,410 |
28,030 |
29,680 |
31,370 |
|
Corporation
tax |
6,700 |
7,265 |
7,400 |
8,120 |
8,710 |
9,230 |
9,760 |
|
Other
revenues and transfers |
9,380 |
7,780 |
4,448 |
3,146 |
4,750 |
4,974 |
4,830 |
|
Total Revenues and
Transfers |
$70,852 |
$74,165 |
$74,968 |
$78,596 |
$85,330 |
$90,744 |
$96,050 |
|
Percentage
change |
-2.0% |
4.7% |
1.1% |
4.8% |
8.6% |
6.3% |
5.8% |
2003-04 Revenues. We project that
revenues will total $74.2 billion in 2003-04, a 4.7
percent increase from 2002-03. Our current estimate is
up $813 million from the 2003-04 budget forecast, reflecting the following partially offsetting factors:
2004-05
Revenues. We forecast that General Fund revenues will be $75 billion in 2004-05,
an increase of 1.1 percent from the current year.
Our updated estimate is $1.5 billion above the
2003-04 budget forecast. This reflects a $2.3 billion
increase in projected collections from the state's major
taxes, partly offset by a downward revision (from
$680 million to $200 million) in the amount of
receipts from new or renegotiated tribal gaming
compacts, along with some other downward adjustments.
Although the revenue growth rate for the budget year is only modest, the "underlying"
growth rate is considerably higher—over 6
percent—and thus more consistent with the economy's
projected moderate expansion. This discrepancy
between total versus underlying revenue growth reflects
the $3 billion in one-time funds included in the
2003-04 budget's revenue base. This is related to
the second tobacco bond ($2.2 billion) and loans
from special funds ($835 million). In addition, CT
receipts will be pulled down in 2004-05 due to the
conclusion of the two-year suspension of net operating
loss (NOL) deductions that has been in effect for
income years 2002 and 2003 (discussed further below).
The increase in our revenue forecast relative to the 2003-04 budget estimate reflects both the improving state economy and the stronger-than-expected cash performance during the past several months. Regarding the latter factor, total tax receipts during the first four months of 2003-04 are up by roughly $500 million, reflecting significantly higher PIT monies and more-modest gains in SUT and CT collections.
Of special significance is the strength in key payments that are tied to current economic activity. As shown in Figure 2, PIT withholding payments have steadily improved over the course of 2003, and were up a healthy 8 percent from the prior year in the third quarter. This reflected growth in wages, bonuses, and a revival in stock-option income. Similarly, CT payments jumped beginning in the fourth quarter of 2002 and have remained strong throughout 2003. While some of this strength in the CT relates to the suspension of NOL deductions noted above, a significant portion also appears to simply reflect stronger underlying business profits.
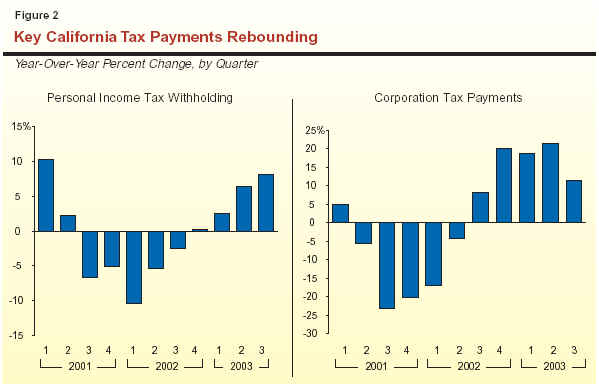
These higher tax payments suggest that, although the economic expansion has thus far
failed to produce significant job growth, the increases
in sales and output in the economy are producing meaningful growth in both personal and
corporate income in California.
The revenue totals shown in Figure 1 reflect not only basic economic developments, but also numerous revenue-related policy actions taken in conjunction with the 2002-03 and 2003-04 budgets. Key examples include:
As shown in Figure 3, the above one-time or limited-term factors can have major impacts on the General Fund revenue totals for individual years. For example, they increased the revenue totals by $7 billion in 2002-03 and nearly $4 billion in 2003-04, but will reduce revenues by varying amounts in subsequent years. The significant revenue decline shown for 2005-06 relates to the scheduled repayment of the TCRF loan.
We currently forecast that PIT receipts will
increase from $32.4 billion in 2002-03, to $35.6
billion in 2003-04, and $38.3 billion in 2004-05.
Over the longer term, we project that receipts from
this source will grow at an average annual rate of
about 7 percent between 2004-05 and 2008-09,
reaching $50.1 billion by the end of the forecast
period. Compared to the 2003-04 budget forecast, our
current estimate is up $2 billion in 2003-04 and
$2.2 billion in 2004-05.
Our upward PIT revision from the
2003-04 budget forecast is primarily related to the
recent strength in cash payments and evidence of an
improving economy and stock market.
Cash Receipts Up. Cash receipts from the
PIT during the first four months of 2003-04 are
running about 4 percent ahead of the budget estimates,
reflecting strength from a variety of payment sources,
including withholding and quarterly estimated payments. It
appears that the stronger economy is having a positive effect
on wages, bonuses, business income, and stock
market-related receipts.
With regard to the latter factor, Figure 4 provides
some perspective on the impact of capital gains and stock
options on General Fund revenues in recent history and through
the forecast period. It shows that revenues from these
sources accounted for as much as $17 billion in PIT receipts at
the peak of the market in 2000-01, but then plunged to $6 billion in 2001-02 and
to less than $5 billion in 2002-03.
Capital Gains and Stock
Options—Strengthening but Still Down.
The figure also shows that for the 2003-04 budget forecast made last May, we
assumed that revenues from these sources would increase moderately beginning in 2003-04, but
remain well below their previous peak through the five-year forecast period. Reflecting the recent
positive stock market and revenue-related developments, we have raised our associated revenue
estimates by roughly $1.2 billion per year in our
updated forecast. Even with this improvement, however, our projected amount of revenues from
these sources still remains less than half of the
2000-01 peak through the forecast period.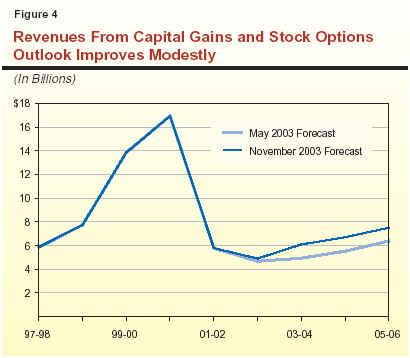
We estimate that SUT receipts will total $23.5 billion in 2003-04, a 5.2 percent increase
from the prior year. We project that these receipts
will grow further to $24.9 billion in 2004-05, an
increase of 5.6 percent from the current year. Our
updated estimates for 2003-04 and 2004-05 are similar
to those in the 2003-04 budget, reflecting
slightly stronger estimates of "real" sales growth, but
slightly less growth in commodity prices than we
had assumed previously. Over the longer term, we
forecast that SUT receipts will increase at an
average annual rate of about 6 percent per year
between 2004-05 and 2008-09, reaching
$31.4 billion by the end of the forecast period.
The main determinant of SUT receipts is
taxable sales, about two-thirds of which is related
to retail spending by consumers, and about
one-third of which is related to business-to-business
transactions. The past weakness in business
spending on both new facilities and equipment has had
a major adverse impact on taxable sales during
the previous two years. In 2002, for example,
taxable spending fell by 0.9 percent, reflecting a sizable
drop in business-related transactions partially offset
by a small gain in retail spending.
Taxable Sales Growth to Pick Up. Our
forecast for 2003 assumes that an improvement in
business spending will occur in the second half of the
year, and that this half-year effect will boost overall
sales by a modest 2.8 percent for the year as a
whole. Thereafter, the continuation of this healthier
business spending on a full-year basis should
produce the 5.9 percent increase that we forecast for
calendar year 2004, and similar gains in subsequent years.
One-Time Gain From Suspended
Transfer. Our sales tax estimate for the current year also
reflects a one-time gain of $87 million related to the
one-time suspension of the annual transfer of
certain sales tax revenues from gasoline sales out of
the General Fund and into a special transportation fund.
We estimate that CT receipts will increase from $6.7 billion in 2002-03, to $7.3 billion in 2003-04, and $7.4 billion in 2004-05. Over the longer term, we forecast that collections from the CT will increase at an average annual rate of slightly over 7 percent between 2004-05 and 2008-09, reaching $9.8 billion by the final year of the forecast period. These updated estimates are up from the 2003-04 budget forecast by $230 million in 2003-04 and $245 million in 2004-05.
The main factor underlying CT receipts is
the California taxable corporate profits of firms
doing business in California. We currently estimate
that these profits will jump 16 percent in 2003 and 12.5 percent in 2004. This reflects the combined effect of large increases in sales and output and
declining unit labor costs—the latter due to
significant productivity gains across all major
industry sectors. We project that profit growth in
subsequent years will settle into a more moderate and
sustainable pace, increasing at about 6 percent per year.
NOL Deductions to Return. The CT receipts
are also being affected by two special factors. The
first is legislation passed in conjunction with the 2002-03 budget that suspended NOL carryforward allowances for 2002 and 2003. These allowances
are reinstated in 2004, with the percentage of losses
that can be deducted against future earnings
increasing from 65 percent to 100 percent effective
beginning in 2005. This provision raised revenues
by $600 million in 2003-04, but will reduce
collections by $325 million in 2004-05 and slightly
higher amounts annually thereafter.
MIC to Disappear. The second special factor
is the expiration of the manufacturers' investment credit (MIC) beginning in 2004. The statute
creating the MIC in 1994 included a provision
stating that the MIC would expire following any year
after 2000 in which the cumulative growth in
manufacturing employment (excluding aerospace)
from 1994 was less than 100,000 jobs.
Manufacturing jobs fell below the specified threshold level in
2003, triggering the expiration of the MIC effective
January 1, 2004. The elimination of this credit
will boost CT revenues by $40 million in 2003-04, $195 million in 2004-05, and up to $450 million
In this chapter, we discuss our General Fund expenditure estimates for 2002-03 and 2003-04, and our projections for 2004-05 through 2008-09, both in total and by key program area. We first look at general budgetary trends during the forecast period, and then discuss in more detail our expenditure projections for individual major program areas.
Figure 1 shows how General Fund spending is distributed among major program areas in 2003-04. It indicates that education programs account for nearly one-half of total spending, with 41 percent attributable to K-14 education and another 8 percent for the University of California (UC) and California State University (CSU). Nearly one-third of the total is for health and social services, and about 7 percent is for corrections. The remainder is for debt service, various local subventions, pension payments, and other purposes.
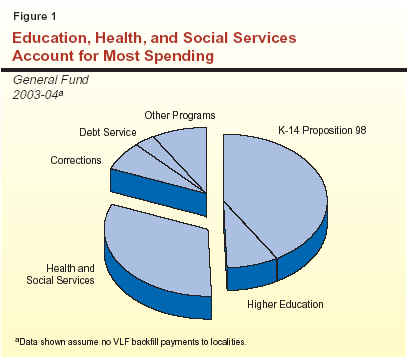
Figure 2 (see next page) shows our forecast for major General Fund spending categories. The impacts of a vehicle license fee (VLF) rate rollback are included at the bottom of the figure. We forecast that General Fund expenditures will jump from $73.7 billion in 2003-04 to $85.7 billion in 2004-05, an increase of 16.4 percent. This large jump is related to two main factors: (1) the expiration of one-time expenditure savings included in the 2003-04 budget, and (2) large increases in expenditures for the repayment of the deficit financing bond assumed to be issued in 2004-05.
|
Figure 2 Projected General Fund
Spending for Major Programs |
||||||||||
|
(Dollars in Millions) |
||||||||||
|
|
Estimated |
|
Forecast |
Average
Annual Growth From |
||||||
|
2002‑03 |
2003‑04 |
2004‑05 |
2005‑06 |
2006‑07 |
2007‑08 |
2008‑09 |
||||
|
Education
programs |
|
|
|
|
|
|
|
|
|
|
|
K-14�Proposition 98 |
$29,189 |
$30,513 |
|
$34,135 |
$35,978 |
$37,672 |
$39,250 |
$40,781 |
4.5% |
|
|
CSU |
2,646 |
2,430 |
|
2,500 |
2,596 |
2,711 |
2,843 |
2,998 |
4.6 |
|
|
UC |
3,059 |
2,761 |
|
2,846 |
2,955 |
3,086 |
3,236 |
3,413 |
4.6 |
|
|
Health
and Social Services |
|
|
|
|
|
|
|
|
|
|
|
Medi-Cal benefits |
$9,967 |
$10,018 |
|
$11,784 |
$12,345 |
$13,156 |
$13,892 |
$14,503 |
5.3% |
|
|
CalWORKs |
2,077 |
2,082 |
|
2,402 |
2,573 |
2,636 |
2,701 |
2,801 |
3.9 |
|
|
SSI/SSP |
3,031 |
3,380 |
|
3,550 |
3,771 |
3,975 |
4,229 |
4,546 |
6.4 |
|
|
IHSS |
1,122 |
1,269 |
|
1,425 |
1,607 |
1,831 |
2,076 |
2,343 |
13.2 |
|
|
DDS |
1,866 |
2,102 |
|
2,398 |
2,568 |
2,800 |
3,064 |
3,361 |
8.8 |
|
|
Other major programs |
4,832 |
4,556 |
|
5,499 |
5,836 |
5,923 |
6,139 |
6,404 |
3.9 |
|
|
Department
of Correctionsa |
$4,948 |
$5,084 |
|
$5,188 |
$5,458 |
$5,789 |
$5,953 |
$6,112 |
4.2% |
|
|
VLF
subventions |
$3,786 |
� |
|
� |
� |
$834 |
� |
� |
� |
|
|
Debt
service |
$2,233 |
$2,484 |
|
$3,788 |
$4,087 |
$4,480 |
$4,855 |
$5,253 |
8.5% |
|
|
Other
programs/costs |
$9,276 |
$6,996 |
|
$10,016 |
$10,771 |
$10,957 |
$11,549 |
$12,947 |
6.6% |
|
|
Totals�no
VLF backfill |
$78,031 |
$73,675 |
|
$85,727 |
$90,941 |
$96,496 |
$100,514 |
$106,275 |
5.5% |
|
|
|
|
|
|
|
|
|
|
|
|
|
|
Effect of
resumed VLF backfill: |
|
|
|
|
|
|
|
|
|
|
|
VLF subventions |
� |
$3,237b |
|
$4,224 |
$4,394 |
$4,581 |
$4,787 |
$5,024 |
4.4% |
|
|
CalWORKs VLF interaction |
� |
� |
|
223 |
127 |
129 |
130 |
133 |
-12.1 |
|
|
Totals�with
VLF backfill |
$78,031 |
$76,912 |
|
$90,175 |
$95,462 |
$101,206 |
$105,431 |
$111,433 |
5.4% |
|
|
|
||||||||||
|
a
Reflects employee compensation costs starting with forecast
period (2004-05). |
||||||||||
|
b
Assumes VLF rate reduction made retroactive to October 1, 2003.
The 2003-04 amount would be $1.8 billion if rate reduction were
effective on |
||||||||||
Expiration of One-Time Savings. Major
examples in this first category are:
Deficit Financing Bond Repayment. The spending totals for 2004-05 and beyond include roughly $2.4 billion in increased annual General Fund payments for Proposition 98. These payments are part of a multistage shift of sales and property taxes (the so-called "triple flip"), and are tied to repayment of the deficit financing bond (see box on page 32).
Key Education TermsWhat Is the Maintenance Factor?Over the long-run, the Proposition 98 minimum guarantee is determined by the growth in In either of these circumstances, the Constitution requires the state to restore in future years
the difference between the actual level of spending and the long-term Test 2 level of spending.
This difference is known as the maintenance factor. Generally, maintenance factor is restored
during Test 2 years (when the growth of General Fund revenues exceeds growth in personal income).
For instance, in 2001-02 when General Fund revenues fell by more than 17 percent (a Test 3 year),
the Legislature appropriated $3.9 billion less than would have been required if Test 2 were
operative. This created a $3.9 billion maintenance factor that must be restored in the future.
In 2002-03, the state was required to provide approximately $500 million to begin restoring
the maintenance factor. Based on our current forecast, the state will be required to restore
additional maintenance factor of $875 million in 2003-04 and around $600 million in 2004-05. Currently,
for each $1 increase in General Fund revenues, there is around a $.50 increase in the minimum
guarantee as more maintenance factor is required to be restored. What Is the Deficit Factor?Because school district revenue limit funding is continuously appropriated, the Legislature must amend statute if it wants to provide less than the full statutory COLA or enrollment funding, or wants to make additional reductions to revenue limit funding. Technically, the Legislature and Governor "deficit" (that is, reduce) the revenue limit funding by some factor or percentage. In the early 1990s the revenue limit deficit factor grew to 11 percent after several consecutive years of not providing school districts with a full statutory COLA. In 2000-01, the state provided an addition $1.8 billion in revenue limit funding to eliminate the deficit factor. In 2003-04, the state created a new deficit factor of 3.1 percent or $894 million—consisting of a base reduction of 1.2 percent and a foregone COLA (1.9 percent). This deficit factor would be fully restored in 2005-06 absent additional legislative action. The Triple FlipA key feature of the 2003-04 budget package was the method devised to finance the deficit financing bonds. The state enacted a three-step approach—commonly referred to as the triple flip—that provides a dedicated funding source for the deficit bonds:
The retirement of the bonds is dependent on revenues received by the state, but is expected to occur over roughly five years. The swap of sales taxes for property taxes ends after the deficit financing bonds are repaid.
|
The right-hand column of Figure 2 shows
the average annual growth rates from 2004-05
through 2008-09 that we are projecting. Overall
spending is projected to grow by an average of about
5.5 percent per year, reflecting divergent trends
among major state program areas. With regard to
specific individual program areas, the figure shows that:
State spending for K-14 education
(K-12 schools and community colleges) is governed
largely by Proposition 98, passed by the voters in
1988. Proposition 98 sets the minimum amount the
state must provide for California's public K-12
education system and the California Community Colleges (CCC). Proposition 98 is funded from
the state General Fund and local property taxes
and accounts for almost 80 percent of total support
for K-14 education. The remainder is from a
variety of sources including federal funds, lottery
revenue, and other local revenues.
California's public K-12 education system consists of more than 1,000 locally governed
school districts and county offices of education
serving about 6.2 million K-12 students. In addition,
these entities serve infants and preschool students
receiving child care and individuals in adult
education programs. The CCC provides instruction to
about 1.1 million full-time equivalent students at
108 colleges operated by 72 locally governed districts.
Figure 3 displays our projections of the Proposition 98 minimum guarantee—as well as its General Fund and local property tax funding components—throughout the forecast period. We would also note that our budget totals reflect an updated figure for 2002-03 Proposition 98 spending which is $100 million higher than assumed at the passage of the 2003-04 budget package.
|
Figure 3 The LAO Proposition 98
Forecast |
|||||||
|
2003-04 Through 2008-09 |
|||||||
|
|
2003-04 |
2004-05a |
2005-06 |
2006-07 |
2007-08 |
2008-09 |
|
|
Budget
Act |
Revised |
||||||
|
Proposition 98 |
|
|
|
|
|
|
|
|
General
Fund |
$30.0 |
$30.5 |
$34.1 |
$36.0 |
$37.7 |
$39.2 |
$40.8 |
|
Local
property tax |
15.7 |
16.1 |
14.9 |
16.0 |
17.3 |
18.5 |
19.7 |
|
Totals |
$45.7 |
$46.6 |
$49.0 |
$52.0 |
$54.9 |
$57.8 |
$60.5 |
|
|
|||||||
|
a
Funding components reflect a $2.45 billion reduction in property
tax revenues�and commensurate increase in General Fund support�due
to the triple flip budget solution, which has an ongoing effect
throughout the forecast period. |
|||||||
Forecast for the Current Year. The
2003-04 Budget Act appropriates $45.7 billion in
Proposition 98 spending. We now forecast a minimum
guarantee of $46.6 billion for 2003-04, around
$875 million higher than the current appropriation level.
The increase in the minimum guarantee is mainly
due to our estimate of $2.2 billion in higher
General Fund tax revenues in 2003-04, but is also
affected by changes in school attendance and
population estimates. Because the 2003-04 appropriation
level has not changed, we forecast that the
Proposition 98 minimum guarantee is now underappropriated by $875 million. Based on
the legislative intent language in Chapter 228,
Statutes of 2003 (AB 1756, Budget Committee) to spend
at the minimum guarantee in 2003-04 and 2004-05, our fiscal forecast assumes that the Legislature
appropriates an additional $875 million in
2003-04. We forecast that local property tax revenues
will be $345 million higher than assumed in the
2003-04 Budget Act. Thus, the state would be required
to provide an additional $530 million from the
General Fund to meet the minimum guarantee. This additional funding would reduce the
outstanding "maintenance factor" to just under $2.5 billion
(see discussion in box on page 32).
Forecast for the Budget Year. For 2004-05,
we estimate the Proposition 98 minimum
guarantee will total $49 billion. This is $2.4 billion
(5.1 percent) more than in 2003-04. During 2004-05, K-14 local property tax revenue will decrease by a net of $1.2 billion because of (1) a
$2.45 billion transfer of K-14 local property taxes to cities
and counties to backfill foregone sales tax revenue
as part of the triple flip (also discussed in box on
page 32) and (2) $1.2 billion in increased local
property tax revenues because of increased assessed
property values. Thus, General Fund costs of
meeting the Proposition 98 minimum guarantee will
grow by $3.6 billion between the current 2003-04
level and 2004-05 (an 11.9 percent increase).
Out-Years' Forecast. For the remainder of
the forecast period, we estimate that growth in
total Proposition 98 spending will average
$2.9 billion annually (5.4 percent). Strong property tax
growth averaging $1.2 billion annually (7.4 percent)
helps reduce the impact on the General Fund.
General Fund support for Proposition 98 will grow
around $1.7 billion annually (4.5 percent).
Key Forecast Factors. General Fund
expenditures for Proposition 98 depend on a variety of
factors—including K-12 average daily
attendance (ADA), per capita personal income, per capita
General Fund revenues, and local property taxes.
Figure 4 summarizes our assumptions for these
factors and the K-12 COLA rate.
Figure 4 The LAO Proposition 98
Forecast Factors 2003-04 2004-05 2005-06 2006-07 2007-08 2008-09 Proposition 98 �Test� 2 2 2 2 2 2 Annual Percentage Change K-12
average daily attendance 1.1% 1.0% 0.9% 0.5% 0.3% -0.1% Per
capita personal income 2.3 2.8 4.1 5.0 4.6 4.5 Per
capita General Fund 5.5 4.5 5.5 5.2 4.9 4.9 State
population 1.5 1.3 1.3 1.3 1.4 1.3 Local
property taxes 8.8 7.6a 7.9 7.7 7.2 6.7 K-12
COLA 1.9 2.2 2.5 2.8 2.8 2.8 a
Growth rate in 2004-05 reflects the underlying growth in school
district and community college property tax revenues. This rate does not
account for changes in revenues resulting from the triple flip.
For our forecast:
The state's actions to address the 2002-03 and 2003-04 budget problems in K-14 education relied heavily on (1) one-time solutions, (2) borrowing from the future by deferring appropriations to future years to support current costs, and (3) a large limited-term reduction in general purpose funding for K-12. The growth in Proposition 98 funding over the forecast period would allow the state to (1) address the fiscal obligations created by the recent budget solutions, (2) provide growth and COLA, and (3) allocate roughly an additional $1 billion in growth annually throughout the forecast period for program expansions or restorations. In this section, we provide information on the statutory cost pressures for K-14 education over the forecast period. Specifically, these fiscal obligations include:
Because of the strong growth in
Proposition 98 over the forecast period, the Legislature could
fund all of the cost pressures described above, and
still allocate roughly $1 billion annually throughout
the forecast period for program restorations or
expansions. The Legislature's choices in allocating
this additional funding will affect the "split" of
Proposition 98 resources between K-12 schools and
CCC. The CCC's share of Proposition 98 resources
has ranged between 9 percent and 11 percent.
The Proposition 98 levels in our forecast suggest
that the Legislature will have considerable discretion
in how to allocate K-14 funding beyond growth, COLA, and other obligations.
Proposition 49. Approved by voters in
2002, Proposition 49 requires that the state
appropriate additional funding for after school programs
beginning in 2004-05 if certain conditions are
met. Specifically, the state must appropriate up to
an additional $430 million for after school
programs if total state spending reaches a specified
threshold. Based on our revenue forecast, the state
would not be required under Proposition 49 to
augment after school programs over the forecast period.
In addition to community colleges, the
state's public higher education system includes UC
and CSU. The UC consists of eight general
campuses, one health sciences campus, numerous special
research facilities, and a soon-to-open tenth
campus in Merced. The UC awards bachelor's, master's,
and doctoral degrees, as well as various
professional degrees. The UC has primary jurisdiction
over public university research. The CSU consists of
23 campuses and several off-campus centers. The
CSU grants bachelor's and master's degrees and may award doctoral degrees under specified
circumstances.
The Spending Forecast. We estimate that
General Fund spending for UC and CSU (excluding funding for capital outlay and debt service)
will increase from $5.2 billion in 2003-04 to $5.3
billion in 2004-05. This is an increase of $154
million, or 3 percent. It primarily reflects the
restoration of one-time reductions that were made in
the 2003-04 budget. By 2008-09, we estimate that
that spending for UC and CSU will increase to $6.4
billion, reflecting average annual increases of
almost 5 percent starting in 2005-06.
Key Forecast Factors. Consistent with the
Legislature's expressed intent, our forecast assumes
no funding for enrollment growth, new salary
increases, or discretionary price adjustments in
2004-05. We assume that the segments will begin
receiving additional funds for COLAs and
enrollment growth starting in 2005-06. Over the forecast
period, inflation is projected to average about
2.8 percent annually.
With regard to enrollment growth, our forecasts are based primarily on population growth
among 18 to 24 year olds. This population is
currently growing at a relatively low rate, although we
project that this rate will increase to about 2.6 percent
by the end of the forecast period. While we assume that there will be no funding for enrollment
growth in 2004-05, we have assumed that the demand
created by population growth in 2004-05 would be accommodated in subsequent fiscal years.
Our estimates assume that college participation rates will remain relatively constant throughout
the forecast period. This is for three reasons. First,
we note that college participation rates are already
at historic highs. Second, recent and anticipated
fee increases could dampen the potential for
further increases in participation rates. Finally, recent
reductions in funding for UC and CSU outreach programs could further reduce the likelihood that
participation rates would increase significantly
during the forecast period.
Cal Grant Costs Likely to Increase
Substantially. We estimate that spending for financial aid
programs administered by the Student Aid Commission will increase from
$683 million in 2003-04 to approximately $1.1 billion in
2008-09. The bulk of the expected increase is attributable to the
Cal Grant Entitlement programs. Effective beginning in
2001-02, these programs guarantee financial aid to recent
high school graduates and community college transfer
students under 24 years of age. Because these programs are still
relatively new, future growth in their participation rates remains
uncertain. However, our projections assume that student
participation in the entitlement programs will continue to
grow somewhat faster than student enrollment.
The Medi-Cal Program (the federal
Medicaid Program in California) provides health care
services to recipients of CalWORKs or SSI/SSP
grants, and other low-income persons who meet the
program's eligibility criteria (primarily families
with children and the elderly, blind, or disabled).
The state and federal governments share most of
the program costs on a roughly equal basis.
The Spending Forecast. We estimate that
General Fund spending for Medi-Cal local
assistance (including benefits, county administration of
eligibility, and other costs) will reach $10.7 billion
in the current year, about a $170 million increase
over the amount appropriated in the 2003-04
Budget Act. We project that, barring other actions by the
Legislature and Governor, General Fund support would grow to $12.6 billion in 2004-05, a
17 percent increase from current-year expenditures.
This is largely due to the one-time effect of the
accounting shift of the program from an accrual to
cash basis as well as the phase-out of a temporary
increase in the federal share of support for the
Medicaid Program. By the end of the forecast
period in 2008-09, we estimate that General Fund
spending for Medi-Cal will reach $15.5 billion, an
average annual increase of 7.8 percent over the
projection period.
Key Forecast Factors. Several factors play a
significant role in our forecast:
The Healthy Families Program (HFP)
implements the federal State Children's Health
Insurance Program, enacted in 1997. Funding generally is
on a two-to-one federal/state matching basis. The
program offers health insurance to eligible children
in families with incomes below 250 percent of the
federal poverty level. Families pay a relatively
low monthly premium and are offered coverage
similar to that available to state employees.
The Spending Forecast. We estimate that
overall General Fund spending for HFP will be $290 million in 2003-04. We further estimate
that overall General Fund spending for the program
will increase about 5.5 percent in 2004-05 to
about $306 million, and that by 2008-09 the program
will have an annual General Fund cost of about $450 million.
Key Forecast Factors. Compared to prior
years, the 2004-05 forecast reflects a slower growth
rate in program spending, which is due in part to
recent statutory direction to freeze the rates paid
to HFP health plans at the current level through
2004-05. The forecast assumes that rate increases for
the cost of medical coverage resume commencing in 2005-06.
Our forecast also reflects the enactment of Chapter 673, beginning in 2005-06. Our
projection takes into account the likelihood that the
premium assistance provisions of Chapter 673 will
add a significant number of children to HFP enrollment.
The forecast assumes that a proposed expansion of enrollment to some parents of children
eligible for HFP does not occur during the
forecast period. However, the caseload of children
continues to grow as the program reaches a larger
proportion of the total eligible population.
The Lanterman Developmental Disabilities
Services Act of 1969 provides a variety of services
and supports to individuals with developmental disabilities, including mental retardation,
cerebral palsy, epilepsy, autism, or other similar
disabling conditions. The DDS, which oversees the
programs, operates five Developmental Centers (DCs)
and two smaller facilities which provide 24-hour
institutional care, and contracts with 21 Regional
Centers (RCs) to coordinate and deliver community-based services.
The Spending Forecast. We estimate that
General Fund spending for developmental services
in 2003-04 will total $2.1 billion, about the
same amount of funding appropriated in the
2003-04 Budget Act. Of that total, excluding
headquarters, about $1.7 billion would be spent by RCs for
community services and about $369 million would
be spent for operating the DCs.
We further estimate that General Fund spending for developmental services will grow by
about 14 percent in 2004-05 to approximately
$2.4 billion. Part of that growth is due to a transfer
of habilitation services from the Department of Rehabilitation to DDS.
Between now and 2008-09, we estimate that General Fund spending for the developmental
services program will grow by $1.3 billion and
reach a total of almost $3.4 billion. This
expenditure growth is due almost entirely to the RCs. We
estimate there will be a one-time increase in
spending in 2004-05 as a result of the closure of
Agnews DC followed by an ongoing reduction in DC
operating costs. Spending for DCs is projected to
remain relatively flat over the rest of the
forecast period.
Key Forecast Factors. Our forecast of
significant growth in RC spending reflects historical
increases both in caseload and in the average cost
of serving each RC client. Specifically, our
forecast assumes that RC caseloads will continue to
grow at an annual average rate of 5.4 percent and
that costs will continue to grow at an annual
average rate of 5.9 percent.
The CalWORKs program provides cash
grants and welfare-to-work services to families with
children whose incomes are not adequate to meet
their basic needs.
The Spending Forecast. General Fund
spending for the CalWORKs program is estimated to
be $2.1 billion in 2003-04, which is unchanged
from the prior year. We project spending to increase
by 15 percent to $2.4 billion in 2004-05 and by
7 percent to a total of $2.6 billion in 2005-06. For
the remainder of the forecast, we project that
spending will increase by an average of 2.9 percent
each year. The primary reason for the substantial
spending increases in 2004-05 and 2005-06 is due to
a reduction in available carry-in federal
Temporary Assistance for Needy Families (TANF) funds.
For 2003-04, California had $533 million in
unexpended TANF funds from prior years. We
estimate the available carry-in TANF funds for 2004-05
will be $268 million less than were available in
2003-04, with further reductions in available funds
in the out-years. Given this substantial reduction
in available carry-in funds, California would have
to spend above the federal maintenance-of-effort
requirement beginning in 2004-05 in order to fund the program.
Key Forecast Factors. Beyond the estimated
reduction in unexpended federal TANF funds, our spending projection is based on several factors,
the most important being our caseload projections (discussed below). Other important
assumptions include federal funding of the TANF block
grant at $3.7 billion and providing the state
statutory COLA which is based on the increase in the
California Necessities Index.
Caseload Trends and Projections. From
1994-95 through 2002-03, the CalWORKs caseload declined by 48 percent. This decline in caseload
is attributable to a number of factors including
the strong economy of the late 1990s, annual reductions in the teen birth rate, and CalWORKs
program changes which emphasized welfare-to-work services. However, since October 2002, the
caseload has remained essentially flat at about 480,000
cases. Accordingly, for this fiscal forecast report,
we have assumed that the total caseload will
remain essentially flat.
The SSI/SSP provides cash assistance to
eligible aged, blind, and disabled persons. The SSI
component is federally funded, and the SSP component is state funded.
The Spending Forecast. General Fund
spending for SSI/SSP is estimated to be about $3.4 billion
in 2003-04, an increase of about 12 percent
compared to the prior year. For 2004-05, we project a
5 percent increase, raising total expenditures to
$3.6 billion. From 2004-05 through the end of the
forecast period, spending for SSP will increase by
an annual average rate of 6.4 percent, eventually
reaching a total of $4.5 billion.
Key Forecast Factors. The two primary cost
drivers for SSI/SSP are caseload growth of about 2.1 percent and the cost of providing the
statutory COLA each January beginning in 2005. (The
2003-04 Budget Act suspended the January 2004
COLA.) For 2004-05, a six-month COLA accounts for $89 million in increased costs and caseload
growth accounts for an additional $71 million.
Estimated costs for 2005-06 include annualization of
the 2004-05 COLA ($89 million), the January
2006 COLA ($46 million), and caseload growth
of $76 million. During the out-years of the
forecast, COLA costs average around $117 million per
year and caseload growth averages around
$84 million per year. Finally, we note that beginning in
2006-07, the cost of providing state-only SSI/SSP
benefits to noncitizens who immigrated to the
United States after August 1996 substantially increases
because counting their sponsor's income as an
offset to the grant amount ends after ten years.
Caseload Trends and Projections. During
the late 1980s and early 1990s, the caseload grew
rapidly, with most of the growth in the disabled
component of the caseload. In the mid-to-late
1990s, the caseload leveled off and actually declined
in 1997-98, in part due to federal policy changes
which restricted eligibility. Since March 1998, the
caseload has been growing at a steady rate of just over
2 percent per year. We expect the growth rate to
continue throughout the forecast period.
The IHSS program provides various services
to eligible aged, blind, and disabled persons who
are unable to remain safely in their homes without
such assistance.
The Spending Forecast. General Fund
spending for IHSS is expected to be $1.3 billion in Key Forecast Factors. Our forecast assumes
that costs will increase 9.5 percent each year due
to caseload growth and increases in the hours of
service provided to recipients. The other
significant cost driver for IHSS is provider wages. Our
projection assumes that counties will increase
provider wages gradually throughout the forecast
period, though by less than the maximum level
authorized by current law. We project that by
2003-04, an increase of 13 percent over the
prior year. For 2004-05, we project that costs will
increase again by 12 percent to a total of $1.4 billion.
For the remainder of the forecast, we expect costs
to increase an average of 13 percent each year,
resulting in total expenditures of $2.3 billion in
2008-09.
2008-09, provider wage increases will result in
additional annual General Fund costs of $295 million.
The major state judiciary and criminal justice programs include support for three departments in the executive branch—the California Department of Corrections (CDC), Department of the Youth Authority, and the Department of Justice—as well as expenditures for local trial courts and state appellate courts. The largest expenditure program—the CDC—is discussed in more detail below.
The CDC is responsible for the
incarceration and care of adult felons and nonfelon
narcotics addicts at 32 state prisons. The CDC also
supervises and provides services to parolees released
to the community.
The Spending Forecast. General Fund
support for CDC is forecast to grow by about
$240 million from 2002-03 to 2004-05, reaching
about $5.2 billion at the end of that period. Expenditures for
CDC are forecast at about $6.1 billion by 2008-09. (Our
estimates for the forecast period, beginning in
2004-05 include adjustments for employee compensation increases, but do
not include General Fund support for capital outlay and debt
service, which are accounted for elsewhere in our projections.)
The projected growth in adult correctional
expenditures continues a trend of steadily increasing CDC
budgets that has existed since the early 1980s. However, in
a change from past growth trends, the CDC budget
now appears likely to grow significantly more slowly.
During the forecast period the CDC budget would
grow at an average annual rate of 4.2 percent compared
with substantially higher prior annual growth rates in
the past that sometimes exceeded 10 percent.
During the forecast period, the department's General Fund costs are
assumed to be partially offset by $65 million in
annual reimbursements from the federal government
for a portion of the state's costs of housing
undocumented immigrants convicted of felonies in
California. This amount is $69 million less than
budgeted in 2003-04.
Key Forecast Factors. The projected increases
in General Fund support for CDC are driven by a combination of factors, including correctional
officer salary increases pursuant to the Unit 6
bargaining agreement; overtime, sick leave, and
workers' compensation costs; and growth in the cost
of inmate health care services. The Unit 6
agreement went into effect in January 2002 and is
estimated to result in salary increases of over
$900 million during the forecast period. Also, increases in
the overall cost of providing health care to inmates
have caused health care expenditures to increase at
a higher rate than other prison support costs. In addition, inmate health care costs are expected
to increase by $40 million during the forecast
period due to the implementation of court orders
instructing the department to improve the delivery
of health care services to inmates.
Prison population is not a significant driver
of General Fund cost increases during the forecast period. As seen in Figure 7, the population is
projected to decrease by 11,300 inmates between
2002-03 and 2005-06, and is expected to stabilize at
this level increasing by only 590 inmates (or less than
1 percent) over the remainder of the projection period. The population decrease is largely due
to policy changes adopted by the Legislature and
administration aimed at reducing the inmate population and parolee recidivism.
While departments' budgets include base
costs for the compensation of state employees, the
budget typically includes a lump sum for any
additional compensation items that take effect in the
budget year. Given the overall budget situation, the
2003-04 budget assumes a reduction of $585 million
in General Fund costs for state employee compensation costs (through Control Section 4.10).
This amount is the combination of (1) the
avoidance of employee compensation costs that were not
budgeted ($404 million) and (2) the reduction of
expenses below departments' budget appropriations ($181 million).
To achieve these savings, the administration
has pursued a number of strategies to reduce state employee compensation costs. The Legislature
has approved new or renegotiated contracts with 14
of 21 state bargaining units. These agreements (as
described in Figure 8) include current-year net
savings and out-year costs. In addition, the
administration eliminated thousands of vacant
positions throughout state government. Departments
also identified other savings—such as reducing
overtime and temporary employees. Finally, about
300 employees have been laid off so far, with more
than an additional thousand layoffs expected by the
end of 2004-05.
Figure 8 Major Provisions of
Recently Approved �
The Legislature has approved administration-negotiated
agreements for 14 of the state�s 21 bargaining units to
defer scheduled July 1, 2003 salary increases, in exchange for
additional benefits. (The largest group which has not come to a new
agreement is bargaining unit 6 which represents corrections�
employees.) �
In particular, the administration agreed to (1) pay 80 percent
of health insurance costs effective January 1, 2004, (2) allow employees
to accrue one additional vacation day per month (approximately
equivalent to the deferred 5 percent salary increase for most
employees), and (3) in some cases, continue the suspension of
employees� retire-ment contributions to maintain take-home pay at
current levels. �
The Department of Personnel Administration estimates that
these provisions will generate net savings of $185 million ($67 million
General Fund) in 200304.
The Spending Forecast. While the
administration has made proposals to achieve employee
compensation savings, it has not yet accounted for
some increased employee costs that will likely be
unavoidable (such as for corrections and other 24-hour care agencies). In addition, the timing of
layoffs will prevent some departments from achieving full-year savings. Consequently, we expect
net current-year savings to fall short of the
expected $585 million by about $200 million. This
shortfall will create pressure on departmental budgets.
We project that the shortfall will result in a
combination of departments absorbing additional costs and
seeking authorizations for deficiency spending.
Separate from the net savings associated with Control Section 4.10 discussed above, the state
will incur additional employee compensation costs
over the forecast period (as discussed below). We
estimate that General Fund costs will increase by
more than $1.5 billion by 2008-09.
Key Forecast Factors. While the
renegotiated employee contracts will result in reduced state
costs in 2003-04, they will increase costs over the
forecast period. For instance, the deferred July 1,
2003 salary increase and state payment of 80 percent
of health benefits negotiated with 14 bargaining
units (and also adopted by the administration for
employees excluded from collective bargaining)
will increase General Fund expenditures by more
than $200 million in 2004-05. These costs will grow
to almost $500 million by 2008-09 due mainly to
rising health insurance premiums.
For the other bargaining units without renegotiated provisions (including correctional
officers), we have included the ongoing costs of the
salary increases that began this year. These costs
total about $350 million in 2004-05 and grow to
almost $800 million by 2006-07. In those years
beyond scheduled pay raises, we assumed
compensation costs for all bargaining units will increase at
the same rate as inflation.
State Employee Contracts
In typical years, the budget includes funding
for state costs related to retirement in three
areas: (1) contributions to the PERS,
(2) contributions to the State Teachers' Retirement System
(STRS), and (3) the state portion of retirees' health
and dental insurance premiums. In place of the
state's annual retirement contributions to PERS, the
2003-04 budget authorizes the issuance of
$1.9 billion in pension obligation bonds. A recent
Superior Court decision ruled that the state cannot sell
these bonds without voter approval. (This decision
is being appealed by the state.)
The Spending Forecast. Given the court's
decision, we have assumed that the state will pay
its retirement obligations to PERS in the typical
fashion. This worsens the state's General Fund
condition by $1.9 billion in 2003-04 compared to the
budget plan. In future years, we estimate the state's
overall retirement-related costs will increase gradually.
Key Forecast Factors. We project that state
retirement contributions to PERS will continue
their upward trend for 2004-05, given the
continued underperformance of PERS investments. (The
investment return for 2002-03 was 3.7 percent,
compared to the 8.25 percent assumed annual
return.) Beginning in 2005-06, we assume that state
contributions will begin to decline. With respect to
the STRS, we assume the state contribution—a
statutory percentage of teacher payroll—will grow
at the same rate as Proposition 98 expenditures.
Finally, consistent with recent experience, we
assume double-digit annual growth in General Fund
expenditures for the state portion of retirees'
health and dental insurance premiums—primarily
reflecting rising health costs. We estimate that
premium costs of $760 million in 2004-05 will grow
to $1.3 billion by 2008-09.
The 2003-04 Budget Act included $80 million in General Fund savings from:
For workers' compensation, the state's program does not operate in the same fashion as the private sector. For instance, the state already had in place many of the cost control measures (such as for generic drugs) recently enacted. In regards to contract savings, DGS thus far has only been able to identify minimal opportunities for contract savings. We, therefore, project that only a fraction of these statewide savings will be achieved in the current year.
By the end of 2003-04, we estimate that outstanding noneducation reimbursable mandate claims will have reached nearly $800 million. Chapter 228 states legislative intent to defer these outstanding claims as well as new and ongoing claims in 2004-05, for a combined deferral of about $1 billion. In order to fund the ongoing costs of mandates and pay off outstanding obligations over the remaining four years of the forecast period, we estimate that the state would have to provide around $550 million annually between 2005-06 and 2008-09.
| LAO Publications
To request publications call (916) 445-4656. This report and others, as well as an E-mail subscription service, are available on the LAO's Internet site at www.lao.ca.gov. The LAO is located at 925 L Street, Suite 1000, Sacramento, CA 95814. |