Traveling
in California:
Trends and Mobility (II)
Most Urban Areas Served by Commuter and Urban Rail
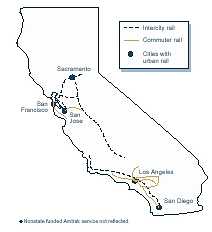
• The state's passenger rail system includes intercity
rail, commuter, and urban (light) rail services.
• Intercity Rail. This component of passenger rail
primarily serves business and recreational travelers going between cities in
California
and to other parts of the country. Currently, Amtrak operates all intercity
rail service in the state. On rail corridors where the state wishes to provide
for expanded service beyond Amtrak-defined "basic service" levels,
the state contracts and shares costs with Amtrak to provide for additional train
operations.
• Commuter and Urban Rail. These services are provided
within urban or metropolitan areas with commuter rail generally offering frequent
service during the commute hours, and urban rail providing regular service throughout
the day. Because commuter and urban rail services primarily serve local and
regional transportation needs, they are planned and administered by local and
regional transportation agencies. Funding is provided with a combination of
local, state, and federal funds.
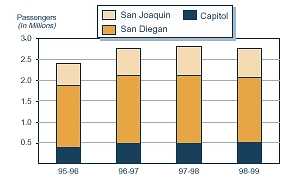
Intercity Rail Ridership Remains Relatively
Flat
• Intercity rail is a state program, funded from the
Public Transportation Account. Currently, service is provided in three rail corridors:
• Capitol, serving San Jose - Oakland - Davis - Sacramento
- Auburn.
• San Diegan, serving San Diego - Los Angeles - Santa Barbara
- San Luis Obispo.
• San Joaquin, serving Oakland - Sacramento - Fresno - Bakersfield.
• Total daily roundtrip service on the three corridors grew from 16.5
roundtrips in 1995-96 to 22 in 1998-99.
• Despite the increase in the number of daily roundtrips, overall ridership
has fluctuated in recent years. After a relatively large increase between 1995-96
and 1996-97, ridership has remained flat.
• In 1998-99, about 2.8 million passengers used the intercity rail
service. This represents an increase of 17 percent from 1995-96, when ridership
totaled approximately 2.4 million.
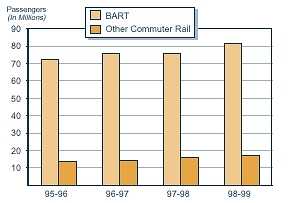
The Bulk of Commuter Rail Riders Use
BART
• California's commuter rail operators include:
• Altamont Commuter Express (ACE), serving Stockton - Tracy
- Fremont - San Jose.
• Bay Area Rapid Transit (BART), serving Daly City - San
Francisco - Oakland - Richmond - Pittsburg - Dublin - Fremont.
• Caltrain, serving Gilroy - San Jose - Palo Alto - San
Mateo - San Francisco.
• Coaster, serving Oceanside - Sorrento Valley - San Diego.
• Metrolink, serving Oxnard - Lancaster - Los Angeles -
Pomona - San Bernardino - Orange County - Oceanside.
• By far, BART carries the largest number of commuter rail passengers.
In 1998-99, over 98 million passengers used commuter rail. Approximately
83 percent of these passengers were riders of BART.
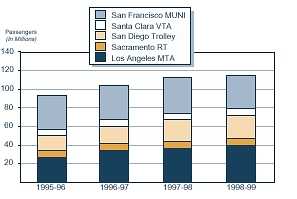
More People Are Using Urban Rail Systems
• From 1995-96 through 1998-99, urban (light) rail
operators as a whole have experienced an increase in ridership of about 22 percent.
• California's urban rail operators include:
• Los Angeles County Metropolitan Transportation Authority (LACMTA).
• Sacramento Regional Transit.
• San Diego Trolley.
• San Francisco MUNI.
• Santa Clara Valley Transportation Authority (VTA).
• Historically, San Francisco MUNI has serviced the largest number of
urban rail passengers. In 1998-99, however, LACMTA surpassed MUNI in terms of
total annual ridership, serving over 39 million passengers.
• In 1998-99, over 115 million passengers used urban rail transit
statewide.
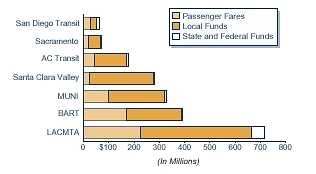
Fares and Local Funds Comprise the Bulk
of Transit Revenues
1998-99 Estimated
• Transit services are funded by a combination of passenger fares and
local, state, and federal funds.
• Local funds such as local sales tax revenues provide the largest source
of operating funds. The Santa Clara Valley Transportation Authority estimated
that about 89 percent of its revenues in 1998-99 came from local sources. The
Los Angeles County Metropolitan Transportation Authority estimated that local
funds comprised about 61 percent of its total revenues in 1998-99.
• Passenger fares comprise an important source of revenues for operators.
For instance, BART generated about 43 percent of its total revenues in
1998-99 from passenger fares—more than any of the other transit operators
shown.
• The proportion of total revenues from state and federal funds varied
among transit operators. These revenues are estimated to range from 0.2 percent
of BART's total revenues (about $0.9 million) in 1998-99 to 19 percent
for San Diego Transit (about $11.6 million).
Return
to California Travels Table of Contents
Return
to LAO Home Page