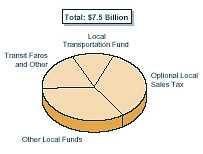
• We estimate that local revenues will generate approximately $7.5 billion in 1999-00. Of this total:
• Optional local sales taxes represent the
single largest source, raising an estimated $2.6 billion. These revenues fund highway improvements, local streets and roads, as well as transit improvements.
• Other local funds, totaling an estimated $2.5 billion in 1999-00, are spent out of local general funds, bond proceeds, fines and forfeitures, and road taxes.
• The Local Transportation Fund (LTF) which receives revenues from a 0.25 percent tax on all sales, raises an estimated $991 million in 1999-00. The funds, generated under the Transportation Development Act (TDA) enacted in 1971, provides a significant source of local funds for transit operating assistance and capital projects.
• We estimate that local revenues dedicated to transit, including transit
fares, property taxes, and local operating assistance, constitute about 20 percent
of all local transportation revenues in 1999-00.
| Agency | Tax Rate (%) |
Year Established | Year Expires | Revenues in Millions (1998-99) |
| Transit Districts (Permanent Taxes) | ||||
| BART | 0.5% | 1970 | None | $219 |
| LACMTA | 1.0 | 1981 & 1991 | None | 901 |
| San Mateo County | 0.5 | 1982 | None | 54 |
| Santa Clara VTA | 0.5 | 1976 | None | 138 |
| Santa Cruz Metropolitan | 0.5 | 1979 | None | 13 |
| Subtotals | $1,325 | |||
| County Authorities (Temporary Taxes) | ||||
| Alameda | 0.5% | 1987 | 2002 | $89 |
| Contra Costa | 0.5 | 1989 | 2009 | 51 |
| Fresno | 0.5 | 1987 | 2007 | 35 |
| Imperial | 0.5 | 1990 | 2010 | 6 |
| Madera | 0.5 | 1990 | 2005 | 4 |
| Orange | 0.5 | 1991 | 2011 | 179 |
| Riverside | 0.5 | 1989 | 2009 | 70 |
| Sacramento | 0.5 | 1989 | 2009 | 68 |
| San Bernardino | 0.5 | 1990 | 2010 | 73 |
| San Diego | 0.5 | 1988 | 2008 | 157 |
| San Francisco | 0.5 | 1990 | 2010 | 62 |
| San Joaquin | 0.5 | 1991 | 2011 | 27 |
| San Mateo | 0.5 | 1989 | 2009 | 54 |
| Santa Barbara | 0.5 | 1989 | 2010 | 22 |
| Santa Clara | 0.5 | 1996 | 2005 | 138 |
| Subtotals | $1,035 | |||
| Totals | $2,360 | |||
Background
• Optional local sales taxes for transportation originated in 1970, when the Legislature authorized several counties served by the Bay Area Rapid Transit (BART) District to impose a regional sales tax.
• Since then, the Legislature has authorized counties to impose (subject to voter approval) special half-cent sales taxes for transportation purposes. In most cases, the authorization also requires that voters be provided with an expenditure plan that describes how the new funds would be used.
Currently
• There are currently 21 different local sales taxes (including two in Los Angeles County) levied throughout the state for transportation purposes; these taxes collectively raised about $2.4 billion in 1998-99.
• Of the 21 separate taxes, 6 are imposed indefinitely while 15 of them—which raise about $1 billion annually—have sunset dates that will expire at some point over the next 11 years.
• Today, 85 percent of California's population lives in a county in which an additional half-cent sales tax is levied locally for transportation.
Supreme Court Decision
• In 1995, the State Supreme Court ruled that passage of such taxes requires a two-thirds vote; consequently extension of existing measures will also require approval by two-thirds of local voters.
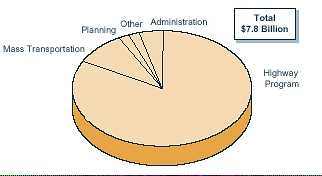
• The 2000-01 budget introduced in January 2000 proposes to spend over 80 percent of state transportation expenditures on highways.
• Highway expenditures include highway maintenance, rehabilitation, operations, design and engineering, environmental review, right-of-way acquisition, and construction.
• Mass transportation constitutes about 9 percent of total state transportation expenditures. These include expenditures for intercity rail service, state transit assistance, and transit capital improvements.
• Planning and administration constitute about 6 percent of the state's total transportation expenditures.
• "Other" expenditures include the cost for Caltrans' vehicles
and equipment and the Aeronautics program which provides grants and assistance
for the development of general aviation airports.
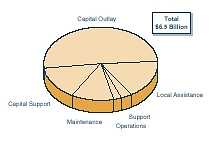
• Capital outlay purposes constitute about half of Caltrans' highway expenditures, include highway and bridge rehabilitation, expansion, right-of-way
acquisition, bridge repairs, and safety improvements.
• Capital project support accounts for approximately 15 percent of highway expenditures including design and engineering and environmental review.
• Local assistance constitutes 17 percent of highway expenditures. This consists primarily of federal funds that are passed through Caltrans to local agencies. A large share of these funds must be used for projects designed to improve air quality, such as acquisition of new transit vehicles or construction of high occupancy vehicle (HOV) lanes.
• Maintenance constitutes about 12 percent of expenditures. It includes roadway repairs, landscape maintenance and improvements, and snow and litter removal.
• Operations constitutes about 2 percent of expenditures. Projects are designed to improve the efficiency of the highway system, such as traffic management centers, ramp meters, and changeable message signs.
• Other support, about 3 percent of expenditures, includes
Caltrans' legal costs, new technology research, and costs related to scheduling
and tracking projects.
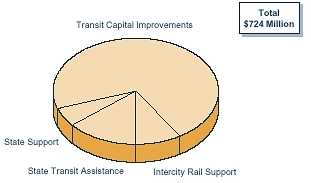
• Most state mass transportation expenditures provide assistance to local and regional agencies for transit operations and capital (equipment and facilities) improvements.
• Transit capital improvements account for the large majority of these expenditures (or 71 percent).
• State Transit Assistance (STA) constitutes about 14 percent of total proposed mass transportation expenditures. These funds are distributed by formula statewide to regional transportation planning agencies, who then apportion the funds to transit operators for operating assistance, maintenance, and capital acquisition purposes.
• Support for intercity passenger rail service accounts for about 10 percent of total state mass transportation expenditures.
• Expenditures for state support, including mass transportation
planning and administrative support, is about 5 percent of total proposed
expenditures.
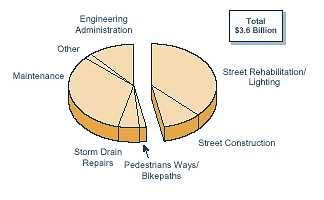
• Almost half of local street and road expenditures are spent on street rehabilitation, construction, and lighting projects.
• Maintenance constitutes the second largest share of local street and road expenditures—consuming one-third of annual expenditures.
• Engineering and administration constitute the third largest expenditure item—accounting for about 11 percent of annual expenditures.
• The remaining 9 percent of expenditures are split between storm
drain repairs, pedestrian and bicycle facilities, and other expenditures.
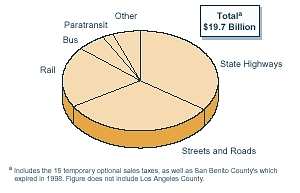
• Currently 16 counties, including Los Angeles County, impose an optional local sales tax for transportation purposes. (These counties are commonly referred to as the "self-help" counties and they do not include Santa Cruz County whose sales tax is permanent and dedicated to transit.)
• These counties have chosen to spend their revenues on a combination of highways, local streets and roads, and mass transit. Excluding Los Angeles County, for which data are not available, total revenues are projected to be spent as follows:
• 35 percent on highway improvements.
• 32 percent on streets and roads.
• 20 percent on commuter and urban rail improvement.
• 6 percent on buses.
• Remainder on paratransit and other (including pedestrian facilities
and bikeway improvements).
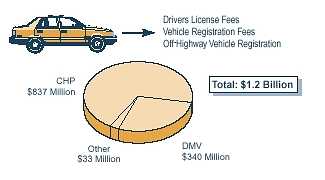
• In addition to fuel taxes, Californians also pay vehicle registration fees and driver license fees in order to operate vehicles.
• The use of these fee revenues is restricted by the State Constitution. In general, they can be used only for the state administration and enforcement of traffic and vehicle laws.
• In 2000-01, the budget proposes to spend about $1.2 billion for
traffic enforcement purposes. About 70 percent of these expenditures will
support the California Highway Patrol, and 28 percent will support the
Department of Motor Vehicles.
Return to California Travels Table of Contents