
 |
California's Fiscal OutlookLAO Projections 1999-00 to 2001-02Part IV |
In this chapter, we discuss our General Fund expenditure projections for 1999-00 through 2004-05. We first look at general budget trends during the forecast period, and then discuss expenditure projections for each of the major program areas in more detail.
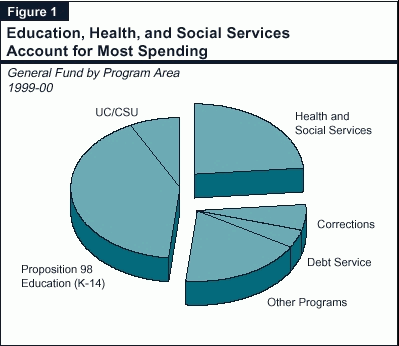
Figure�1 (see page 20) shows how General Fund spending is distributed among major programs in 1999-00. Slightly less than half of the total is devoted to education spending, of which 41�percent is for Proposition�98 education (K-14) and about 7�percent is for University of California (UC) and California State University (CSU). Slightly less than one-fourth of the budget is for health and social services, and 6�percent is for corrections. The remainder is for state operations, debt service, various local subventions (including the vehicle license fee [VLF] backfill), and other purposes.
Total General Fund Spending. Figure�2 (see page 21) presents our General Fund spending forecast by major program area through 2004-05. Total spending is projected to increase from $58.6�billion in 1998-99 to $64.9�billion in 1999-00, then to $67.5�billion in 2000-01. Over the full forecast period, General Fund expenditures are projected to increase at an average annual rate of about 6.1�percent per year, rising to $83.7�billion by 2004-05. This increase includes the impact of increased local subventions associated with VLF reductions. Spending for all programs excluding the VLF subventions grows at a more moderate average rate of 5.3�percent.
| Figure 2 | ||||||||||
| Projected General Fund Spending for Major Programsa | ||||||||||
| (Dollars in Millions) | ||||||||||
| Average Annual Growth 1998-99 Through 2004-05 | ||||||||||
| Actual | Estimated | Projected | ||||||||
| 1998-99 | 1999-00 | 2000-01 | 2001-02 | 2002-03 | 2003-04 | 2004-05 | ||||
| Education programs | ||||||||||
| Proposition 98/K14 education | $24,773 | $26,459 | $27,758 | $29,053 | $30,225 | $31,539 | $32,837 | 4.8% | ||
| UC and CSU | 4,505 | 4,815 | 5,080 | 5,393 | 5,698 | 5,996 | 6,289 | 5.7 | ||
| Health and Welfare programs | ||||||||||
| Medi-Cal benefits | $7,026 | 7,484 | 8,035 | 8,622 | 9,089 | 9,531 | 10,001 | 6.1% | ||
| CalWORKs | 2,025 | 1,997 | 1,807 | 1,964 | 2,214 | 2,276 | 2,489 | 3.5 | ||
| SSI/SSP | 2,244 | 2,472 | 2,648 | 2,792 | 2,948 | 3,117 | 3,289 | 6.6 | ||
| Selected other programs | 2,967 | 3,310 | 3,603 | 3,973 | 4,288 | 4,615 | 4,824 | 8.4 | ||
| Department of Corrections | $3,721 | 3,958 | 4,117 | 4,333 | 4,530 | 4,759 | 4,973 | 5.0% | ||
| Vehicle license fee subventions | $557 | 1,467 | 1,780 | 2,276 | 3,406 | 4,193 | 4,483 | 41.6% | ||
| Debt serviceb | $2,355 | 2,566 | 2,774 | 2,897 | 2,967 | 3,015 | 3,160 | 5.0% | ||
| Other programs/costs | $8,406 | 10,349 | 9,878 | 10,444 | 10,655 | 11,024 | 11,388 | 5.2% | ||
| Totals | $58,579 | $64,877 | $67,479 | $71,748 | $76,060 | $80,064 | $83,733 | 6.1% | ||
| a Detail may not total due to rounding. | ||||||||||
| b Includes both general obligation and lease-payment bonds. | ||||||||||
Projections by Program Area. The overall 6.1�percent increase in state spending reflects divergent trends among the General Fund's major programs. As indicated in Figure�2:
The state's subvention to local governments to backfill VLF tax relief is projected to increase from $557�million in 1998-99 to $4.5�billion by 2004-05. Our estimates assume that all of the potential future VLF tax reductions previously agreed to will be triggered, lowering the VLF tax rate from 2�percent in 1998 down to 0.65�percent by 2003 and thereafter.
In response to federal welfare reform legislation, the Legislature created the California Work Opportunity and Responsibility to Kids (CalWORKs) program in 1997. This program, which replaced the Aid to Families with Dependent Children (AFDC) program, provides cash grants and welfare-to-work services to families with children whose incomes are not adequate to meet their basic needs.
The Spending Forecast. In recent years, General Fund spending for CalWORKs has declined, despite increasing costs for welfare-to-work services and support services such as child care. This overall decline in expenditures is due to a combination of caseload reductions and the shift from a federal matching requirement to a block grant in federal Temporary Assistance for Needy Families (TANF) funds. Since 1995-96, General Fund spending on the AFDC/CalWORKs program has decreased by $700�million.
General Fund spending in 1999-00 for the CalWORKs program is estimated to be $2�billion, a reduction of 1.4�percent from the prior year. For 2000-01, we project a 10�percent decrease in General Fund spending. Beginning in 2001-02, we project that General Fund spending will increase each year (by about 8�percent annually), eventually reaching a total of $2.5�billion in 2004-05.
Key Forecast Factors. In 1998-99, unexpectedly slow implementation of the CalWORKs program resulted in a $654�million savings in employment services which were carried over into the budget year. These "county carry-over funds" were counted as a funding source in the 1999-00 Budget Act. A review of actual expenditures for 1998-99, however, indicates that the county carry-over will be about $300�million greater than anticipated. Thus, we assume those funds ($300�million) will be carried over to 2000-01. In combination with these county carry-over balances, available federal TANF funds, caseload reductions, and a reduction in the TANF maintenance-of-effort requirement (because California is in compliance with federal work participation requirements) will permit California to reduce General Fund spending to $1.8�billion in 2000-01.
By 2001-02, available TANF and county carry-over balances will decline somewhat, resulting in an increase in expenditures to $2�billion in that year. For 2002-03, we project that all carry-over balances will have been exhausted and spending will increase to $2.2�billion. For the remainder of the forecast period, General Fund expenditures will continue to increase, primarily due to costs associated with projected small increases in the caseload and providing the statutory COLA, offset by some savings from statutory time limits on aid that result in grant reductions.
Caseload Trends and Projections. Following a period of rapid increase in the early 1990s, the caseload peaked at 921,000 in 1994-95 and has declined by 30�percent since that time. The caseload reduction was 13�percent in 1997-98 and 12�percent in 1998-99. A caseload reduction of 9�percent is expected for 1999-00, based on partial-year data. We project that the caseload reduction will slow to 7�percent in 2000-01 and 5�percent in 2001-02. We further project the caseload will be flat in 2002-03 and then grow by 1.6�percent in 2003-04 and 2.5�percent 2004-05. These projections are based on (1) a trend analysis of caseloads, birth rates, grant levels, and unemployment rates; and (2) an estimate of the caseload impact of state welfare reform interventions--primarily additional welfare-to-work services and the implementation of the community service work requirement after two years on aid.
Child-Only Cases On the Rise. While the overall CalWORKs caseload has been declining during the past few years, one segment of that caseload--child-only cases--has been increasing. Examples of child-only cases include situations where the parents are undocumented immigrants or the children are being cared for by a nonneedy relative. In 1995, about 21�percent of the AFDC caseload was comprised of child-only cases. As of June 1999, the percentage of child-only cases had increased to approximately 33�percent. Figure 3 shows that cases with adults have been declining rapidly, while the child-only caseload stayed constant during the early-to-mid 1990s before beginning to increase over the past 18 months.
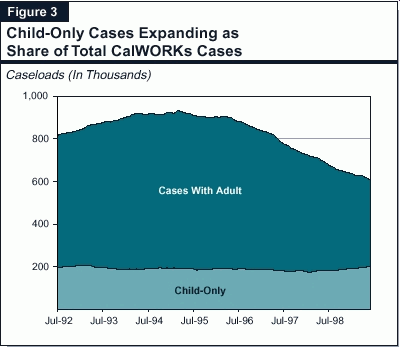
This trend toward more child-only cases is likely to continue assuming the expanded CalWORKs participation mandate will result in an increased level of sanctions. (The sanction for failure to participate in work or related activities is removal of the adult from the grant calculation, thus creating a child-only case.) The increase in child-only cases has resulted in budgetary savings for two reasons. First, child-only cases have relatively lower grant costs because there are fewer aided individuals in the case. Second, because there is no adult in the case, there is no need to provide welfare-to-work services such as education, training, and child care.
The TANF Block Grant Reauthorization Creates Uncertainty. The TANF block grant is authorized by Congress through federal fiscal year (FFY) 2002. Our forecast presented above assumes that the TANF block grant will be reauthorized at its current $3.7�billion level for California. We note, however, that since the enactment of federal welfare reform in 1996, the number of TANF recipients nationwide has declined by approximately 40�percent, and as a result there have been some proposals at the federal level for reductions in the block grant.
The Supplemental Security Income/State Supplementary Program (SSI/SSP) provides cash assistance to eligible aged, blind, and disabled persons. The SSI component is federally funded and the SSP component is state funded.
The Spending Forecast. General Fund spending for SSP is projected to be about $2.5�billion in 1999-00, an increase of 10�percent over the prior year. For 2000-01 we project an increase of 7.1�percent, raising total expenditures to $2.6�billion. We project that from 2001-02 through the end of the forecast period, spending for SSP will increase by approximately 5.5�percent per year, eventually reaching a total of $3.3�billion in 2004-05.
Key Forecast Factors. The $228�million spending increase in 1999-00 primarily results from (1) the full-year cost of the Cash Assistance Program for Immigrants (CAPI),which provides state-only funded benefits to certain noncitizens who are not federally eligible; (2) the statutory COLA; and (3) caseload growth. In 2000-01, spending is projected to increase by $176�million. This increase is primarily due to caseload growth ($56�million) and the statutory COLA ($114�million). From 2001-02 through 2004-05, we project spending to increase by an average of $160�million per year, mostly because of caseload growth and the statutory COLA.
Historical Context. We project that General Fund spending on SSI/SSP will moderate from its current annual average growth rate of about 10�percent to an average of just under 6�percent from 2000-01 through the end of the forecast period. This growth rate is in contrast to trends in the earlier part of this decade. From 1992-93 through 1996-97, annual spending either decreased (by nearly 10�percent in some years) or increased by no more than 1�percent. This period of decreasing and/or slow growth in spending resulted from a combination of grant reductions, COLA suspensions, and federal eligibility changes. In 1997-98, spending grew by about 2�percent. For the final two fiscal years of the decade, spending increased by 10�percent annually, mostly due to reinstating the statutory COLA, a 1�percent grant increase above the COLA in 1998-99, and the creation of the CAPI.
Caseload Trends and Projections. During the late 1980s and early 1990s the caseload grew rapidly, with most of the growth being in the disabled component of the caseload (see Figure 4). In the mid-to-late 1990s, the caseload leveled off and declined by 1.2�percent in 1997-98. This period of essentially no growth is partially attributable to federal policy changes that (1) eliminated drug and alcohol addiction as qualifying disabilities, (2) made certain legal noncitizens ineligible for assistance, and (3) restricted eligibility for certain relatively less disabled children. Since March 1998, the caseload has been growing.
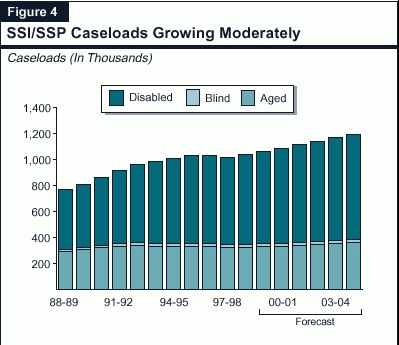
In the long run, we expect the aged component of the caseload to mirror the growth of the overall population over age 65. For the disabled, we anticipate caseload growth will be similar to the past year. In total, we project that the caseload will grow by about 2.5�percent during each of the next five fiscal years (2000-01 through 2004-05).
The Medi-Cal program (the federal Medicaid Program in California) provides health care services to recipients of CalWORKs and SSI/SSP grants, and to other low-income persons who meet the program's eligibility criteria (primarily families with children and the elderly, blind, or disabled). The state and federal governments share most of the costs of the program on a roughly equal basis.
The Spending Forecast. We estimate that General Fund spending for Medi-Cal benefits (excluding administrative costs) will be almost $7.5�billion in 1999-00, which is $348�million more than the amount appropriated in the budget act. The following four adjustments account for the bulk of the difference from the budget act appropriation:
We project that by the end of the forecast period in 2004-05, General Fund spending for Medi-Cal benefits will reach $10�billion, an average annual increase of 6�percent.
Key Forecast Factors. Three factors play a major role in our forecast:
These estimates, however, are subject to significant uncertainty for two reasons. First, recent caseload trends are somewhat obscured by the backlog of unprocessed cases of former CalWORKs recipients. These recipients have been retained in the Medi-Cal program pending redetermination of their Medi-Cal eligibility. We have assumed that 65�percent of these recipients will be found eligible for Medi-Cal. To the extent that actual eligibility rates differ from this assumption, our projections would be affected accordingly.
Second, recent legislation to expand and simplify Medi-Cal eligibility also makes our forecast subject to uncertainty. Chapters 146 and 148, Statutes of 1999 (the 1999-00 budget trailer legislation for health programs) require simplification of the eligibility process and extend Medi-Cal family eligibility to parents in working families with incomes up to 100�percent of the poverty level, effective March 2000. (Children in these families are currently eligible.) Our forecast includes an increase of 76,600 average monthly eligibles in the current year and about 235,000 in subsequent years due to this expansion.
These health care cost projections are subject to uncertainty, and small changes in the rate of growth of health care costs could have significant fiscal effects. For example, increasing the annual future growth rate of Medi-Cal costs from 5�percent (as assumed in our forecast) to 6�percent would increase General Fund spending by a cumulative total of $1.3�billion over the forecast period.
This section reviews our estimates of state Proposition�98 expenditures for K-14 education (K-12 schools and community colleges).
Proposition�98 sets the minimum amount that the state must provide for California's public K-12 education system and the California Community Colleges (CCC). About 80�percent of operations funding for these school programs is from the state General Fund and local property taxes, pursuant to Proposition�98. Public K-12 education is provided to about 5.8�million students--ranging from infants to adults--through over 1,000 locally governed school districts and county offices of education. The CCC provide instruction to about 1.5�million adults at 107 colleges operated by 72 locally governed districts.
The Spending Forecast. We estimate that annual growth in total Proposition�98 spending (General Fund and local property taxes) for K-14 education will be slightly less than 5�percent for the forecast period (1999-00 through 2004-05). This is lower than the 8.3�percent increase in 1998-99 and the projected increase of 6.5�percent for the current year. Proposition�98 spending in these two years reflects appropriations above the minimum guarantee. For these two years, the cumulative appropriation above the guarantee is about $440�million, which raises the Proposition�98 base for all future years. Our forecast reflects our moderate revenue forecast and future spending at the minimum guarantee level.
Key Forecast Factors. General Fund expenditures for Proposition�98 depend on the following factors: state population, K-12 average daily attendance, per capita personal income, per capita General Fund revenues, and local property taxes. Figure 6 (see page 28) summarizes our assumptions for these factors and the guarantee which results. Our economic forecast assumes state tax revenues will grow by about 5.5�percent annually over the forecast period.
| Figure 6 | ||||||
| LAO Proposition 98 Forecast | ||||||
| Annual Percent Change | ||||||
| 1999-00 | 2000-01 | 2001-02 | 2002-03 | 2003-04 | 2004-05 | |
| State population | 1.8% | 1.8% | 1.7% | 1.7% | 1.6% | 1.6% |
| K-12 average daily attendance | 1.5 | 1.2 | 0.9 | 0.7 | 0.5 | 0.6 |
| Per-capita personal income | 4.5 | 4.5 | 4.1 | 3.8 | 3.8 | 4.0 |
| Local property taxes | 5.9 | 6.7 | 6.0 | 5.6 | 5.6 | 5.6 |
| Proposition 98 minimum guaranteea | 6.5 | 5.4 | 5.1 | 4.5 | 4.8 | 4.6 |
| a General Fund and local property taxes. | ||||||
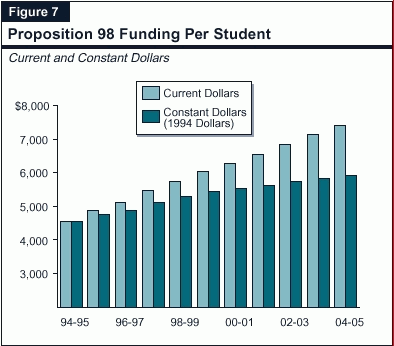
K-12 Funding Projections. Figure 7 displays our projected K-12 per-pupil spending from 1994-95 through 2004-05 (in both "current" and inflation-adjusted dollars). These estimates, which are derived from our Proposition�98 forecast, reflect real (that is, inflation adjusted) per-pupil increases of about 1.6�percent each year between 1999-00 and 2004-05. These additional resources--amounting to over $500�million each year--would permit modest expansion of existing programs and/or funding for some new programs.
Community College Funding Projections. Based on our Proposition�98 projections, we estimate total CCC funding will increase by about 5�percent per year over the forecast period. (This assumes no change in the proportion of Proposition�98 funds going to the CCC.) These increases would cover inflation and projected enrollment growth, with little or nothing available for new programs or program augmentations.
In addition to community colleges, the state's public higher education system includes the University of California (UC) and the California State University (CSU). The UC consists of eight general campuses, one health science campus, numerous special research facilities, and a planned tenth campus in Merced. The UC awards bachelor's, master's, and doctoral degrees, as well as various professional degrees. The UC has primary jurisdiction over research. The CSU consists of 22 campuses, several off-campus centers, and a planned campus at Camarillo. The CSU grants bachelor's and master's degrees and may award doctoral degrees jointly with UC or a private university.
The Spending Forecast. We estimate that spending for UC and CSU (excluding funding for debt service) will increase from $4.8�billion in 1999-00 to $5.1�billion in 2000-01, or by 5.5�percent. For 2001-02, we estimate that spending for UC and CSU (excluding funding for debt service) will increase to $5.4�billion, or by 6.2�percent compared to 2000-01.
Key Cost Factors. For 2000-01 and subsequent fiscal years, we assume that UC and CSU will receive "base" budget increases equivalent to the growth in inflation and enrollments. Over the forecast period, inflation is projected to average about 2.5�percent annually and enrollment for the two segments combined is forecast to grow an average of about 3�percent per year. We assume student fees at UC and CSU will increase by about 2.5�percent per year to keep pace with inflation.
The major state judiciary and criminal justice programs include support for four agencies in the executive branch--the California Department of Corrections (CDC), Department of the Youth Authority, the Department of Justice, and the Office of Criminal Justice Planning--as well as expenditures for local trial courts and state appellate courts. The largest expenditure program--the CDC--is discussed in more detail below.
The CDC is responsible for the incarceration, training, education, and care of adult felons and nonfelon narcotics addicts at 33 state prisons. The CDC also supervises and provides services to parolees released to the community.
The Spending Forecast. The department's General Fund support budget is forecast to grow between 1998-99 and 2000-01 by about $396�million, reaching about $4.1�billion at the end of that period. We further project that annual CDC support expenditures will reach almost $5�billion by the 2004-05 fiscal year. (This includes adjustments for employee compensation increases but does not include General Fund support for capital outlay or lease-payment bonds, which are accounted for elsewhere in our projections.)
The department's General Fund costs will be partially offset by reimbursements from the federal government for the state's costs of housing undocumented immigrants convicted of felonies in California.
We expect federal support to drop from $173�million in 1998-99 to $161�million by 2004-05. Although our estimate assumes that Congress will continue to provide the same total level of funding to reimburse states as it has in the past two years ($585�million nationwide), we assume that California's share of the total will decline somewhat as other states and local governments become more sophisticated at tracking their costs for incarcerating undocumented felons and making claims to the federal government.
The projected growth in adult correctional expenditures continues a trend of steadily larger CDC budgets that has existed since the early 1980s. However, in a change from our past projections, the CDC budget now appears likely to grow significantly more slowly than in the past. Under our new projections, the CDC support budget would grow at an average annual rate of about 5�percent through 2004-05. Throughout the projection period, the CDC General Fund support budget is forecast to be about 6�percent of total General Fund expenditures, the lowest share it has been of the General Fund since 1992-93.
Key Forecast Factors. The continued projected increases in General Fund support for CDC reflect the continued growth in the prison inmate population that is expected during the forecast period. Our estimates through 2004-05 are based on the CDC's projections that the inmate population will exceed 183,000 by June 2005. That represents an increase of as many as 21,000 inmates, or about 13�percent, over the six-year projection period. (The population projections are shown graphically in Figure 8.)
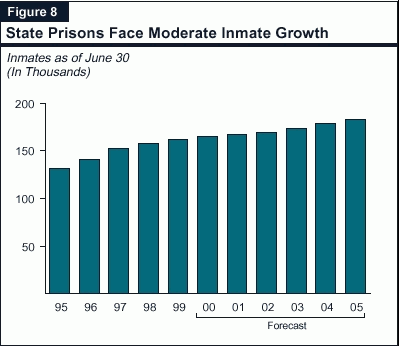
Notably, the inmate population is still trending upward even though the number of offenders being sentenced to prison each year by the courts has dropped somewhat. The continued growth in inmate population is primarily the result of tougher sentencing measures approved by the Legislature, Governor, and the voters, including the "Three Strikes and You're Out" law enacted in 1994. Under the Three Strikes law, many offenders being sent to state prison are receiving longer prison sentences than they would have received in the past for the same crimes.
The projected rate of growth in the inmate population is lower than CDC had foreseen in the past. Just one year ago, CDC expected the inmate population to climb to about 216,000 inmates by June 2005, or by about 33,000 more inmates than it currently projects will be held in state prison as of that same date.
Because the state will have to accommodate 33,000 fewer prisoners by June 2005, the CDC budget will grow less rapidly than would otherwise have been the case. Our projections assume, however, that the savings resulting from a slowdown in the growth of the inmate caseload will be partly offset by significant increases in personnel and other CDC operating costs.
The slower pace of growth in the inmate population also has significant ramifications for CDC operations. In recent years, faced with continued growth in the inmate population and the overcrowding of its existing prison facilities, the Legislature and Governor approved construction and acquisition of additional space for state prison inmates and initiated new programs intended to prevent inmates released on parole from returning to state custody for new crimes. The markedly slower pace of inmate population growth means that it is now likely that the existing space in the prison system, combined with the steps taken recently to address the long-term prison capacity needs of CDC, will be sufficient to meet the state's prison capacity needs at least until the end of the 2005-06 fiscal year.
A prolonged drop in crime rates, particularly crimes against persons which are likely to result in felony prosecution and a state prison commitment, appears to be contributing to the slower growth in the prison population. A number of factors may be behind the drop in crime, including:
The vehicle license fee (VLF) is an annual fee on the ownership of a registered vehicle in California, levied in place of taxing vehicles as personal property. The revenues are distributed to cities and counties. As part of the 1998 budget agreement, the VLF was permanently cut by 25�percent, with the potential of additional reductions beginning in calendar year 2001 if specific revenue levels (or "triggers") are reached. (These potential reductions range from 35�percent to 67.5�percent.) In order for any of the additional reductions to become permanent, the corresponding revenue triggers need to be reached in two consecutive years.
As part of this year's budget agreement, the cumulative reduction was increased to 35�percent for calendar year 2000 only, without affecting the previously agreed to triggers.
For all VLF reductions, cities and counties continue to receive the same amount of revenues as under prior law, with the reduced VLF amounts replaced by General Fund spending. The General Fund will spend nearly $1.5�billion in 1999-00 to backfill revenues to local governments.
Under our current revenue projections, the first trigger will be "pulled," resulting in the continuation of the cumulative 35�percent reduction through calendar year 2001. We are also projecting that each of the maximum attainable reduction levels will be reached through 2003-04. As a result, under our forecast, the VLF cumulative reduction would be 67.5�percent beginning in 2003-04, with a backfill cost of more than $4�billion in that year. Figure 9 (see page 32) shows the estimated VLF backfill expenditures under our forecast, as well as the corresponding VLF reduction percentages.
| Figure 9 | |||||||||||||||
| Vehicle License Fee (VLF) Backfill
Projected Reductions and Costs | |||||||||||||||
| (Dollars in Billions) | |||||||||||||||
| Calendar Year | 1999 | 2000 | 2001 | 2002 | 2003 | ||||||||||
| VLF Reduction | 25.0% | 35.0%a | 35.0% | 46.5% | 67.5%b | ||||||||||
| Fiscal Year | 1999-00 | 2000-01 | 2001-02 | 2002-03 | 2003-04 | ||||||||||
| VLF Backfill | $1.5 | $1.8 | $2.3 | $3.4 | $4.2 | ||||||||||
| a Reflects a temporary additional increase. | |||||||||||||||
| b Both the 55 percent and 67.5 percent reductions would trigger in this year. | |||||||||||||||
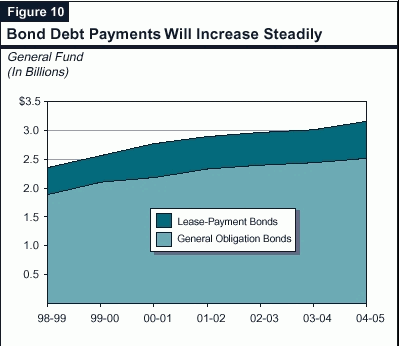
Debt Payments. As shown in Figure�10, we estimate that General Fund debt costs (for general obligation and lease-payment bonds) will increase from $2.4�billion in 1998-99 to about $3.2�billion in 2004-05. This is an average annual increase of 5�percent. Our forecast assumes that almost $15�billion (an average of around $2�billion each year) in bonds will be sold over the forecast period. As a percent of total debt, lease-payment bond debt remains at about 20�percent throughout the forecast period based on currently authorized lease-payment bonds.
Debt Ratio. The state's debt ratio (debt payments as a percent of General Fund revenues) increased from 2.5�percent in 1990-91 to a high of 5.1�percent in 1994-95. In recent years, General Fund revenues have increased at a faster rate than the increase in debt payments. Thus, the debt ratio declined to 4�percent in 1998-99. We estimate that with the sale of bonds assumed in our forecast, the debt ratio will increase to 4.1�percent in 2000-01 and decline gradually thereafter. Sales of a larger amount of bonds resulting from voter approval of more general obligation bonds than we have assumed or legislative authorization of new lease-payment bonds would, of course, increase the debt ratio.