
|
California's Fiscal OutlookLAO Projections 1999-00 to 2001-02Part II |
Economic and demographic developments in California have important effects on the state's fiscal condition. These factors affect both revenues--through their impacts on tax receipts--and expenditures--through their impacts on caseloads, cost-of-living adjustments, and other factors affecting state programs. This chapter presents our economic and demographic projections for 1999 through 2005, which will affect California's fiscal condition during fiscal years 1999-00 through 2004-05.
Our economic forecast assumes that both the nation and California will experience continued solid, though moderating, economic growth during the forecast period. Our U.S. and California economic outlooks are summarized in FigureĀ1 (see page 8). These new projections are more optimistic than our previous forecast (prepared in May 1999), reflecting a variety of positive developments at both the state and national levels.
| Figure 1 | |||||||
| The LAO's Economic Forecast
1999 Through 2005 | |||||||
| Percent Change (Unless Otherwise Indicated) | |||||||
| 1999 | 2000 | 2001 | 2002 | 2003 | 2004 | 2005 | |
| United States | |||||||
| Real gross domestic producta | 3.9% | 2.8% | 2.6% | 2.2% | 2.6% | 2.4% | 2.6% |
| Wage and salary jobs | 2.2 | 2.7 | 1.1 | 1.1 | 1.2 | 1.2 | 1.1 |
| Consumer Price Index (CPI) | 2.4 | 2.8 | 2.0 | 2.4 | 2.5 | 2.5 | 2.6 |
| Unemployment rate (%) | 4.2 | 4.2 | 4.3 | 4.6 | 4.7 | 4.9 | 5.1 |
| Housing starts (000) | 1,675 | 1,568 | 1,545 | 1,499 | 1,504 | 1,515 | 1,510 |
| California | |||||||
| Personal income | 6.7% | 6.1% | 5.5% | 5.2% | 5.4% | 5.7% | 5.6% |
| Wage and salary jobs | 3.5 | 3.1 | 2.5 | 2.2 | 2.3 | 2.4 | 2.4 |
| Taxable sales | 8.1 | 5.5 | 5.2 | 5.0 | 5.3 | 5.5 | 5.5 |
| Consumer Price Index (CCPI) | 2.9 | 3.1 | 2.5 | 2.7 | 2.8 | 2.8 | 2.9 |
| Unemployment rate (%) | 5.3 | 4.7 | 4.8 | 5.1 | 5.2 | 5.2 | 5.3 |
| New housing permits (000) | 139 | 153 | 165 | 170 | 175 | 180 | 190 |
| a Data do not reflect late-1999 revisions to the National Income and Product Accounts | |||||||
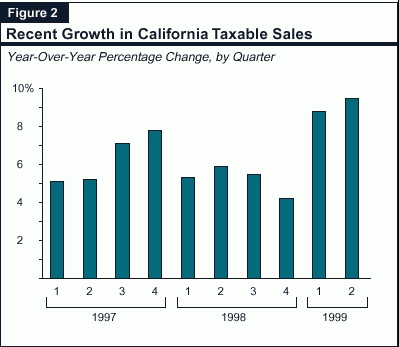
Economic growth continues to surpass expectations in 1999, as the U.S. and California economies appear to have both overcome problems associated with Asia's economic crisis, and avoided the resurgence of significant inflationary pressures. At the national level, the ongoing expansion has been led by unexpectedly strong consumer spending, particularly on automobiles and other durable goods. These trends also are evident in California, where taxable sales jumped by more than 9Āpercent in the first half of 1999--by far the largest increase in the 1990s (see FigureĀ2, page 8).
Many economists and industry analysts attribute the recent strength in consumer spending partly to the "wealth effect" associated with the major increases in stock market prices that have occurred in the 1990s. Other contributing factors include high levels of consumer confidence, favorable employment conditions for workers, and rising wages during the year.
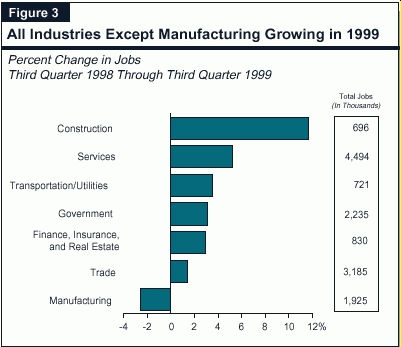
California's Employment Performance. During the past 12 months, California wage and salary employment has increased by about 3.5Āpercent. FigureĀ3 (see page 9) breaks down this job performance among key industries. It shows that the Asian economic crisis had negative impacts on California's manufacturing sector, where jobs fell by 2.8Āpercent between the third quarter of 1998 and the third quarter of 1999. Job losses were particularly evident in the computer, electronics, and aerospace sectors. Offsetting this decline, however, were widespread gains in nonmanufacturing industries such as construction, services, finance, and transportation. These latter industries benefitted from high levels of consumer and business confidence and spending in the state. The software side of the computer industry experienced particularly healthy growth during the year. The business services sector, for example, is up about 7Āpercent from the prior year, reflecting major gains in software development, computer systems design, and Internet-related business.
In other California developments, home sales and new construction continued to rebound in the first three quarters of 1999. Likewise, withholding receipts, which provide a good indication of current trends in wages and stock-option income, were up 14Āpercent in the July-through-September period.
Is Inflation Lurking? Despite the fact that the U.S. economy has been operating at near-full capacity for several years, inflation has remained subdued, held in check by high rates of productivity growth and low commodity prices. In recent months, though, increasing wholesale prices and compensation costs suggest that inflationary pressures are beginning to build. These factors have already prompted the Federal Reserve (FED) to raise interest rates in an attempt to slow the economy to a more noninflationary pace. Assumptions about the success of these efforts are very important elements in the near-term economic outlook.
Near-Term Outlook (1999 Through 2001). Our forecast assumes that the FED will be successful in its efforts to slow the economy to avoid inflation. As shown in FigureĀ1, we project that real gross domestic product (GDP) growth will slow from 3.9Āpercent in the current year to 2.8Āpercent in 2000, and further to 2.6Āpercent in 2001. The figure also shows that while projected inflation does accelerate modestly in 2000, it subsequently comes back down as economic growth subsides.
Longer-Term Forecast (2002 Through 2005). After dipping to 2.2Āpercent in 2002, we forecast that economic growth will slightly rebound to roughly 2.5Āpercent annually through the remainder of the forecast period. The outlook for these latter years is tied to assumptions about growth in the work force (estimated to be about 1Āpercent per year) and worker productivity (roughly 1.5Āpercent to 2Āpercent annually). Our forecast assumes that inflation, as measured by the Consumer Price Index, remains in the range of 2.5Āpercent to 3Āpercent per year during the 2002 through 2005 period.
Near-Term Forecast (1999 Through 2001). We expect that economic growth in California will follow the same general pattern as for the nation, with income, employment, and spending expanding by solid, but moderating, rates through 2001. As shown in FigureĀ4 (see page 10), we expect that economic growth in California will exceed the national average significantly during this period.
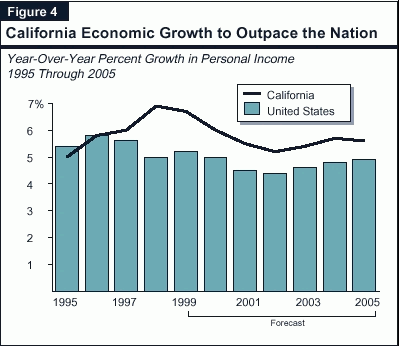
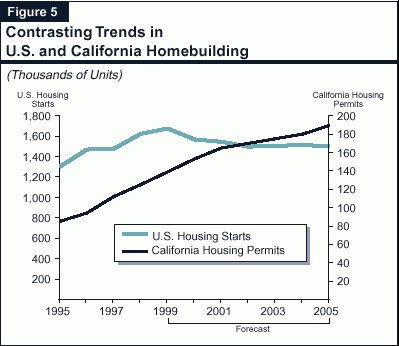
A key reason for this is that California is in an earlier stage of its business cycle, having emerged from the recession about two years later than the rest of the nation. Because of this, many industries and geographic regions within the state have a bit more "room" to grow before reaching labor supply constraints. Another factor is that, while home construction is expected to slow nationally, strong demand should keep home building on an upward track in California through the forecast period (see FigureĀ5). Finally, California's computer and electronics manufacturers will likely benefit from improving economic conditions in Asia, and the expected continuation of generally strong business investment in high-tech labor-saving equipment.
Longer-Term Outlook (2002 Through 2005). Our longer-term forecast assumes that California's economy continues to grow at a moderate pace through 2005. Our current projections assume that economic growth in the state will continue to exceed that for the nation as a whole, reflecting faster population growth and the state's favorable mix of high-tech industries.
Our U.S. and California forecasts have both upside potential and downside risks.
On the upside, although our current projections assume slightly higher productivity growth over the long term than our previous forecast, there are some economists who believe that large investments in new technologies will substantially raise productivity on an ongoing basis. This would imply that instead of a 2.5Āpercent to 3Āpercent "speed limit" for long-term economic growth, the U.S. economy could grow by more than 3Āpercent annually without incurring significant inflation.
On the downside, the national economy is currently in its ninth year of expansion, and is just three months shy of surpassing the 1960s' expansion--the longest on record. Given the advanced age of the expansion and the recent emergence of some inflationary pressures, many economists believe that the economy is vulnerable to unforeseen shocks, and could experience a downturn sometime in the next several years.
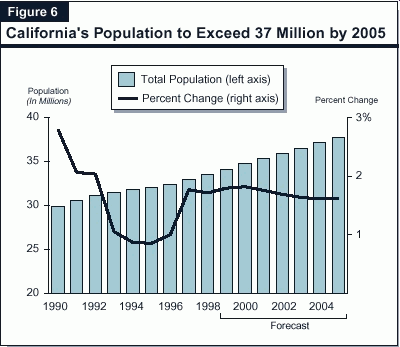
California's population, estimated to be 34.1Āmillion in 1999, is projected to grow at an average annual rate of 1.7Āpercent during the next six years. Thus, it will reach 37.7Āmillion by the year 2005. In numerical terms, this increase represents about 3.6Āmillion new residents--a population slightly smaller than the City of Los Angeles. California's population growth rate will be roughly double the national rate in each of the next six years.
Our year-to-year demographic projections are shown in FigureĀ6, which depicts both our projected total annual population and yearly percent changes. The projected pace of population growth is faster than what occurred in the first half of the 1990s, but is slower than the 2.3Āpercent pace of the 1980s.
Population Growth Components. California's population growth can be broken down into two major components--natural increase (the excess of births over deaths) and net in-migration (persons moving into California from other states and countries, minus people leaving the state for other destinations).
Natural Increase. The natural-increase component is projected to account for slightly over half of the state's total population growth, averaging about 309,000 persons per year. This amount is similar to recent levels and slightly above that of the 1980s, but significantly less than for the early 1990s, when natural increase averaged nearly 400,000. The decline largely reflects the aging of the baby boomers past their years of peak fertility, as well as declines in birth rates within younger age groups--especially the 15-to-19 age range.
Net In-Migration. We project that net in-migration will average about 290,000 per year during the forecast period, or slightly less than half of the projected total population increase. Current and projected net in-migration is significantly higher than for the recessionary years of the early 1990s, when it actually turned negative for three consecutive years.
Growth to Vary by Age Group. FigureĀ7 shows our population growth projections over the forecast period by broad age categories, both in numerical and percentage terms. In numerical terms, the 45-to-64 age group (baby boomers) easily dominates, followed by the 5-to-17 age group. In percentage terms, the 45-to-64 age group again leads the way, followed by 18-to-24 year olds.
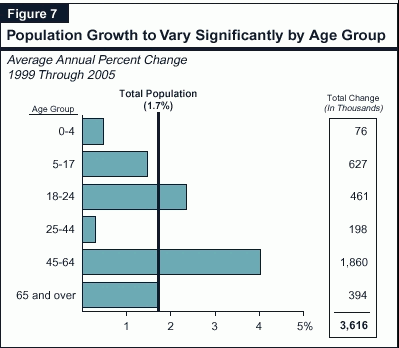
These various age-group demographic projections have significant implications for the state's expenditure outlook in many different program areas, including education, health, and social services. For instance, population growth in the 5-to-17 and 18-to-24 age groups are the single most important determinants of K-12 and higher education enrollments, respectively.