
School district revenues per student differ significantly throughout the state. For instance, per student revenue—including all local, state, and federal aid—in 1995-96 (the most recent data available) among California unified school districts ranged from $4,042 to $12,528 per student, with an average of $5,160.
No single funding source is responsible for the significant differences in revenue among districts. In part, the differences reflect additional funds available to districts that serve low-income students with specific needs. Funding differences also stem from historical and local economic factors. We explain in more detail below the magnitude of revenue differences among districts and some of the reasons for the gaps.
School districts in the state receive revenue from four sources: a district-specific "revenue limit" (which consists of state funds and local property tax revenues); other state funds (such as "categorical" aid for special education or class size reduction, and lottery funds); other local funds (such as "excess" property taxes); and federal aid. Each of these sources of revenue contribute to the variations in per student revenue.
Figure 1(see page 2) shows a breakdown of per student revenue by source of funds for unified school districts in 1995-96. Each bar represents approximately 10 percent of the total student population of unified school districts. For instance, the "bottom tenth" bar (at the left of the chart) represents the 10 percent of students in districts which have average per student revenue of $4,237—the lowest in the state. For each succeeding group, the average revenue rises slightly, except for the "top tenth," where there's a dramatic increase (for a total revenue per student of $7,588).
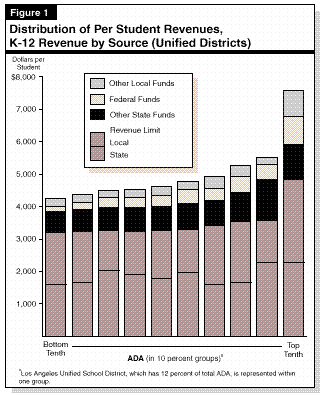
Although a wide gap exists between the low-revenue and high-revenue districts, most districts fall within a much narrower range. For instance, about half the districts fall within a $550 range around the statewide average ($5,160). Districts within this range receive similar amounts of revenue limit and other local funds. Variations in "other state" funds and federal funds explain the majority of the difference among these districts. Districts above this range claim significantly more revenue from all sources, but especially from "other state" and "other local" funds.
Approximately 70 percent of total school support was provided through the revenue limit funding mechanism in 1995-96. These funds provide for the basic instruction program in all districts. Figure 2 shows the distribution of the revenue limits of unified school districts. District revenue limits ranged from $2,955 to $12,497, with an average of $3,568. If, however, the top 5 percent of students were excluded, the remaining students fall within a band of $350 around the statewide average.
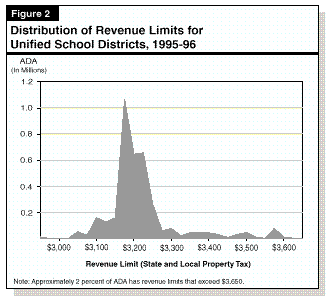
Higher-than-average revenue limits result from the way the state revamped school finance after the passage of Proposition 13. Districts with high revenue limits in 1978-79 still have high revenue limits today. Districts with low revenue limits in 1978-79 have received state equalization aid over the years so that the gap between high- and low-funded districts has narrowed substantially. (Figures 1 and 2 do not reflect additional equalization aid provided by the Legislature in 1996-97.)
Districts receive additional support through local taxes and fees. These contributions ranged from $88 to $6,404 per student, with an average of $367. As with revenue limits, the amount of "other local" funds is about the same for most districts. Approximately half of the districts received "other local" funds within a $150 band around the statewide average. Districts receiving the largest amounts of local revenue are usually higher property wealth areas that receive "excess" local property tax revenue. These are property tax revenues above the district's revenue limit. Under state law, districts may use these revenues for any purpose.
In addition to revenue limit funds, the state provides districts with other funds—such as categorical program assistance and lottery funds. Districts received between $410 and $3,597 per student in "other state" funds in 1995-96, with an average of $1,861. Some categorical funding (such as textbook, school improvement, and special education aid) is provided to virtually all districts. Other categorical programs (such as economic impact and desegregation aid) provided large amounts to relatively few districts. Each student receives the same amount of lottery funds, which in 1995-96 was approximately $130 per student, or 2.5 percent of average per student revenue.
Federal assistance to school districts in 1995-96 ranged from $40 to $5,732 per student, with an average of $416 per student. Like state categorical funds, there are some programs for which most schools receive funding and others, such as Title I, that provide a large amount of funds for a few schools. Title I provides schools serving high proportions of low-income students funds to improve school performance. Federal funds are also provided "in-lieu" of property tax payments for children of federal employees.
Contact—Jannelle Lee, Education Section—(916)445-8641
The economic expansion in California continues to broaden and strengthen in the second half of 1997. However, the performance of revenue collections in September, which is a key revenue month, was somewhat mixed. Total collections fell $208 million (3.9 percent) below the estimate for the month.
Economic Expansion Continues. After adjusting for the impact of the United Parcel Service strike on the August job totals, wage and salary employment has increased by about 30,000 during each of the past two months. This is virtually identical to the average monthly gain for the past year. California's expansion continues to be led by growth in high-technology manufacturing and services, but every major industry sector is sharing in the gains. Of particular significance is the meaningful improvement in California's real estate markets, where home sales, prices, and new construction are rebounding in most regions of the state. The improvement in construction activity should give an added boost to the California economy in 1998.
General Fund Revenue Performance Mixed. The $208 million shortfall in September leaves cumulative receipts for the first three months of 1997-98 $228 million (1.9 percent) below the budget act forecast. The softness for both September and the year to date is largely due to lower-than-expected quarterly estimated tax payments from both individuals and corporations. Although the softness in these payments is of some concern, it is too early to tell whether it is due to an underlying weakness in investment or business earnings, or whether it is simply due to the normal volatility inherent in these types of payments. On a more positive note, collections from sales taxes and withholding receipts—which are bellwethers of current economic activity—were up during September, providing additional evidence that California's economic expansion remains on track.
Contact—Brad Williams, Economics and Revenue Forecasting Section —(916) 324-4942
The LAO is a nonpartisan office which provides fiscal and policy information and advice to the legislature. The LAO is located at 925 L Street, Suite 1000, Sacramento, CA 95814.To request publications call (916) 445-2375. Reports are also available on the LAO's World Wide Web page at http://www.lao.ca.gov. |