
| |
California's Fiscal Outlook |
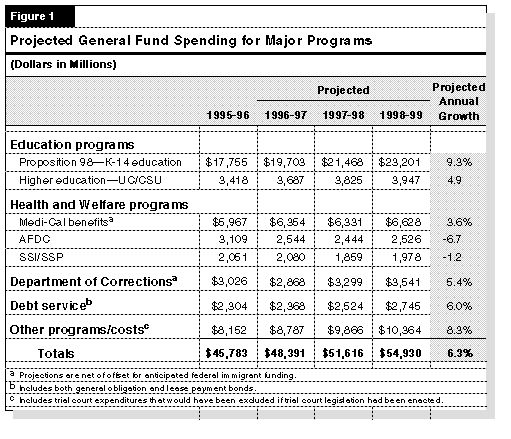
In this chapter, we present and discuss our General Fund expenditure projections for 1996-97 through 1998-99, both in the aggregate and by program area.
In addition to Proposition 98 spending, other areas of above-average growth include:
We next discuss in greater detail our projections for spending in major program areas.
We estimate that this legislation will result in a net reduction of over $6 billion in federal funds for California over the first six years of implementation. The potential impact on state General Fund spending depends on a number of factors, including:
The federal welfare reform act could lead to significant policy changes at the state level, but the state has yet to implement such changes. Our projections assume only those state costs or savings resulting from federal welfare reform that are consistent with current state law. The following summarizes our budget assumptions related to welfare reform.
TANF. Under the TANF, federal funds are provided as a block grant rather than as matching funds. Pursuant to the block grant, the state will receive approximately $267 million in additional federal funds during 1996-97. The administration has indicated its intention to propose spending $60 million of these funds to expand the GAIN program.
SSI/SSP. Federal welfare reform makes legal noncitizens (with exceptions for refugees, persons who have worked for ten years, and veterans) and relatively less-disabled children ineligible for SSI/SSP. We estimate that about 207,000 noncitizens will not meet any of the various exceptions and will be subject to benefit termination by September 1997.
In estimating the state savings that will result from these provisions, it is necessary to make an assumption regarding the number of noncitizens who will attain citizenship. Although there are no historical data on which to base such an estimate, we note that (1) more than 90 percent of immigrants receiving SSI benefits in California have been in the U.S. for five years or more, generally making them eligible to apply for citizenship immediately, and (2) county General Assistance grants are significantly less than SSI/SSP benefits, thereby creating a substantial financial incentive for immigrants to become naturalized citizens.
Considering these factors, and the processing time for citizenship, we assume 25 percent of the immigrants on SSI/SSP will naturalize prior to September 1997 and an additional 45 percent will do so over the following 18 months. Based on these assumptions, we estimate that the federal restrictions on noncitizens receiving SSI/SSP will result in state SSP savings of $243 million in 1997-98, and $179 million in 1998-99.
The Spending Forecast. General Fund spending in 1996-97 for the TANF program (including the Greater Avenues for Independence [GAIN] program and the Emergency Assistance program) is estimated to be $2.5 billion--a reduction of 18 percent from the prior year. This is due to (1) an increase in federal funds pursuant to the block grant, thereby reducing state costs, (2) a declining caseload, and (3) grant reductions. General Fund spending is projected to decrease by an additional 3.9 percent in 1997-98 and then increase by 3.4 percent in 1998-99. In comparison, expenditures increased by slightly more than 2 percent annually in both 1993-94 and 1994-95.
Key Forecast Factors. For 1996-97, we estimate that state spending for the TANF program will be $353 million below the budget act appropriation. This net reduction consists of increased savings from (1) additional federal funds under the block grant and (2) caseload declines. These savings are partially offset by increased costs associated with delays in implementation of grant reductions due to the timing of federal welfare reform.
For 1997-98, we project that spending will decrease by $100 million. This net reduction consists of increased costs that are more than offset by savings. The increased costs are due to (1) termination of the statewide 4.9 percent grant reduction in November 1997 ($42 million), and (2) resumption of the statutory cost-of-living adjustment (COLA) in November 1997 ($75 million). These costs are offset by (1) the full year effect of regional grant reductions (-$57 million), (2) a projected decline in caseloads (-$39 million), (3) an anticipated increase in federal funds (-$53 million), and (4) the effects of other policy changes (-$64 million). In 1998-99, we project that spending will increase by $82 million because the costs associated with the statutory COLA and modest projected caseload increases exceed the savings from certain provisions in current law (including the Maximum Family Grant and the Statewide Fingerprint Identification System). These spending projections assume that California will avoid any federal penalties under the welfare reform act.
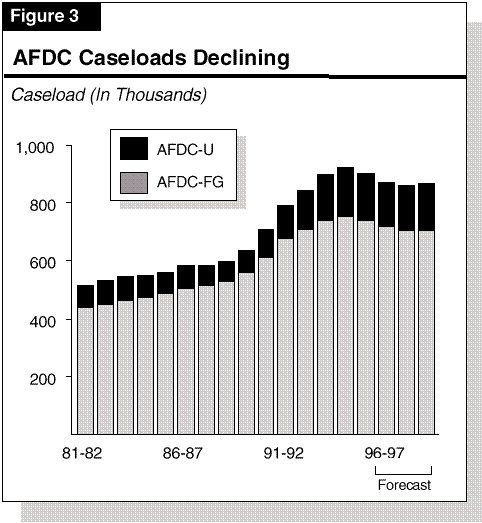
Caseload Trends and Projections. Following a period of rapid increase in the early 1990s,caseload growth in the AFDC program moderated to 2.5 percent in 1994-95 and declined by 2 percent in 1995-96. The downturn in welfare caseloads is due to several factors including lower birthrates for young women, an improving economy with lower unemployment, and a decline in legal immigration to California. Based on a trend analysis of caseloads, birth rates, and unemployment rates, we project that the total TANF caseload will decline by 3.4 percent in 1996-97 and 1.3 percent in 1997-98. Caseloads are then projected to grow by less than 1 percent in 1998-99. Figure 3 shows the caseload trend.
The Spending Forecast. We estimate that General Fund expenditures in the AFDC-FC program will increase from $310 million in 1996-97 to $334 million in 1997-98 and $360 million in 1998-99. This represents about an 8 percent increase each year.
Key Forecast Factors. The projected increases are due to: (1) caseload growth (3.8 percent annually), (2) statutory cost-of-living adjustments for group homes, and (3) placement in group homes of a higher proportion of children requiring a higher level of service, pursuant to current law.
The Spending Forecast. General Fund spending for the SSP is projected to be $2.1 billion in 1996-97. This is an increase of 1.4 percent from the prior year, primarily due to caseload growth. General Fund spending for the program is estimated to decrease by 11 percent in 1997-98 and then increase by 6.4 percent in 1998-99. In comparison, spending in recent years has experienced declines ranging from 1 percent to 12 percent annually.
Key Forecast Factors. For 1996-97, we estimate that SSP spending will exceed the budget act appropriation by $263 million, due primarily to the lack of federal legislation permitting California to implement previously enacted grant reductions. We project that spending will drop by $221 million in 1997-98 due primarily to provisions in the federal welfare legislation which make many noncitizens (-$243 million) and certain disabled children (-$15 million) ineligible for SSI/SSP. These savings are partially offset by costs totaling $36 million for a caseload increase and restoration of the statutory COLA. Our projections call for spending to increase by $119 million in 1998-99 primarily because (1) we assume that an increasing number of noncitizens will attain citizenship ($64 million), (2) the statutory COLA is restored for a full year ($29 million) pursuant to current law, and (3) underlying caseload will grow ($30 million).
Caseload Trends and Projections. Figure 4 shows historical and projected changes in the components of the SSI/SSP caseload.
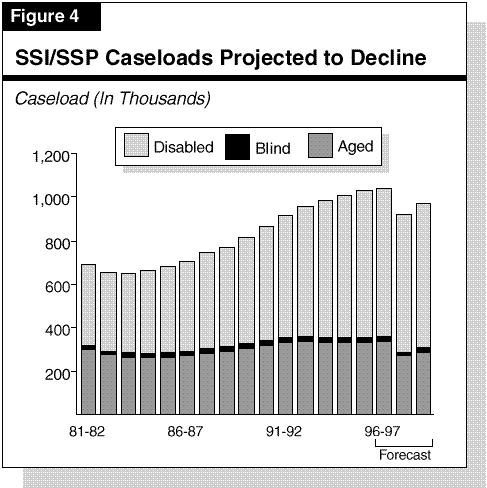
From 1980-81 through 1995-96, the state's SSI/SSP caseload grew by 320,000 cases, or 45 percent over the 15-year period. Most of the growth was in the disabled category, increasing by 298,000 cases. More recently, the growth in the disabled SSI/SSP cases has been moderating, declining from a peak of 7.7 percent in 1991-92 to 2.8 percent in 1995-96. The high rate of growth in the number of disabled cases during the early 1990s can be attributed to factors such as AIDS-related disabilities, federal expansion of eligibility, and outreach programs.
For 1996-97, we project the SSI/SSP caseload will grow by 1.1 percent due to (1) underlying caseload growth of 2.4 percent, (2) lower caseloads because noncitizens arriving after enactment of federal welfare reform are ineligible for SSI/SSP, and (3) lower caseloads because addiction to drugs or alcohol will no longer be considered a disability for purposes of eligibility, pursuant to federal and state law. For 1997-98, we project the caseload will decrease by nearly 12 percent because of the federal provisions making many noncitizens legally residing in the state, and certain disabled children, ineligible for SSI/SSP. For 1998-99, we forecast caseload growth of 5.1 percent due to (1) the underlying caseload growth of 1.6 percent and (2) an increase in the number of noncitizens attaining citizenship.
The Spending Forecast. We estimate that General Fund spending for Medi-Cal benefits (excluding administrative costs) will be $6.4 billion in 1996-97, which is $213 million higher than the estimate when the budget was enacted. The primary reason for the higher spending is that Congress did not appropriate the $216 million of additional federal funds assumed in the budget for Medi-Cal benefits for illegal immigrants. In 1997-98, the forecast indicates that General Fund benefit costs will be essentially unchanged (a drop of $23 million). However, our forecast indicates that the slowdown in spending growth will be temporary; benefit costs resume a higher growth rate in 1998-99, increasing by 4.7 percent ($297 million).
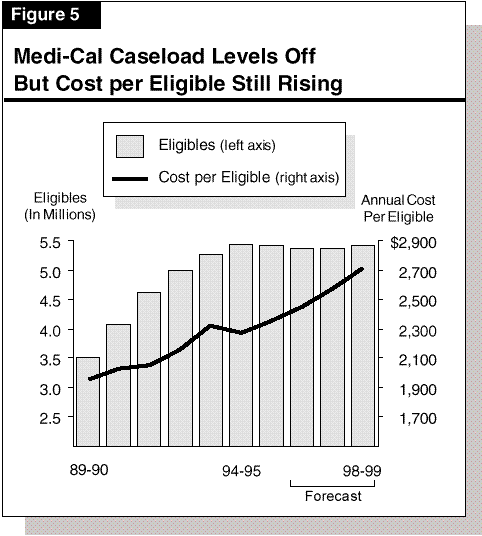
Key Forecast Factors. As shown in Figure 5, the Medi-Cal caseload (persons eligible for services) peaked in 1994-95 and has declined slightly since then. In 1997-98 and 1998-99, the total number of eligibles grows by less than 1 percent annually in our forecast. This recent decline and slow future growth primarily reflect changes occurring in the largest group of Medi-Cal eligibles--AFDC/TANF grant recipients (in line with our forecast reduction in the AFDC/TANF caseload).
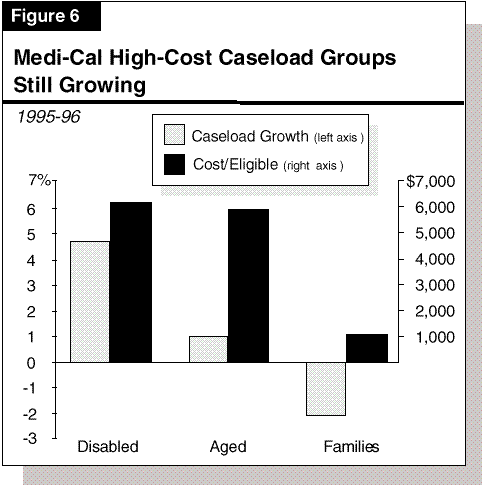
Although the Medi-Cal caseload grows very little over the period, Figure 5 shows that the average cost per eligible continues to grow by more than 5 percent annually, so that the underlying trend is for continued growth in benefit costs. The largest portion of this growth is due to medical cost inflation, which is projected to increase from 2.8 percent to 4.5 percent over the forecast period. Some additional growth in the cost per eligible is due to a gradual shift to a more expensive mix of eligibles. Specifically, while the AFDC caseload has been declining, the number of aged and disabled eligibles has continued to grow. Figure 6 illustrates that eligibles in these growing segments of the caseload have an average annual benefit cost that is about six times higher than for AFDC recipients (and other eligible families with children).
Special Factors Slow 1997-98 Spending Growth. Two special factors account for low spending growth in 1997-98. First, our forecast assumes that Congress appropriates funds for illegal immigrant Medi-Cal costs starting in federal fiscal year (FFY) 1998 (beginning October 1997). Although these funds were not appropriated in the current year, the recent federal budget and immigration legislation does authorize future funding. Second, our forecast assumes an increase in the federal matching percentage for Medi-Cal benefits--from the current 50.2 percent to 51.3 percent in 1997-98, based on a preliminary federal calculation of the cost-sharing formula for California in FFY 1998. (The federal cost share increases as a state's per-capita personal income declines relative to the national average. There is a lag when these adjustments occur.) Absent these two special factors, Medi-Cal benefit costs would grow by an estimated 4.3 percent in 1997-98, instead of the projected reduction of 0.4 percent.
Welfare Reform Assumptions. Under federal welfare reform legislation, existing AFDC recipients continue to be eligible for Medi-Cal regardless of any eligibility changes that might be enacted for the TANF Program. Our estimates reflect this continued eligibility.
Under the federal welfare reform legislation, many noncitizens currently receiving SSI/SSP grants will no longer be eligible for those grants. However, no adjustment was made to the Medi-Cal forecast because these persons will continue to be eligible for Medi-Cal benefits under the state's "medically needy" eligibility category.
The Spending Forecast. General Fund expenditures in the IHSS program are estimated to be $329 million in 1996-97, $400 million in 1997-98, and $455 million in 1998-99. This represents an increase of 22 percent annually in the first two years and 14 percent in 1998-99.
Key Forecast Factors. The increase in expenditures is primarily due to caseload growth (3.4 percent annually) and increases in the minimum wage, pursuant to federal and state law. (Most IHSS providers are paid the minimum wage.)
The Spending Forecast. We estimate that annual growth in total Proposition 98 spending (General Fund and local property taxes) for K-14 education will be in the range of 7 percent in 1997-98 and 1998-99. This is lower than the 9.7 percent increase in 1995-96 and about the same as the projected increase of 7.3 percent for the current year. This forecast reflects the reduction in business taxes approved by the Legislature during the 1996 session and our moderate revenue forecast. Economic and workload factors also alter estimates for 1995-96 and 1996-97. We estimate spending increases of $274 million and $645 million, respectively, above the amounts assumed in the 1996-97 Budget Act.
Key Forecast Factors. General Fund expenditures for Proposition 98 depend on the following factors: General Fund revenues, state population, K-12 average daily attendance (ADA), per capita personal income and local property taxes. Our economic forecast assumes state tax revenues will grow by about 6 percent in 1997-98 and 1998-99. We estimate per capita income growth of 5.4 percent in 1997-98 and 4.9 percent in 1998-99. We also assume that local property tax revenue will recover from its current low rate of growth, reaching a growth rate of about 3 percent in 1997-98, increasing to 4 percent in 1998-99.
The key education factor is growth in K-12 enrollment. We project that student attendance will increase by 2.3 percent in 1997-98 and 2 percent in 1998-99. These are somewhat lower than increases in 1995-96 and 1996-97 and reflect smaller increases in the number of children who will reach the age of five durie next two years.
There is still considerable uncertainty over these growth estimates, however. For instance, the migration of families to and from California is affecting enrollments. In the recession years of 1993-94 and 1994-95, enrollment growth fell below expectations. In 1995-96, as the economy improved, K-12 enrollments exceeded most forecasts. Our enrollment projections for 1997-98 and 1998-99--and our assumptions about migration--reflect modest growth in the California economy. If the economy performs better than we project, K-12 growth rates--and Proposition 98 spending--could be higher than we have forecast.
Higher 1995-96 and 1996-97 Estimates. We estimate higher Proposition 98 funding levels for 1995-96 and 1996-97 than anticipated in the 1996-97 Budget Act, for two reasons. First, higher General Fund revenue estimates for the two years result in formula-driven increases in K-14 Proposition 98 funding of $90 million and $425 million in 1995-96 and 1996-97, respectively (or about 60 percent of the increase in our projected General Fund revenue). Under current law, these new Proposition 98 funds will be allocated to local revenue limits.
Second, as we discussed in our May Budget Brief, the Governor's May Revision understated enrollment growth in 1995-96. The May Revision estimated growth in enrollments of 1.9 percent. Our analysis indicates that the actual increase was about 2.6 percent. The additional 36,000 students increases the Proposition 98 guarantee by approximately $180 million in 1995-96 and $200 million in 1996-97. (Proposition 98 requires adding about $5,000 for each additional K-12 student--all paid from the General Fund.)
As a result of both revenue and ADA increases, Proposition 98 spending growth consumes the entire $891 million increase in General Fund revenues that we project over this two-year period.
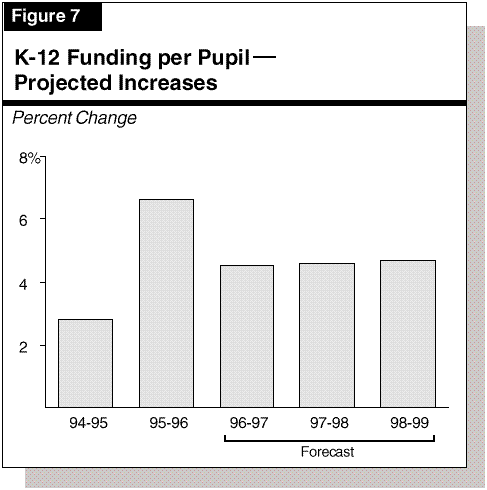
K-12 Funding Projections. Any increase in Proposition 98 is shared between K-12 education and the California Community Colleges. Figure 7 displays our projected K-12 per-pupil increases from 1995-96 through 1998-99. These estimates, which are derived from our Proposition 98 forecast, reflect annual per-pupil increases of about 4 percent to 5 percent for 1997-98 and 1998-99. This funding level would permit continued support for existing programs--including class-size reduction. Once funds are allocated for a COLA as required by current law, however, there would be about $500 million per year available for program increases and new school improvement activities.
Community College Funding Projections. Based on our Proposition 98 projections, we estimate total community college funding will increase by about 7 percent each year in 1997-98 and 1998-99.
The Spending Forecast. We estimate that spending for UC and CSU (excluding funding for debt service) will increase from $3.7 billion in 1996-97 to $3.8 billion in 1997-98, or by 3.7 percent (the percentage increases at UC and CSU are similar). For 1998-99, we estimate that spending for UC and CSU (excluding funding for debt service) will increase to over $3.9 billion or by 3.2 percent compared to 1997-98.
Key Cost Factors. Two main factors account for state expenditure growth in higher education: salary increases and enrollment growth. Our assumptions for these are as follows:
Fee Revenue Forecast. For each year of our estimates above, we assumed that both systems would increase student fees and nonresident tuition by the projected rate of inflation (approximately 2.8 percent per year). This would increase revenue to the systems by $17 million in 1997-98 and by $35 million in 1998-99 above current levels. If UC and CSU increase their fees by 10 percent for 1997-98, then General Fund expenditures could be $46 million less than shown above for 1997-98. If the systems increase fees by another 10 percent in 1998-99 as well, then General Fund expenditures could be $97 million less than shown above for 1998-99. If, on the other hand, UC and CSU do not increase their student fees in either 1997-98 or 1998-99, then General Fund expenditures would be $17 million greater than shown above for 1997-98 and $35 million greater for 1998-99.
The Spending Forecast. The department's General Fund support budget is forecast to grow between 1995-96 and 1998-99 at an average annual increase of 7 percent, exceeding $3.7 billion annually at the end of that period. These costs will be partially offset by funds provided by the federal government to reimburse the state for the costs of housing undocumented immigrants convicted of felonies in California. After adjusting for receipt of these federal funds, the General Fund growth is projected to be 5.4 percent.
These federal funds are expected to steadily decrease, from $429 million in 1996-97 to $209 million in 1998-99. There are two primary reasons for this decrease. First, the anticipated reimbursements for 1996-97 are artificially high because California will receive the bulk of two federal fiscal-year appropriations in a single state fiscal year. Second, recent changes in federal law permit local governments throughout the nation to claim reimbursement for costs of housing undocumented felons in local jails, thereby spreading federal appropriations to more agencies.
The projected growth in adult correctional expenditures continues a trend of steadily larger CDC budgets that has existed since the early 1980s.
Key Forecast Factors. The increases projected in General Fund support for the CDC reflect anticipated major growth in the state's prison inmate population. The CDC expects that the prison population will exceed 170,000 inmates by June 1999. This is not as great an increase as previously forecast by the CDC. (See insert box for an explanation for this slower than anticipated growth.) Nonetheless, even with the lower projections, the CDC inmate population is expected to increase by more than 39,000 inmates, or 30 percent, over the four-year period ending June 30, 1999.
The state's prison inmate population will continue to grow steadily, but now appears unlikely to increase as quickly as earlier projections from the California Department of Corrections (CDC) had indicated.
Department Projections Revised. This spring, the CDC had projected that the prison population would grow 43 percent over four years, reaching 188,000 inmates by June 30, 1999. New CDC projections released this fall indicate that the population will instead grow 30 percent to 170,000 inmates.
The CDC has also revised its long-term growth projections, and now predicts that the number of inmates will reach 238,000 inmates by June 30, 2005. That is 48,000 fewer inmates than the CDC had previously been projecting for that date.
Why Have the Numbers Changed? According to the CDC, two main reasons explain the new lower projections.
First, fewer newly convicted felons are being sent to the state prison system by the courts than had been predicted earlier. While the number of parolees sent to state prison for parole violations has generally been in line with projections, commitments to prison of persons with new felony offenses are running below expectations. The CDC has not determined the reason for the falloff in new admissions. Criminal justice experts have theorized that the reasons could be related to such factors as tougher sentencing laws that have resulted in a larger number of offenders being incarcerated by the state who are thereby prevented from committing new crimes, demographic shifts that have slowed growth in the population of adult offenders, improved economic conditions, and increased use of law enforcement tactics that prevent crime.
Second, some offenders sent to prison under the 1994 "Three Strikes and You're Out" law enacted by the Legislature and the voters are receiving shorter prison terms than anticipated. The CDC had previously assumed that offenders who were sentenced under the Three Strikes law, and who had only one violent or serious crime on their record (often referred to as "second-strikers"), would have to serve an average sentence of eight years in state prison. Based on sentence data it has collected, the CDC now estimates that each second-striker will get a prison term of about six years because of the way judges are exercising their discretion in sentencing decisions.
The increase in prison population is largely the result of tougher sentencing measures approved by the Legislature, Governor, and the voters, including the "Three Strikes and You're Out" law enacted in 1994. Demographic shifts, local government support for law enforcement activities, and other factors are also contributing to the increase in prison population.
Meanwhile, the number of parolees under the supervision of CDC parole agents is also expected to grow reflecting the overall growth in the state's population of criminal offenders. The CDC estimates that the parole population will grow to almost 115,000 parolees, an increase of 26 percent, over the four-year period ending June 30, 1999.
The Spending Forecast. Total expenditures from all funds (state and local) for the trial courts is forecast to grow from $1.7 billion in 1995-96 to $1.8 billion in 1998-99, an increase of about 6 percent. Currently, the state funds approximately 38 percent of the trial court costs. Assuming continuation of this funding share, the state's General Fund costs are estimated to be about $604 million in 1998-99, up slightly from 1995-96 expenditures.
Key Forecast Factors. The projected growth is due primarily to anticipated caseload increases in the trial courts, the additional costs of supporting 21 new judgeships authorized in 1996, and increases in the costs of supporting the Judges' Retirement System. The caseload increases are expected to be most significant in the area of criminal cases resulting from enhanced sentencing measures, such as the Three Strikes and You're Out law.
Debt service is the largest single program in the "other" category. As shown in Figure 8 (see next page), we expect total General Fund debt service costs (on both general obligation bonds and lease-payment bonds) to reach $2.8 billion in 1998-99. This forecast assumes that about $7.5 billion in currently authorized bonds will be sold by the end of 1997-98. We forecast that debt service costs will increase from 4.9 percent of General Fund revenues in 1996-97 to 5.2 percent in 1998-99.
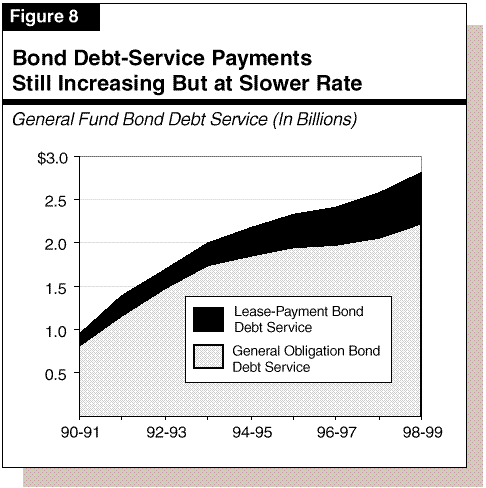
Figure 8 also shows that total debt service is increasing at a slower rate than earlier in the decade. From 1990-91 through 1994-95, debt service costs increased by 130 percent. From 1994-95 through 1998-99, the increase will be about 30 percent. This much slower growth rate is due primarily to a decline in recent years in the level of new bonds issued by the state. The figure also shows that debt payments for lease-payment bonds is an increasing share of total debt service costs.
The renters' credit has been suspended for four years, from 1993 through 1996. The program is scheduled to be reinstated January 1, 1997 and will result in an estimated cost of $525 million in 1997-98 and $530 million in 1998-99.