Economic and demographic trends are primary determinants of the state's fiscal condition, including revenues and expenditures. This chapter presents our economic and demographic projections.
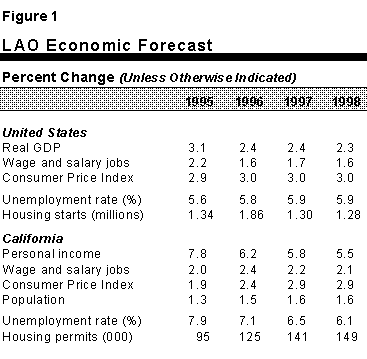
Our economic forecast calls for continued moderate growth both nationally and for California. Figure 1 summarizes the forecast.
Key Features of U.S. Outlook. Real Gross Domestic Product (GDP) growth is projected to average 2.4 percent over the next three years. Business investment and exports are projected to be the fastest growing sectors. Consumer spending would grow in line with the economy while government would grow slightly slower than the economy. The forecast assumes that a federal budget compromise will yield expenditure cuts sufficient to modestly reduce future federal deficits.
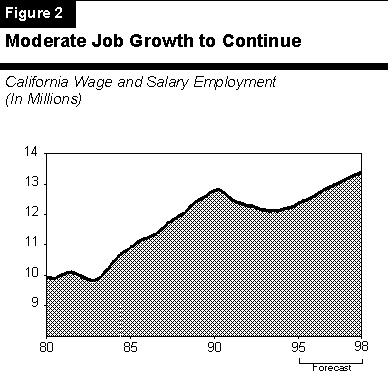
Continued Growth Expected. Our forecast assumes that current state economic trends will continue during the next three years. Growth is forecast to average 5.8 percent for personal income and 2.2 percent for wage and salary employment. Figure 2 shows that employment is forecast to grow steadily, recouping the 725,000 jobs lost in the recession by the end of 1996. Although the projected rate of job growth is only about two- thirds that of the 1980s, this would be a sharp contrast to the job losses that occurred in the first half of the decade.
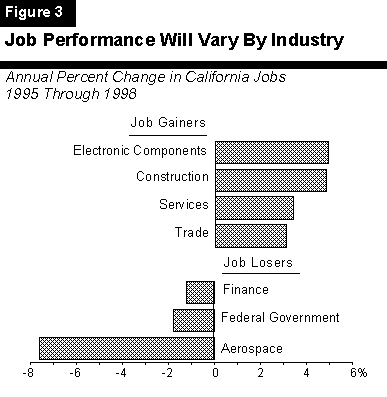
Uneven Job Growth by Sector. Underlying the overall moderate employment growth forecast is significant variation among industry sectors. As Figure 3 shows, the fastest growing sectors will be services, construction, trade and electronics-related manufacturing. In contrast, job losses are projected for financial services, the federal government sector, and aerospace-related manufacturing. The projected job losses in aerospace, although still large, are only about one-half of those of the past three years. Thus, the economic drag due to aerospace cutbacks will be less than previously experienced.
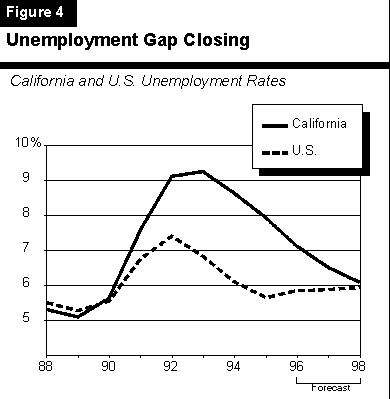
Unemployment Gap to Close. A significant feature of our forecast is that California will grow faster than the nation during the 1996 through 1998 period, reversing the trend that has persisted since 1990. This reversal is partly because California began recovering from the recession nearly two years after the nation. Thus, the state currently is in an earlier stage of its economic cycle. In addition, California has many businesses in the faster-growing sectors, such as electronics, selected services, and export- related industries. Figure 4 shows that, due to these factors, the state's unemployment rate, which currently is nearly 2 percentage points above the nation's, is expected to approximate the nation's by year-end 1998.
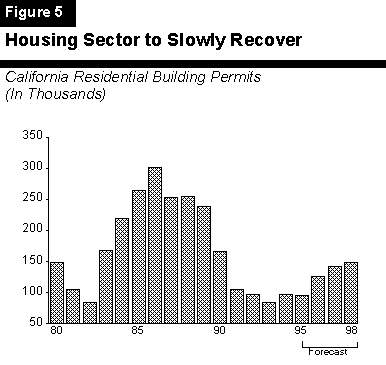
Housing to Improve Modestly. Home construction has failed to rebound as strongly as expected during the past year. However, recent data regarding home prices and construction provide some positive signs. As Figure 5 shows, we forecast that home construction will improve during the next three years. This reflects such factors as growing incomes, comparatively low interest rates, and stabilization in home prices. Despite our projected increases, however, permits will still be well below the levels reached in the 1980s.
California's population is projected to grow at an average annual rate of 1.6 percent during the next three years, to 34.1 million by 1998. While the projected growth is slightly more than the 1.3 percent average growth experienced from 1992 through 1995, it still is considerably below the average 2.5 percent gain that took place between 1987 and 1992. One of the main factors responsible for the population changes we are projecting involves net migration.
Net Migration to Trend Upward. Figure 6 shows that net migration rose sharply in the late 1980s, peaking at 465,000 in 1990. This reflected substantial increases in people moving to California from both other states and nations. In the early 1990s, however, the state's severe recession led to both net out-migration to other states and a marked slowdown in in-migration from other countries. Net migration fell to just 33,000 in 1994.
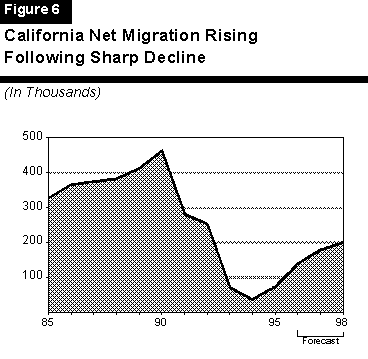
Although we do not anticipate a return to the high net migration levels of the late 1980s, the improved economy should cause a modest rebound during the next few years and help to produce a slight pick-up in overall population growth.
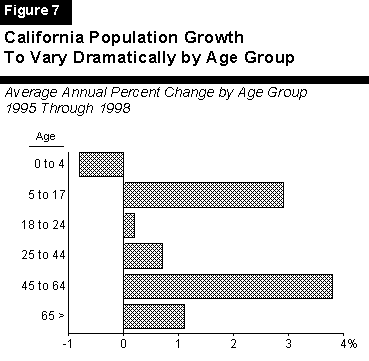
Growth by Age Group to Vary Significantly. Figure 7 shows our population projections by age group. It shows relatively rapid growth for the 5-to-17 age range (reflecting the rise in birth rates in the late 1980s), slow growth in the 18-to-24 age group, significant increases in the 45-to-64 age group (reflecting aging baby-boomers), and modest gains for the 65-and-older group. These various age-group outlooks have significant implications for state expenditures in many individual program areas, including education, health, and welfare.