What Are the Trends in Juvenile Crime in California?
When discussing trends in crime, it is important to consider both the state's long-term and short-term directions of crime. Over time, changes in economic conditions, social conditions and values, lifestyles, residential patterns, and especially demographics can have significant impacts on crime trends. In several charts that follow, we show the trends in juvenile crime for California, as measured by juvenile arrests. In general, the data show that:
- Juvenile arrest rates peaked in 1974, decreased through 1987, and have increased since then.
- Juvenile arrest rates for violent crime have exceeded those for adults since 1980, except for three years (1986, 1987, and 1988).
- Juvenile arrest rates for homicides were below those for adults until 1989. Since then, the juvenile homicide rate has significantly exceeded the adult rate.
Historically, increases in the size of the juvenile population have been a strong predictor of increases in overall crime. Accordingly, we present projections of future changes in California's juvenile population and estimate the potential effect these changes may have on future juvenile crime in California.
Juvenile Arrest Rate Peaked in 1974a
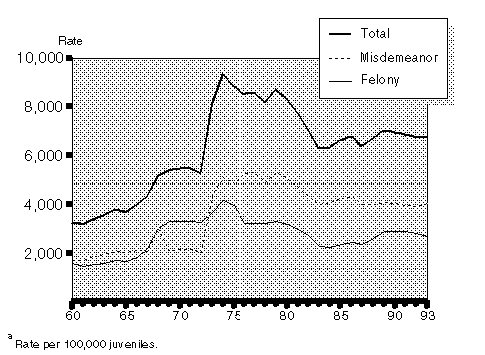
- Since 1960, juvenile arrest rate increased about 205 percent. During the same period, the state's juvenile population increased about 162 percent, thereby suggesting that a significant amount of the increase in the juvenile arrest rate can be accounted for by the increase in this age population.
- Total juvenile arrest rates peaked in 1974, when there were 9,313 arrests for every 100,000 juveniles--4,173 felony arrests and 5,140 misdemeanor arrests. The juvenile population (age 11 to 17), as a proportion of California's total population, also peaked in 1974, when this group was over 13 percent of total population.
- The juvenile arrest rates declined between 1974 and 1987. Since 1987, the juvenile arrest rate has increased 6 percent.
Juvenile Violent Crime Arrest Rates Exceed Those for Adultsa
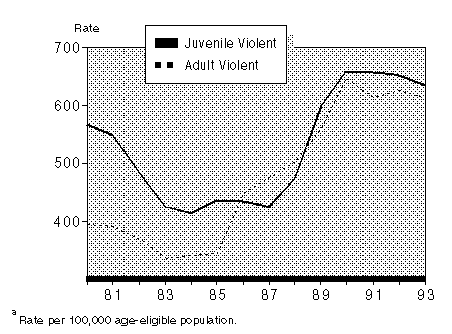
- The juvenile arrest rate for violent crimes has exceeded that for adults since 1980, except for three years (1986, 1987, and 1988).
- The gap between the violent crime arrest rates for juveniles and adults was much wider in the 1980s and has since narrowed in the 1990s, with the adult rate coming closer to the juvenile rate.
- The juvenile violent arrest rate (combined rate for homicide, rape, robbery, assault, and kidnapping) hit a low in 1984; since then, it has increased 53 percent through 1993.
- Juvenile violent arrest rates increased in part because of the growth of the juvenile population. Research also indicates that violent arrest rates might be increasing because of gang activity and the availability of firearms.
Homicide Arrest Rates for Juveniles
Exceed Those for Adults Since 1989a
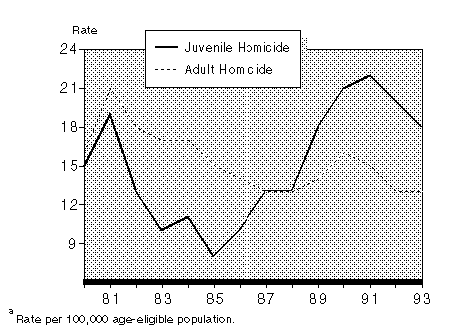
- For most of the 1980s, adult homicide arrest rates exceeded those of juveniles. However since 1989, juvenile homicide rates have exceeded those for adults.
- Juvenile arrests for homicide hit a low in 1985, increasing 125 percent through 1993.
Youth and Young Adults Account For Most Homicide Arrests
1993
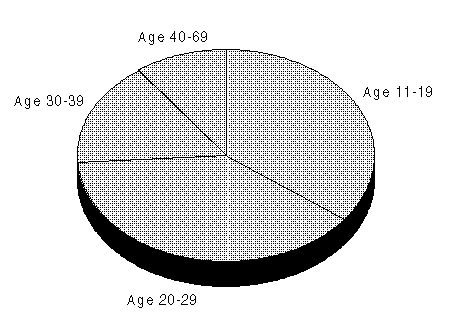
- Youth and young adults (through age 29) account for almost three-fourths of those arrested for homicide.
- Almost 20 percent of those arrested for homicide are 11 to 17 years old, and an additional 16 percent are either 18 or 19 years old when they were arrested for homicide.
- Just over 5 percent of juveniles arrested for homicide are female.
- All homicide arrests account for 2.2 percent of violent crime arrests.
California's Juvenile Population Likely to Increase Through 2004
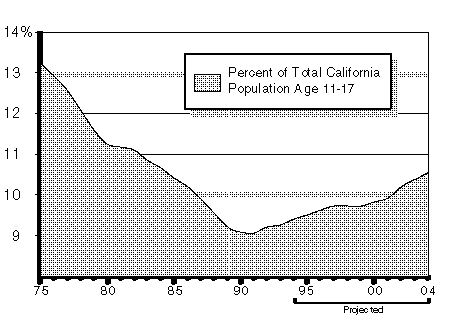
- California's juvenile population is projected to grow over 20 percent in the next decade (through 2004).
- The number of juveniles age 11 through 17--the ages of juveniles responsible for 99 percent of juvenile arrests--will increase 33 percent in the next decade.
- In each year between 1994 and 2004, it is estimated that there will be 2 to 3 percent more juveniles in the age-group most likely to commit crime. In contrast, in the last five years, this age-group experienced an average increase of 1 percent a year.
Estimated Number of Juvenile Felony Arrests Through 2004
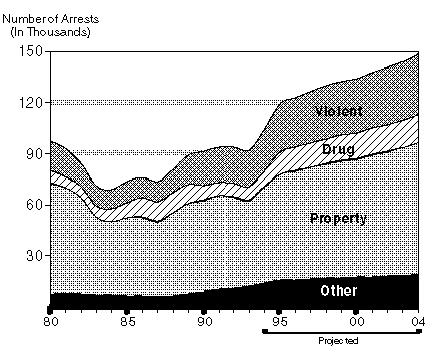
- Based on the juvenile arrest rates for the past five years and using population projections for juveniles for the next ten years, we estimated the likely growth in juvenile arrest rates through 2004.
- We estimate that the number of juvenile arrests will increase over 29 percent over the next ten years, even if arrest
rates stay the same. This assumes that the population of 11 through 17 year olds grows from 2.9 million in 1993 to 3.9 million in 2004.
- The number of arrests for violent crime are estimated to increase over 28 percent through 2004, from 21,590 juvenile arrests in 1993 to over 35,000 juvenile violent arrests by 2004.
- Our estimate projects the number of arrests there will be over time. If the arrest rate increases in the future, as it has over the past five years, there would be even more arrests.
How Does Juvenile Crime Vary Among States and Within California?
Although there is value in comparing juvenile crime data among different jurisdictions, one should be cautious with such comparisons because numerous factors can influence crime data. For example, among the states, the definition of juvenile crime versus adult crime can vary significantly, as well as the definition of who is a juvenile. In addition, different economic and social conditions can affect crime. In general, we believe that only large industrial states with diverse populations and economies should be compared. These states are more likely to have juvenile populations that resemble California's juvenile population.
Among California counties there are other factors that affect juvenile arrest rates, such as the availability of law enforcement resources, diversion programs, or other intervention services. Comparison of counties should be limited to comparing similar counties--for example, comparing counties whose total population exceeds 500,000. These counties are more likely to have similar juvenile populations.
The most complete information comparing state crime rates is from the Federal Bureau of Investigation. The most complete information comparing crime among California jurisdictions is from the California Department of Justice (DOJ) and is available on a county-by-county basis.
California's Juvenile Arrest Rate
Is Higher Than the National Averagea
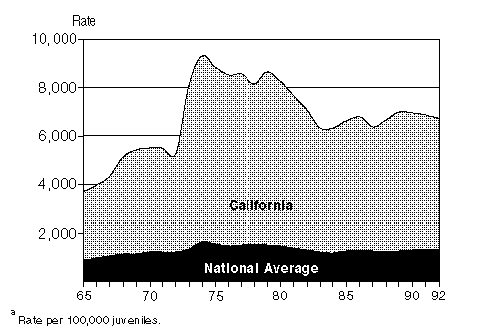
- Historically, California's juvenile arrest rates have been significantly higher than the national average.
- National trends are similar to California trends, but they are much less pronounced.
- In 1992, California's juvenile arrest rate was five times the national average. There are several reasons for this difference, including how different states count juvenile crime. For example, in some states, juveniles age 16 or older who are arrested for felonies are counted with adult arrests; in California, these youth would be counted as juvenile arrests. In addition, California's arrest rates include all felony and misdemeanor arrests, while some states may not include all juvenile misdemeanor arrests. Consequently, we believe national statistics are likely to be understated relative to California data.
California's Juvenile Felony Arrest Rate
Exceeds That for Most Larger Statesa
1992
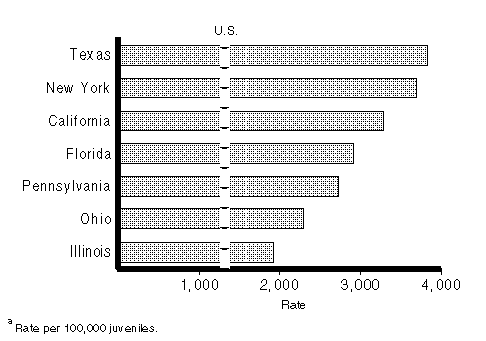
- California's juvenile felony arrest rate is 17 percent lower than that for Texas and 12 percent lower than for New York, but higher than other large states.
- New York leads the other states for violent arrest rates, with California third after Florida. New York's violent crime arrest rate for juveniles is 50 percent higher than that for California.
Juvenile Felony Arrest Rates Vary Among California's Countiesa
1993 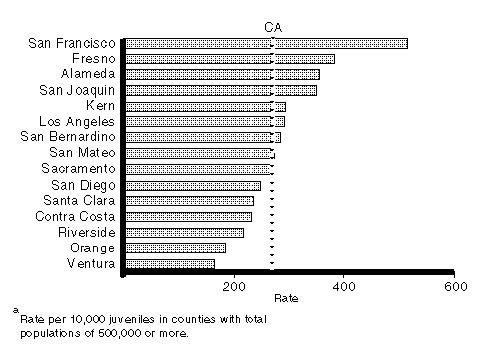
- San Francisco's juvenile arrest rate is over 50 percent higher than the statewide average. However, San Francisco is the most urbanized county and generally, urbanized areas have higher levels of crime than suburban and rural areas.
- Riverside County has seen the greatest increase in arrest rates, growing 56 percent from 1984 through 1993. During the same period, the county's juvenile population grew almost 74 percent.
- Ventura County saw its arrest rate decline 5 percent since 1984, even though its juvenile population remained virtually the same. One reason for the decline could be Ventura County's emphasis on integrated prevention and intervention services for juveniles.
Return Juvenile Crime Table of Contents
Visit the 2007 Publication, California’s Criminal Justice
System: A Primer
Return to LAO Home Page