 Legislative Analyst's Office
This section provides a basic overview of the expenditures which are paid for by state taxes and other revenue sources. A general understanding of the overall expenditure base and its trends provides a useful perspective for the more detailed information on individual program areas which follows in the remaining chapters.
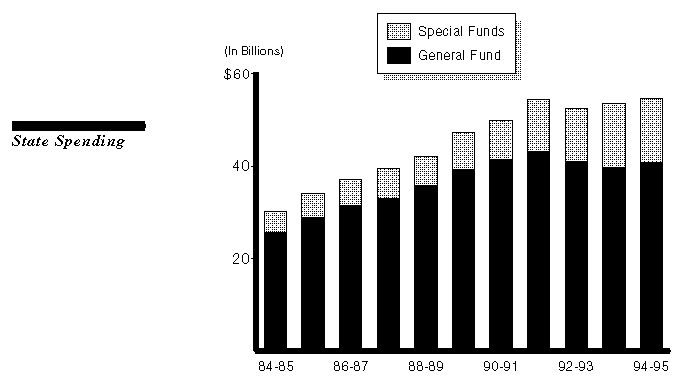
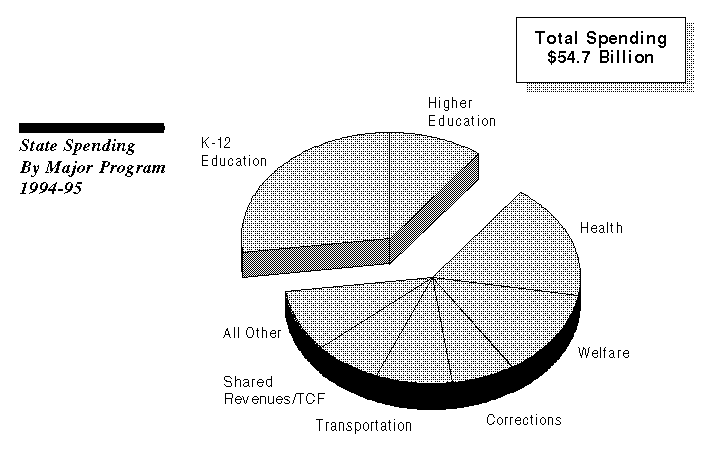
The 1994-95 budget provides for total state spending of $54.7 billion. Of this, $40.9 billion (75 percent) is General Fund spending and $13.8 billion (25 percent) is spending from special funds.
Total spending grew at an annual rate of 8.7 percent from 1984-85 to 1991-92. Since 1991-92, however, the fiscal constraints imposed by the state's recession have kept total spending essentially flat. After adjusting for inflation, total spending in constant dollars has fallen by 6 percent since 1991-92.
The spending figures shown include off-budget Proposition 98 loans to schools in 1992-93 and 1993-94.
Since 1987-88, special fund spending generally has grown more rapidly than General Fund spending. As a result, special fund spending as a percent of total spending has risen significantly.
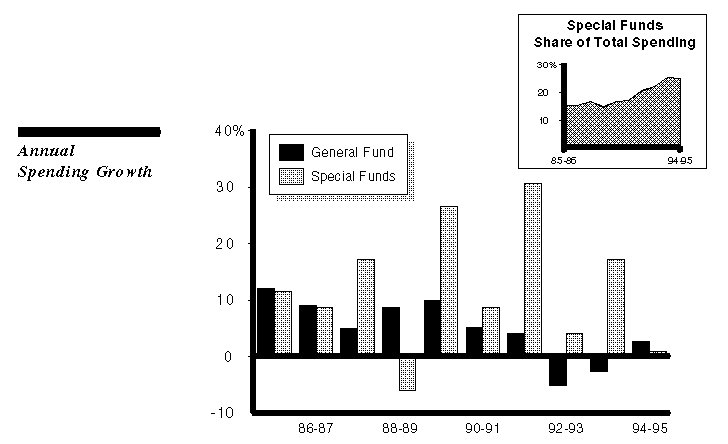
Prior to 1991-92, growth in special fund spending primarily reflected new sources of earmarked funds and the creation of new programs (such as gas and cigarette tax increases, and new fee-based environmental and recycling programs).
Since 1991-92, special fund spending growth largely reflects restructuring within the budget, involving shifts of General Fund costs to local governments along with shifts of state sales tax revenues to new special funds allocated to local governments to offset those costs.
The 1994-95 budget is an exception to recent trends, in that special fund spending growth is less than General Fund spending growth. This reflects: (1) slow growth in ongoing revenues, (2) transfers of some special fund revenues to the General Fund, and (3) no new funding shifts or special fund programs in 1994-95.
Four major program areas--education, health and welfare, corrections, and transportation--account for 83 percent of total state spending.
Special funds provide virtually all spending for transportation programs and most of the revenues shared with local governments, such as Vehicle License Fee revenues.
Growth in spending for individual program areas depends on a variety of factors, including caseloads, inflation, economic developments, and law changes. Over the past ten years, spending growth rates have differed markedly among program areas. The figure shows average annual growth in combined General Fund and special fund spending by major program area since 1983-84.
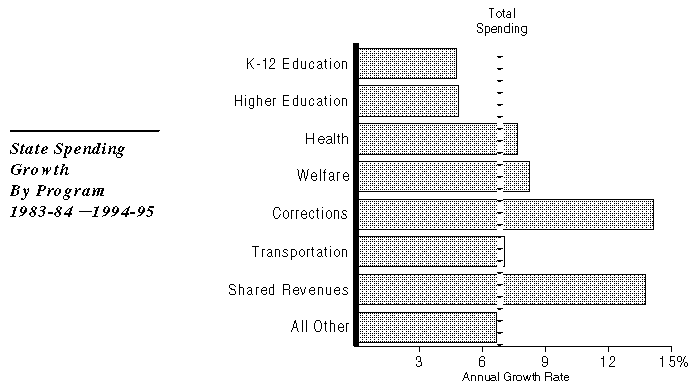
Corrections. This has been the fastest growing program area-- 14 percent annually. Large increases in the prison inmate population have caused rapid increases in staffing costs and in financing costs for new prison construction.
Shared revenues. Growing almost as fast have been shared revenues (general support provided to local governments). This is due to two new funding programs.
Health and welfare. These programs have grown slightly faster than total spending. Welfare grant reductions and cost-containment efforts in the Medi-Cal program have partially offset the costs of continued caseload growth.
K-12 public schools. Expenditures here have grown more slowly than overall spending. However, this below-average spending growth results from a shift in the mix of state and local funds provided to schools. Taking all funding sources into account, support for K-12 schools has grown at an annual rate of seven percent since 1983-84.