 Legislative Analyst's Office
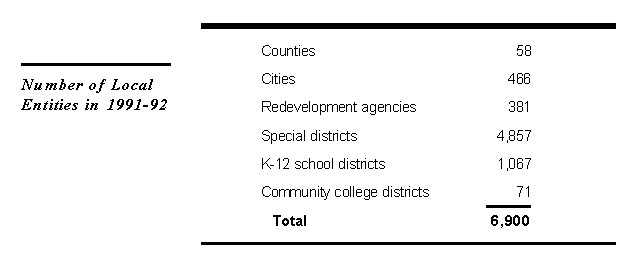
California had nearly 7,000 local entities in 1991-92 (the last year for which data across all entity types are available). There are more special districts than any other type of local entity, many created and controlled by cities and counties to finance or facilitate service delivery.

Redevelopment agencies are the fastest growing group of local entities, both in terms of their absolute number and their level of expenditures. They also represent a type of entity that cities and counties use to provide financing for their infrastructure and community development needs.
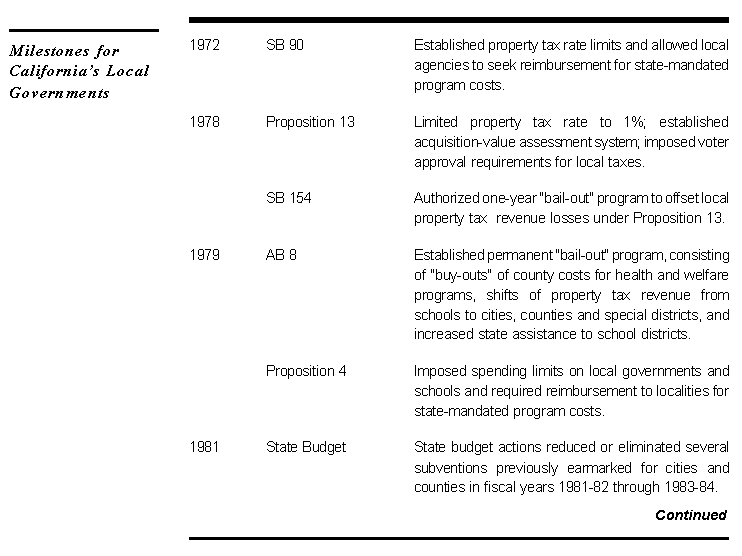
The relationship between the state and local governments is a dynamic one which has been modified and refined many times in recent years. Many of these modifications apply to all local governments while others, like the program realignment adopted in 1991, focus on the state/county relationship.
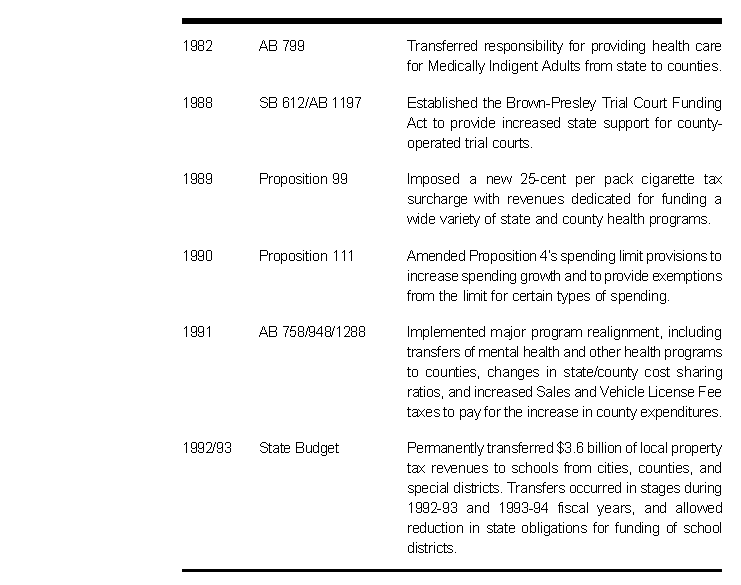
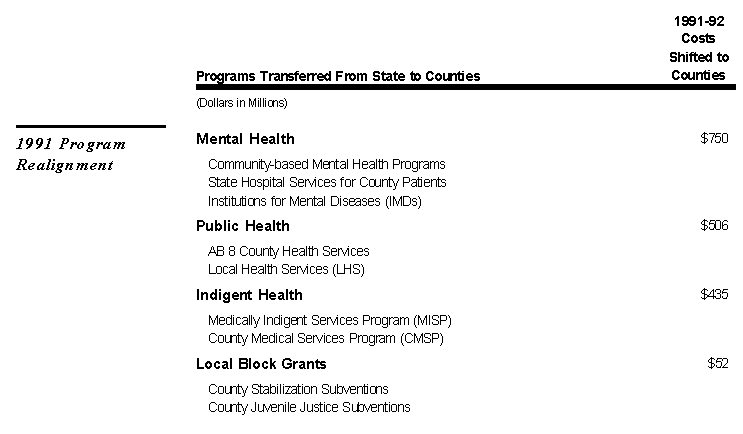
In 1991, the state transferred to counties all responsibility for mental health service delivery, public health programs and indigent care. In addition, a number of state/county sharing ratios for other health and social services programs were changed to give counties a greater stake in program outcomes. To offset these costs, the counties received roughly $2 billion in increased sales tax and vehicle license fee allotments. Revenues from these allotments have fallen short of original estimates in each year since realignment was enacted. The figure on the next page summarizes the 1991 realignment package.

The bulk of county revenues come from state-controlled revenue sources such as state aid and the property tax, while other local entities are largely funded by locally controlled revenue sources. State budget actions in 1992-93 and 1993-94 shifting property tax revenues to school districts hit counties the hardest, although most local entities experienced some reduction. These property tax shifts are largely permanent, and their value will grow over time as the assessed value of property increases within a county.
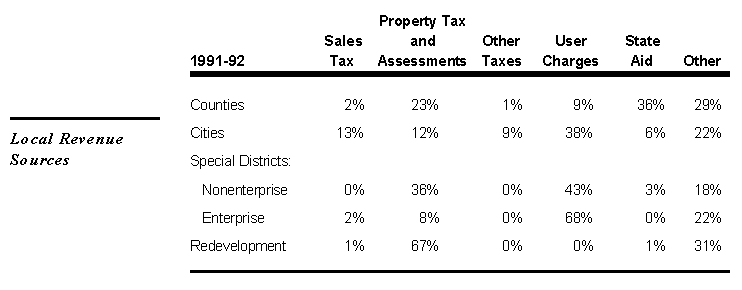
Although redevelopment agencies also receive the majority of their funds from the property tax, the state's ability to affect redevelopment agencies' allocations of property taxes is subject to constitutional limitations.
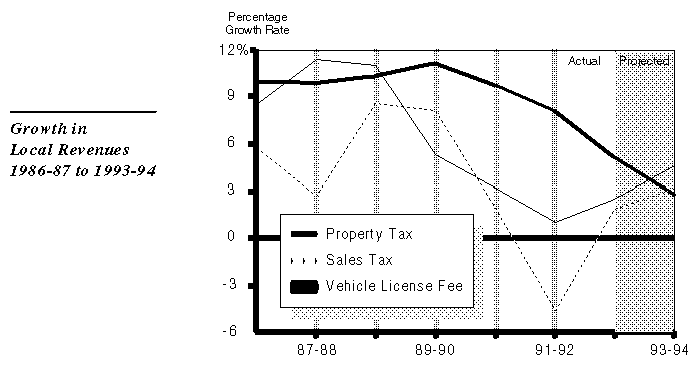
Growth in property tax, sales tax, and vehicle license fee revenues--the "Big Three" of local revenues--was severely affected by the latest recession. In the late 1980s, it was not unusual for these revenue sources to have annual growth rates near or above 10 percent. By 1991-92, the rate of growth in all these revenue sources had declined markedly, and one--sales tax--had actually shrunk in absolute terms from the prior year level. (This drop in sales tax revenue was due in large part to the repeal of the sales tax on snack foods.)
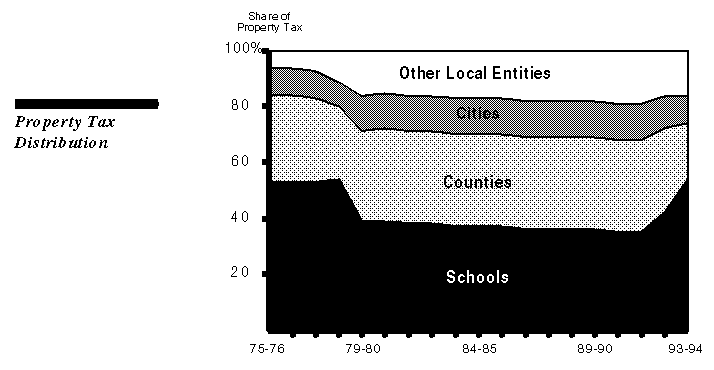
After passage of Proposition 13, the landmark property tax limitation measure enacted by the voters in 1978, the state increased its funding of schools and shifted property tax allocations from schools to other local entities to mitigate their Proposition 13 revenue losses. This local government "bail-out" reduced the schools' share of property taxes from over 50 percent in 1978-79 to roughly 40 percent in 1979- 80.
Legislative action in 1992-93 and 1993-94 shifted $3.9 billion in property taxes from cities, counties, redevelopment agencies, and special districts back to the schools, pushing the schools' share of property tax back above 50 percent.
