 Legislative Analyst's Office
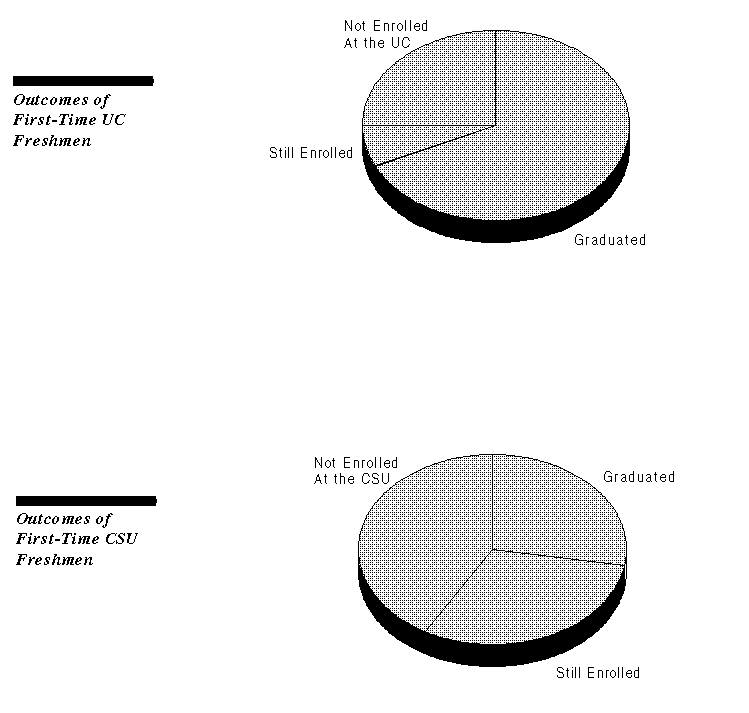
The charts on the following page show the status of first-time freshmen that were admitted under regular requirements five years after entering college. For the UC, the data are for the 1985 freshmen class and for the CSU, the 1983 freshmen class. For both systems, a majority of students had graduated or were still enrolled five years after entering college. According to the systems, the vast majority of the students who were still enrolled are likely to graduate. The students who were not still enrolled include those who transfer outside their respective university systems, or drop out either on a temporary or permanent basis.
At the UC, 68 percent had graduated, 7 percent were still enrolled, and 25 percent were not enrolled at the UC. At CSU, 28 percent had graduated, 31 percent were still enrolled, and 41 percent were not enrolled at the CSU. The CSU data reflect that many students at the CSU attend part-time and may take more than five years to graduate.

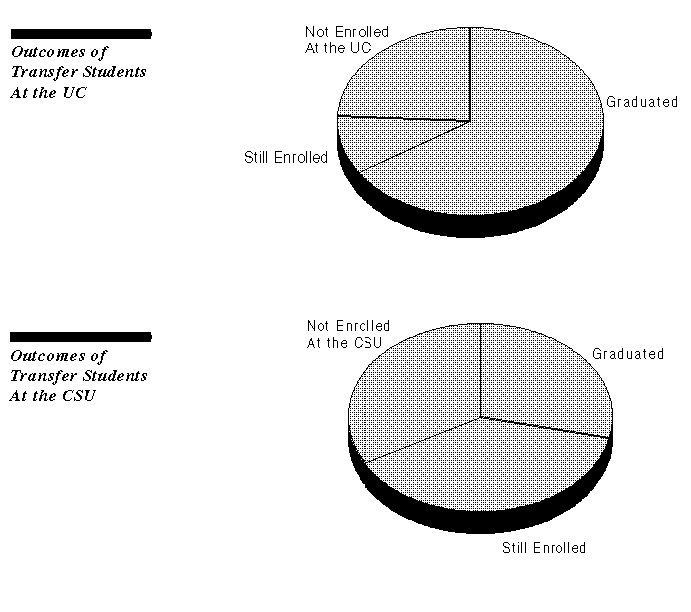
The following charts show the status of students at the UC and the CSU who transferred from a community college, three years after transfer. The data are for students entering the UC and the CSU in fall 1985. Again, the majority had graduated or were still enrolled three years after transferring.
At the UC, 66 percent had graduated, 10 percent were still enrolled, and 24 percent were not enrolled at the UC. At the CSU, 29 percent had graduated, 38 percent were still enrolled, and 33 percent were not enrolled at the CSU.
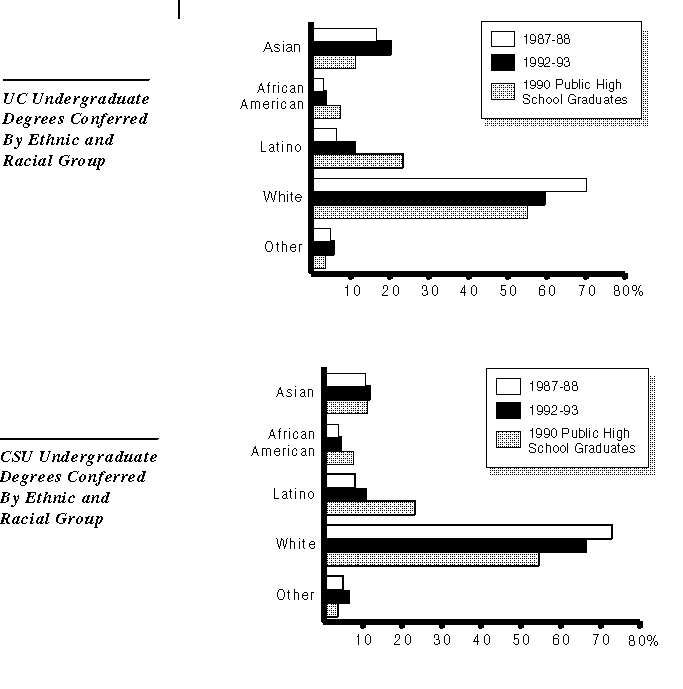
From 1987-88 to 1992-93, the UC and the CSU have experienced increases in the proportions of Latino, Asian, and African-American students graduating with a Bachelor's degree. (The racial and ethnic categories are as reported by the California Postsecondary Education Commission.) These increases generally reflect the increasing diversity of undergraduate enrollments. However, there continue to be disparities between the racial and ethnic diversity of high school graduates compared to UC and CSU graduates.
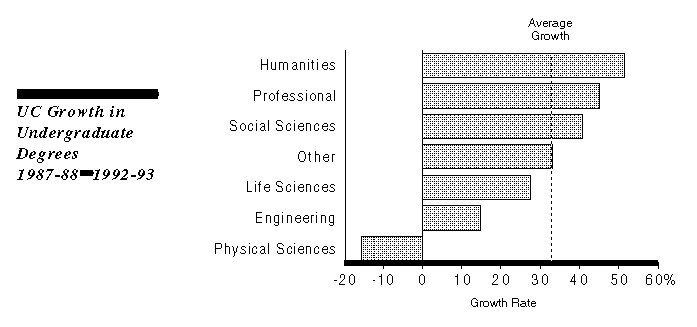
From 1987-88 to 1992-93, the number of undergraduate degrees conferred at the UC increased by 33 percent. The number of humanities, professional, and social science degrees grew faster than average, while the number of life science and engineering degrees grew slower than average. During this time period, the number of physical science degrees declined by 16 percent.
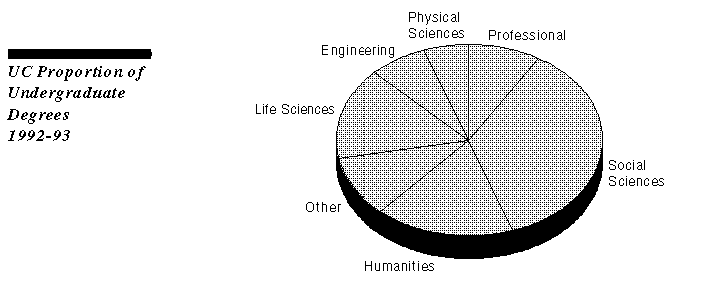
Of the 31,130 undergraduate degrees conferred in 1992-93, 53 percent were in social sciences and humanities and 28 percent were in science and engineering.
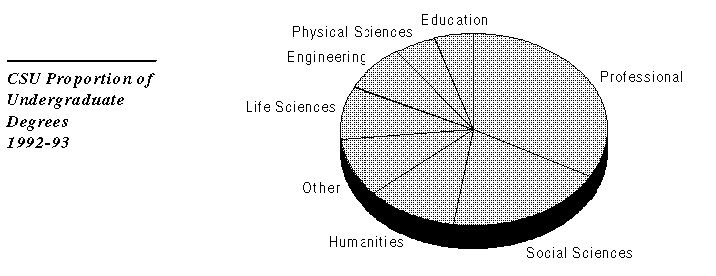
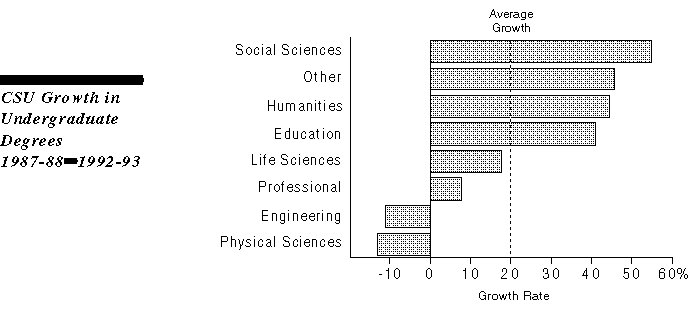
From 1987-88 through 1992-93, the number of undergraduate degrees conferred at the CSU increased by 20 percent. The CSU experienced the same trend as the UC-- the number of social science and humanities degrees grew faster than average, while the number of life science degrees grew slower than average. During this time period, the number of engineering and physical science degrees declined by 11 and 13 percent, respectively.
Of the 55,665 undergraduate degrees conferred in 1992-93, 33 percent were in business and other professional areas, 30 percent were in the social sciences and humanities, and 22 percent were in science and engineering.
