 Legislative Analyst's Office
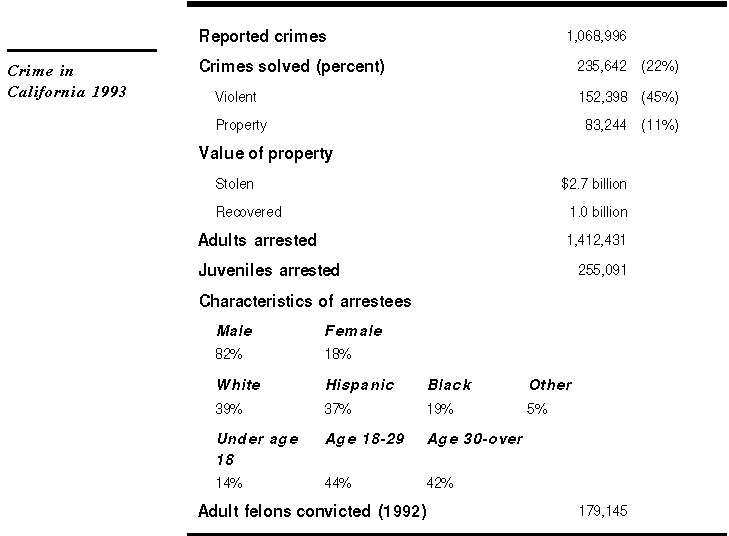
One of the primary duties of the state and local governments is to respond to crime. Polls indicate that ensuring public safety and reducing crime is a top concern of Californians. Much of the response to crime is driven by policy choices made by state and local officials. These choices include defining what is a crime and establishing a punishment, which is most often done by the Legislature and Governor, and deciding how to enforce the law, which is generally determined by local communities. The following table provides some basic information on crime in California.

In recent years, state and local governments have increased resources for crime- fighting faster than almost any other area of government. In addition, the Legislature and Governor have increased criminal sentences, constructed new facilities to incarcerate offenders, and provided law enforcement with new tools to fight crime.
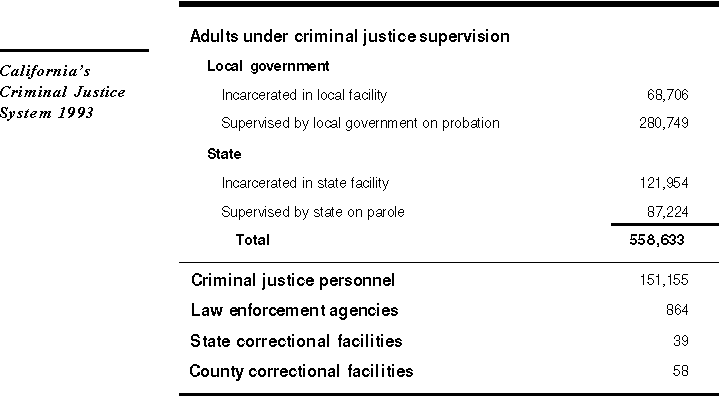
California's criminal justice "system" is a loosely knit network of courts, officials, agencies, and organizations, spanning the three branches of state government, as well as local government. The federal government plays a much smaller role in the criminal justice system than it does in many other programs, such as health and welfare.
In 1992-93 (the latest full year for which data is available), the state and local governments spent about $13.8 billion to respond to crime. This amount was about the same amount that was spent in 1991-92, but represents an increase of more than 50 percent since 1987-88.

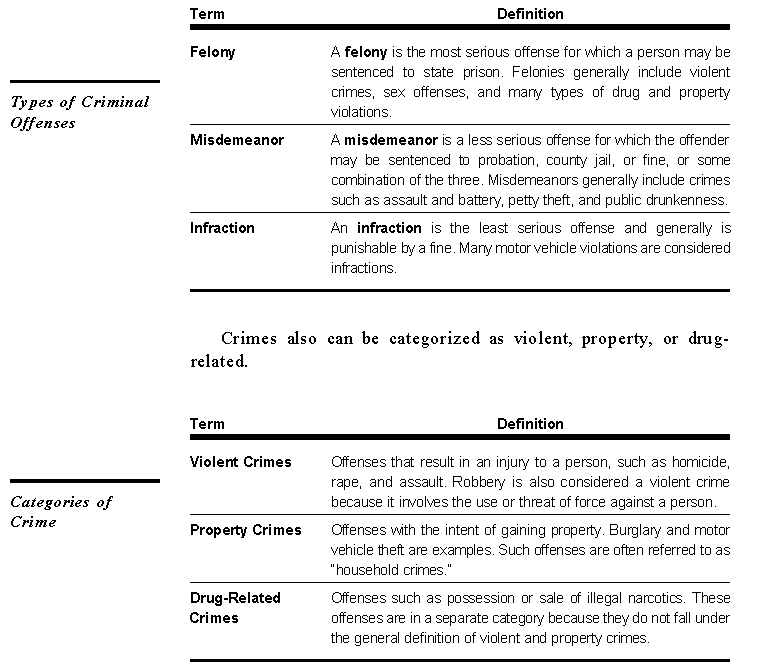
In its simplest definition, "crime" is any specific act prohibited by law for which society has provided a formally sanctioned punishment. This can also include the failure of a person to perform an act specifically required by the law. The law recognizes three broad types of crimes based on the seriousness of the offense, as shown below.
Crime is generally counted in two different ways:
The CCI is the state's official crime count and is maintained by the California Department of Justice. The CCI reports data only on selected crimes, which are chosen because of their seriousness, frequency, and likelihood of being reported to law enforcement. The CCI crimes are homicide, rape, robbery, assault, burglary, and motor vehicle theft. The UCR counts a slightly larger number of crimes.
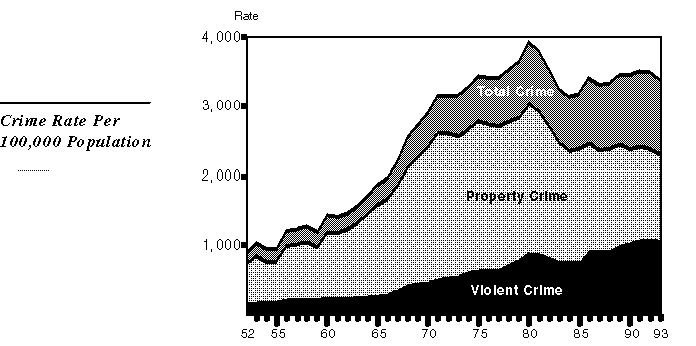
Crime data are often reported in terms of crime "rates." A rate is defined as the number of occurrences of a criminal event within a given population. For example, the overall crime rate in California (according to the CCI) for 1993 was 3,367.8, which means that there were about 3,368 crimes reported per 100,000 Californians in 1993.
It is important to recognize that crime statistics from law enforcement agencies don't tell the entire story. Victimization surveys generally show that there is a significant amount of crime committed each year that goes unreported to law enforcement authorities and therefore is not counted in official statistics. However, the proportion of crime reported to law enforcement agencies has increased steadily since victimization surveys began in the early 1970s.
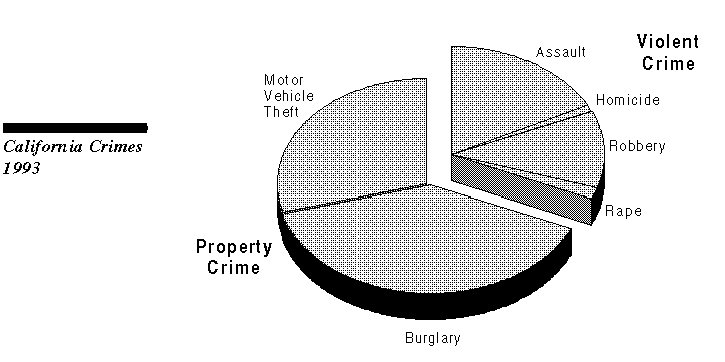
There were 3,368 reported crimes per 100,000 Californians in 1993. Property crime (burglary and motor vehicle theft) accounted for about 70 percent of all crimes reported in California in 1993 and violent crime (homicide, forcible rape, robbery, and aggravated assault) accounted for about 30 percent. The general relationship of violent to property crimes (roughly 30 percent to 70 percent) has remained stable in recent years.
California's crime rate, as measured by the CCI, has increased about 275 percent since 1952. The crime rate reached its peak in 1980, declined for four years, and began to increase in 1985, with much of the decline due to a significant drop in property crime. Although there are many reasons for the decline after 1980, many researchers consider the aging of the population (particularly the aging of "baby-boomers") as the principal reason. The 1993 crime rate dropped slightly from 1992, with slight reductions in both the violent and property crime rates.
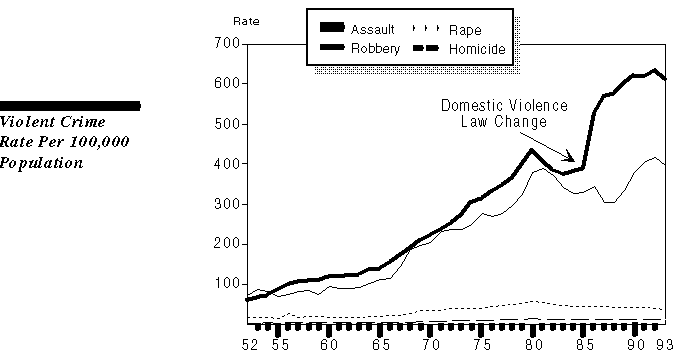
Assault and robbery account for more than 95 percent of all violent crimes reported in California. Both offenses dropped slightly in 1993 (4.8 percent for robbery and 3.4 percent for assault). The substantial increase in reported assaults that occurred in 1986 was due in large measure to enactment of legislation that reclassified domestic violence from a misdemeanor to a felony. Thus, the spike in the assault rate, and the corresponding increase in the overall violent crime rate, was not due primarily to an increase in the number of crimes committed, but rather a change in the way the crimes were reported.
The homicide rate has increased substantially over the years (from 2.4 homicides per 100,000 population in 1952 to 12.9 homicides in 1992), and increased slightly from 1992 to 1993. It remains about 1 percent of overall violent crime. The crime rate for rape, which accounts for about 3.5 percent of the violent crime rate, has been declining almost continuously since it reached its peak in 1980.
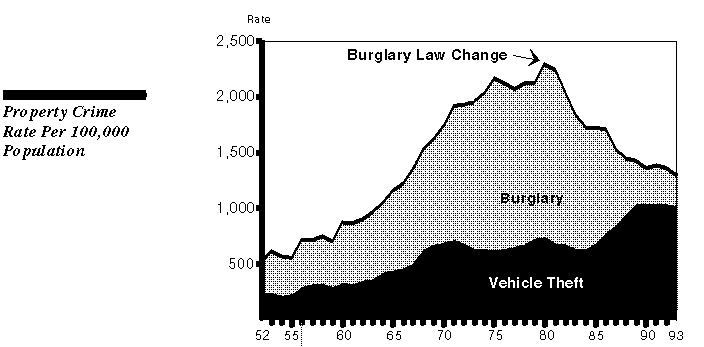
Burglaries declined substantially from a high in 1980, including a 4.5 percent drop from 1992 to 1993. Motor vehicle theft rates increased steadily until 1989 (including a sharp increase between 1984 and 1989); these rates have declined steadily since 1989. The decline in the burglary rate and the sharp increase in the motor vehicle theft rate was probably due to two factors: (1) enactment of legislation in 1980 that denied probation to offenders convicted of residential burglary, thus making motor vehicle theft more attractive, and (2) demographic changes (particularly the aging of the population).
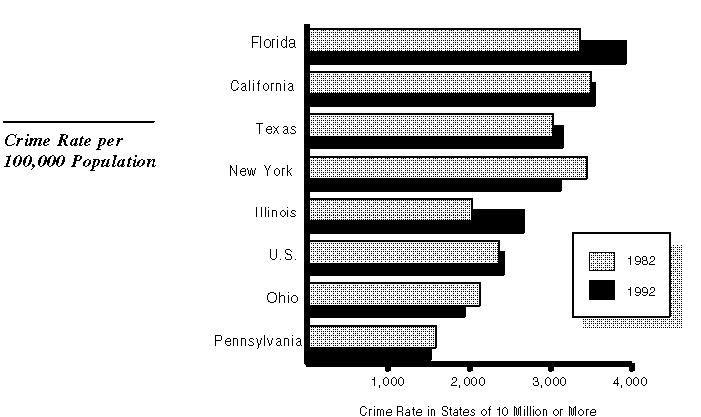
California's 1992 crime rate (the national figures for 1993 are not yet available) is higher than the rate for the nation as a whole and is the second highest among the large states (states with populations of 10 million or more). Florida's 1992 rate was the highest among the large states and was about 11 percent higher than California's rate. The highest rate in the nation is in the District of Columbia, with a rate that is almost twice as high as California's.
As regards violent crime, California ranks third (behind Florida and New York) and concerning property crime, it is second (behind Florida). California ranks first in one individual crime--motor vehicle theft.
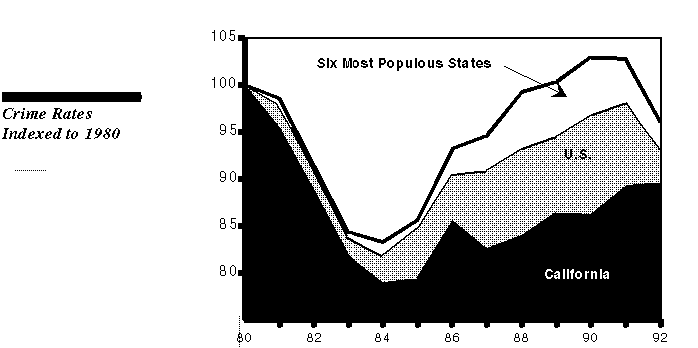
If we review crime rates since 1980, we find that California's crime rate has followed a path similar to that of the nation and the other six most populous states; however, California's rate fell further (from 1980 to 1984) and increased slower (from 1985 to 1991).
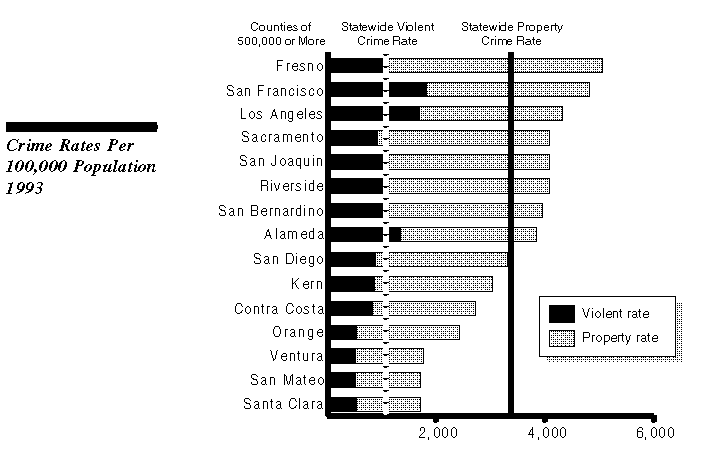
Among those counties with populations of 500,000 or more, Fresno had the highest overall crime rate in 1993--about 50 percent higher than the statewide rate. Santa Clara County's rate was the lowest and was less than half the statewide rate. These rates are largely driven by the property crime rate (Fresno is the highest and Santa Clara is the lowest). In terms of violent crime rate, San Francisco's is highest and Ventura County's is lowest.
Comparing crime rates over the past decade, Santa Clara had the largest drop and Fresno had the largest increase. Some of this change may reflect the changing populations in the crime-prone age groups (Fresno's juvenile population increased by more than one- third in the 1980s and Santa Clara's juvenile population remained relatively stable).
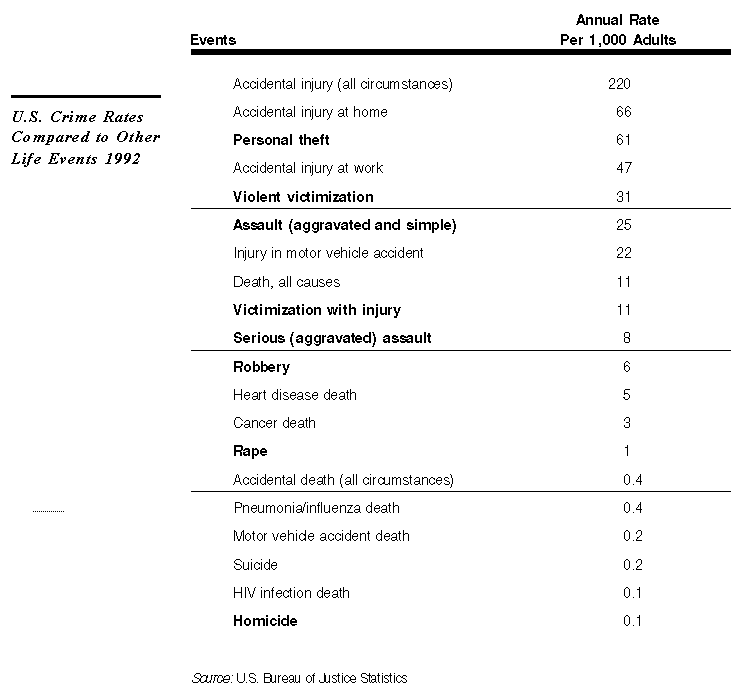
As indicated above, contrary to public perception, total crime is down rather than up in California. Persons are more likely to be victimized by an accident in their own homes than they are by crime, as the following table shows.
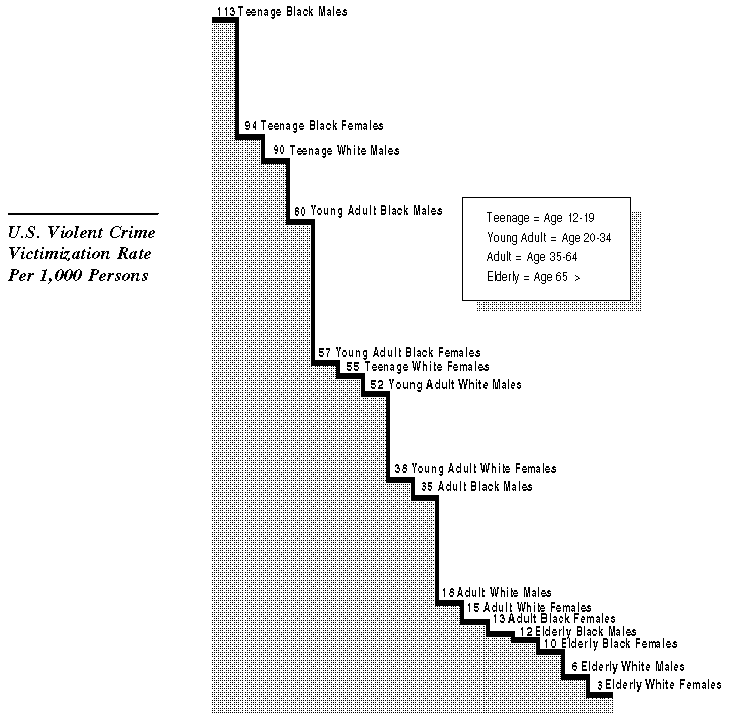
Studies show that groups at the highest risk of becoming victims--young men--are not the ones who generally express the greatest fear of crime--women and the elderly. In fact, men are almost twice as likely as women to be victims of violence, and persons under the age of 20 are almost ten times more likely to be victims than persons over the age of 65. Teenagers--particularly teenage black males--are most often victims of violence and theft. Victims and offenders are of the same race in 80 percent of all violent crimes, and urban dwellers are much more likely to be victims of all types of crime than are persons who live in suburban and rural areas.
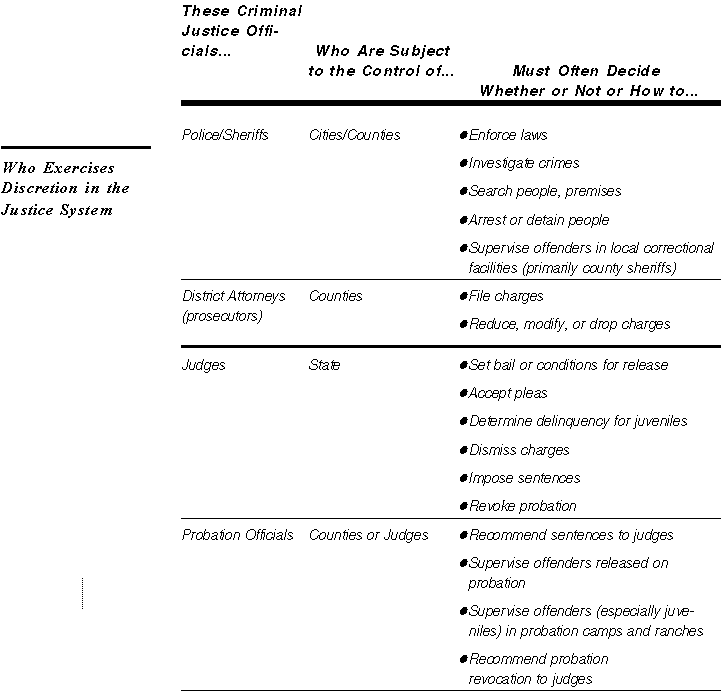
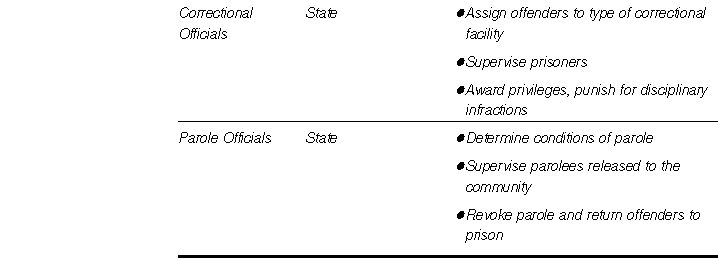
The component parts of California's criminal justice system are, by necessity, closely interrelated (persons arrested by police are prosecuted by district attorneys, decisions as to their fate are made by courts, and punishment and/or treatment is applied by probation and corrections officials).
The criminal justice system includes significant flexibility at various levels. The greatest flexibility is generally at the "front-end" of the process--police and prosecutors. California law, for example, permits law enforcement officials and prosecutors to charge many types of crimes as either a felony or a misdemeanor (known as a "wobbler"), or as either a misdemeanor or an infraction.
The criminal justice system functions as a result of this flexibility and efforts to reduce flexibility could significantly affect the system as a whole. For example, a law that eliminates the ability of prosecutors to reduce the charges against a nonviolent offender could result in greater costs for prosecution, courts, and corrections, thereby limiting resources available to deal with violent offenders or other high-priority matters. Recent legislation, such as the "Three Strikes and You're Out" law, are designed to reduce flexibility in the criminal justice system. (We discuss the "Three Strikes" law in the Adult Populations section.)
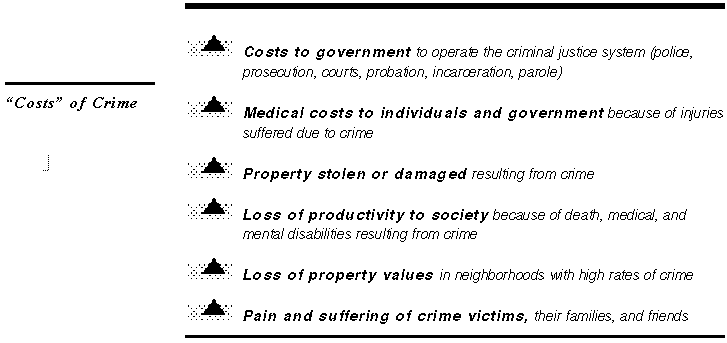
There is much debate about how much crime "costs." Although many studies over the years have attempted to quantify the total direct and indirect costs of crime to government and society, the results have varied widely, but all conclude that the nationwide costs are in the tens to hundreds of billions of dollars annually. The following table identifies the major cost categories of crime.
Some components of the costs of crime (such as government's costs of fighting crime) can be readily estimated. As we indicated earlier, in 1992-93, California spent about $13.8 billion to fight crime.
Other costs of crime cannot be easily measured. For example, many crimes go undetected or unreported--such as fraud, embezzlement, or arson--and thus their costs to society are not captured. Also, some costs are difficult to estimate because the costs are "transferred"; for example, manufacturers and retailers may transfer to consumers the costs for crime prevention activities or losses from crime.
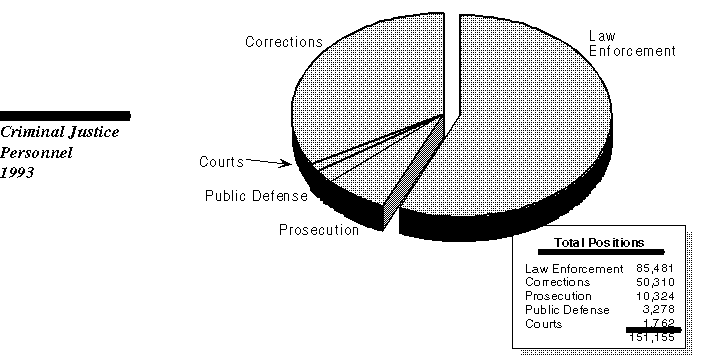
Law enforcement personnel--police, sheriffs, CHP--make up about 57 percent of total criminal justice personnel. This portion has declined from about 66 percent in 1978, although the total number of law enforcement personnel has increased by about 32 percent since that time. Personnel in corrections has grown the fastest, more than doubling since 1978.
CRIME AND THE CRIMINAL JUSTICE SYSTEM
What Is Crime?
Crime "Rates"-- What Do They Mean?
Most Crime Is Property Crime
California's Crime Rate Peaked in 1980
The Most Prevalent Violent Crimes Are Assault and Robbery
Property Crime Down Due to Big Drop in Burglary Rate
California's Crime Rate Higher, But Recent Trends Compare Positively
Local Crime Rates Vary
Public Perception and Reality of Crime Differ
Responding to Crime-- The Criminal Justice System
The Costs of Crime Are Substantial
Most Criminal Justice Personnel Are in Law Enforcement
